DELAWARE TECHNICAL & COMMUNITY COLLEGE
Sustainable Energy Management Plan
Office of the President
Executive Summary
January 2011
Center for Energy and Environmental Policy
Center for Energy and Environmental Policy
Mailing Address:
John Byrne Director
Center for Energy and Environmental Policy University of Delaware Newark, DE 19716-7381 Email: [email protected] Telephone: (302) 831-8405 Telefax: (302) 831-3098 Website: http://ceep.udel.edu
The Center for Energy and Environmental Policy conducts interdisciplinary and collaborative research and supports graduate instruction in energy, environmental, and sustainable development policy. The Center serves as a University-wide forum for the discussion and dissemination of faculty, staff, and graduate student research in these areas. In addition to its research and instructional activities, the Center also provides technical assistance to community, state, federal and international agencies and nonprofit organizations. The Center is composed of an internationally diverse faculty, professional staff, and graduate student body with backgrounds in a variety of disciplines including political science, economics, sociology, geography, philosophy, urban planning, environmental studies, history, and engineering. Research programs currently organized in the Center include comparative energy and environmental policy, sustainable development, political economy of energy, environment and development, environmental justice, conservation and renewable energy options, integrated resource planning, and technology environment and society. Graduate areas of specialization in energy and environmental policy are supported at the master’s and doctoral levels.
DELAWARE TECHNICAL & COMMUNITY COLLEGE
Sustainable Energy Management Plan
Office of the President
Executive Summary
Research Team
Jeremiah Couey (Ph.D., CEEP; prior degrees in mechanical engineering) Daniel Kasper (Ph.D., CEEP; prior degrees in environmental science & geography)
Colin Manasse (Ph.D., CEEP; prior degrees in energy & environmental policy) Xilin Zhang (Ph.D., CEEP; prior degrees in electrical engineering) Peleg Kremer (Ph.D., CEEP; prior degrees in mechanical engineering)
Vasan Srinivasan Chandrasekaran (Ph.D., engineering; prior degrees in mechanical engineering) Zachary Schafer (MEEP, CEEP; prior degrees in economics, history & international relations)
Zach Sharpless (Mechanical Engineering Technology, DTCC)
Advisors
John Byrne (Ph.D., Distinguished Professor of Energy and Climate Policy, Director of CEEP) Lado Kurdgelashvili (Ph.D., CEEP Policy Fellow)
Acknowledgements
Delaware Technical & Community College
Gerard McNesby, Vice President for Finance
Stanton and Wilmington Campuses
Mark T. Brainard, Assistant Campus Director John A. Fogelgren, Jr., Director of Administrative Services Eddie Cunningham, Assistant Director of Administrative Services
John E. Szotkiewicz, Superintendent of Buildings & Grounds
Owens Campus at Georgetown
George Booth, Assistant Director of Administrative Services William R. Beauchamp, Superintendent of Buildings & Grounds
Terry Campus at Dover
William Ayers, Director of Administrative Services John A. Schaible, Chief of Public Safety
i
TABLE OF CONTENTS
Executive Summary ... 1
Selection Criteria ... 3
Projected Energy & Emission Trends ... 3
College and Campus-by-Campus Energy and Emissions Inventories ... 5
College Energy Savings & Emissions Reduction Potential ... 8
Summary ... 14
LIST OF TABLES
TABLE 1: Executive Summary of Actions in the SEMP ... 3TABLE 2: Total Energy Use and CO2 Emissions for Each Campus ... 7
TABLE 3: Summary of Campus Action Plans ... 11
LIST OF FIGURES
Figure 1: BAU and SEMP Energy Use Trends ... 5Figure 2: Planning for Change ... 5
Figure 3: Energy Inventory by Campus ... 6
Figure 4: Total College Emissions and Campus-by-Campus Breakdown ... 7
Figure 5: Average Payback Period for All Campus Projects ... ……9
Figure 6: Average Cost of CO2 Abatement for All Campus Projects ………..………..….………... 10
Executive Summary
The Sustainable Energy Management Plan (SEMP) developed for Delaware Technical & Community College (DTCC) enables the institution to reduce its vulnerability to rising energy costs while
contributing to international efforts to avert climate change. With this Plan, DTCC joins a growing number of educational institutions taking action to concretely support the shift to a green energy economy. The Plan reinforces the commitment of DTCC’s leadership to train the workforce for the new economy by having each campus serve as a green energy learning laboratory.
The SEMP is based on an Energy Use Inventory prepared for each campus location (Stanton, Wilmington, Georgetown and Dover). Separate campus reports were produced that specify energy consumption characteristics for the four campuses, along with Action Plans targeting projects available within a 10-year timeframe that recognize the distinct features of the campuses. This Executive Summary provides an overview of each campus energy assessment and cost-saving opportunities. Major findings and a summary of the campus action plans are discussed below. We are pleased to report that DTCC is a leader in the community college network for energy sustainability. Only 108 campuses of the 1,177 public and independent community colleges have established robust action plans to manage their energy systems and reduce their climate impact.1
Among these, only 18 institutions have plans that approximate DTCC’s commitment to a 20% or more reduction in fossil energy use and greenhouse gas emissions over the next ten years. Thus, the Delaware Technical & Community College is at the forefront of the green campus movement in the United States, ranking among the top 1%.
The major findings of the SEMP are as follows:
1. The SEMP recommends that the College adopt a goal of reducing conventional energy use by 20% from its projected 2020 level and, correspondingly, lower its CO2 emissions by 20%.
1 See The American College & University Presidents’ Climate Commitment - Reporting Institutions for an updated listing of commitments, inventories, and action plans. Available at: http://acupcc.aashe.org/
2
2. Adoption of the 10-year goal by the College will result in estimated annual energy bill savings of nearly $600,000.
3. DTCC adoption of the SEMP will place it among the top 1% of community colleges in the country and at the forefront of the green campus movement in the United States.
4. Leadership by the College in this critical area will enhance its role of helping Delaware and the Mid-Atlantic region to transition to sustainable energy future. Indeed, DTCC’s efforts are essential to the realization of a regional green economy.
The recommended SEMP goal of a 20% greener energy2 mix by 2020 is ambitious. While it applies
only to campus buildings (transportation, landscaping, waste management and water use were not considered), the Plan will require significant actions by the College to reduce the direct burning of fossil fuels (mainly, natural gas and heating oil) and to lower its electricity consumption. Direct burning of fossil fuels in 2008-09 released 2,692 metric tons of CO2 (MTCO2), while indirect emissions
traceable to campus building electricity use accounted for 84% of total College building releases – 14,039 MTCO2. The Plan includes a detailed menu of actions to meet the 20% target. Because the
cost of some is modest and economic benefits accrue quickly (e.g., many pay back their costs through energy bill savings in less than three years), the SEMP proposes a three-year action plan to capture “the low-hanging fruit.” Changes in capital equipment that have long-term benefits but high initial costs are scheduled for completion through a 10-year plan. Table 1 summarizes the range of actions in the SEMP.
2 The report includes energy conservation, improvements in energy efficiency and the use of onsite renewable energy generation in
the term “green energy.” Reduced consumption is estimated on the basis of the trend in current energy use. Onsite renewable energy generation is credited with the reduction in CO2 emissions corresponding to the trend in emissions of CO2 per 15Wh of the regional grid, PJM. EIA data are at: http://tonto.eia.doe.gov/state/SEP_MoreEnviron.cfm, PJM data on fuel mix are at:
http://www.pjm-eis.com/documents/documents.html, and the trend in PJM emissions reductions is at: http://www.pjm.com/documents/~/media/documents/reports/co2-emissions-report.ashx
3 TABLE 1
Executive Summary of Actions in the SEMP
Action* Action Plan Phase to Del Tech Initial Cost Annual Savings
Annual Energy Savings (mmBTU) Annual CO2 Savings (MT) Average Payback Year**
Chiller Free Cooling (S,G) 3-‐year $125,000 $102,983 3,195 543 1.2 Vending m/c energy
management 3-‐year $7,200 $4,228 131 22 1.7
Gym & Cafeteria Lighting
(S,G,D) 3-‐year $46,809 $24,680 766 130 2.1 Parking Garage Lighting (W) 3-‐year $42,572 $14,781 459 78 3.0 Photovoltaic Solar Panels 3-‐year 0.13/kWh $0.09-‐ $105,666 11,998 2,040 3.0 HVAC Replacement (G,D) 3 & 10-‐year $25,000 $35,198 1,092 186 2.7 General Lighting Efficiency 3 & 10-‐year $797,518 $141,967 4,404 749 5.4 Boiler Replacement (W,G) 3 & 10-‐year $70,000 $88,051 3,025 498 4.1 Boiler Oxygen Control (S,D) 10-‐year $40,000 $9,901 794 42 4.1
Reduce Unnecessary
Reheating (W) 10-‐year $50,000 $10,352 940 50 4.5 VSD Cooling Towers (W) 10-‐year $107,400 $21,418 664 113 4.8 Reduce Overcooling (W) 10-‐year $70,000 $13,823 429 73 4.8 Exterior HVAC Ductwork (S,G) 10-‐year $29,956 $2,995 267 14 4.9
Summed Total -- $1,411,454 $576,044 28,164 4,537 --
* Projects that are only available on specific campuses are labeled using the first letter of the campus location (i.e., S = Stanton, W = Wilmington, G = Georgetown, & D = Dover).
** Average Payback Year denotes the average of simple paybacks for the menu of Actions listed in the table.
*** In the case of PV, Annual Savings denotes the average annual savings over the 25-year life of the solar power equipment.
Selection Criteria
Multiple energy uses in College buildings were considered for the SEMP and, accordingly, each campus action plan reflects options that are tailored to a location’s needs and opportunities. Actions that could showcase the College's leadership in research, technological innovation, and policy creativity are given special attention. Criteria for project selection included the initial cost, payback period, effectiveness in reducing energy use, environmental sustainability and reduced CO2
4
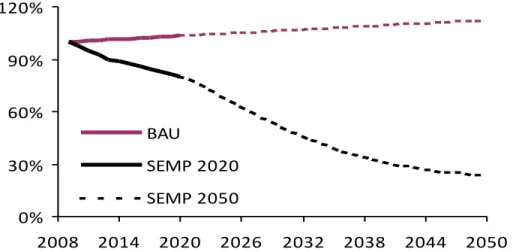
Projected Energy & Emission Trends
In evaluating energy trends for the College, a business-as-usual (BAU) estimate is made using FY 2009 as the baseline period. Projecting a 10-year or longer trajectory for all four campuses is fraught with uncertainties and complications. The purpose of the BAU is not to estimate yearly use, but to capture the trend in College energy and emissions if there are no changes from past practice. Obviously, change will occur – new buildings will be added and renovations will occur. These cannot be reflected in the BAU trend because they are unknown.
Instead of forecasting the unknown, a BAU trend analysis enables the College to evaluate the impacts of what it can know and affect, namely, the actions it can plan which will measurably change the institution’s future use. The BAU case serves this purpose – the College can gauge the impact of its planned actions.
The BAU estimate shown in Figure 1 aggregates the energy use estimates for the four campuses. Over the 10-year horizon, the SEMP anticipates progress toward the College-wide goal of greater than 10% within three years followed by additional reduction actions that combine to produce at least a 20% reduction in energy use and carbon emissions by 2020. After 2020, the College will need to plan for continued actions in order to contribute fully to a proposed national commitment, announced by President Obama3 on April 22, 2009 of a reduction in carbon emissions by 2050 of at least 80%
from current levels. The projection to 2050 of the SEMP in Figure 1, illustrates the process of greening DTCC’s energy mix and possibly, its transportation, water use and waste management strategies.
5 Figure 1: BAU and SEMP Energy Use Trends
The SEMP should be treated as a “living document,” continuously updated to reflect new opportunities and new technology. It can both remind the College community of the challenge of being a
sustainable leader and the Plan can also attract the creativity and commitments of faculty, staff and students to design and practice a sustainable future for the institution and the region.
Figure 2: Planning for Change
College and Campus-by-Campus Energy and Emissions Inventories
The energy and emissions inventories completed under the SEMP begin at the campus level. Activities vary from campus to campus and knowledge of energy end uses must take this into
account. For instance, heavy machinery like mills, lathes and welding equipment can use much more Inventory/Audit Action Plan Improvements Monitoring Implementation 0% 30% 60% 90% 120% 2008 2014 2020 2026 2032 2038 2044 2050 BAU SEMP 2020 SEMP 2050
6
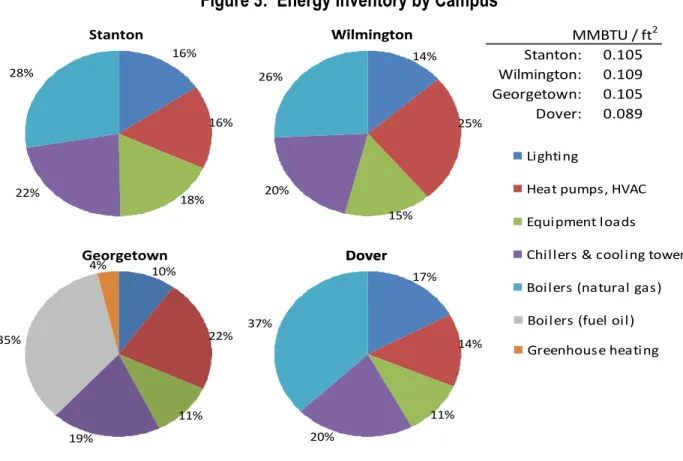
energy compared to building space dedicated to classroom instruction. Figure 3 presents the results of the energy end use inventories of the four campuses.4 The estimated energy intensity for each
campus is nearly equivalent – approximately 0.1 mmBTU/ft2 for each campus. As a metric for
performance, this value is consistent with average building performance for schools generally5 and is
equivalent to the national average for buildings of comparable size as reported by the U.S. Energy Information Administration (EIA) in 2003.6
Figure 3: Energy Inventory by Campus
Lighting Heat pumps, HVAC Equipment load Chillers & cooling towers Boiler natural gas
16% 16% 18% 22% 28% Stanton Lighting
Heat pumps & electric boilers Equipment load
Chillers & Cooling towers Natural gas for boilers
14% 25% 15% 20% 26% Wilmington Lighting
AC Units, pumps, fans, elect. heater
Equipment load Chillers & cooling towers Boiler fuel oil
Greenhouse heating 10% 22% 11% 19% 35% 4% Lighting
AC Units, pumps, fans, heat pumps, etc.
Equipment load Chillers & cooling towers Natural gas for the boilers
17% 14% 11% 20% 37% Dover Georgetown MMBTU / ft2 Stanton: 0.105 Wilmington: 0.109 Georgetown: 0.105 Dover: 0.089 Lighting
Heat pumps, HVAC Equipment loads
Chillers & cooling towers Boilers (natural gas)
16% 16% 18% 22% 28% Lighting
Heat pumps, HVAC, elect. heater
Equipment loads
Chillers & cooling towers Boilers (fuel oil)
Greenhouse heating 10% 22% 11% 19% 35% 4% Lighting Heat pumps, HVAC Equipment load Chillers & cooling towers Boiler natural gas
16% 16% 18% 22% 28% Stanton Lighting
Heat pumps & electric boilers Equipment load
Chillers & Cooling towers Natural gas for boilers
14% 25% 15% 20% 26% Wilmington Lighting
AC Units, pumps, fans, elect. heater
Equipment load Chillers & cooling towers Boiler fuel oil
Greenhouse heating 10% 22% 11% 19% 35% 4% Lighting
AC Units, pumps, fans, heat pumps, etc.
Equipment load Chillers & cooling towers Natural gas for the boilers
17% 14% 11% 20% 37% Dover Georgetown MMBTU / ft2 Stanton: 0.105 Wilmington: 0.109 Georgetown: 0.105 Dover: 0.089 Lighting
Heat pumps, HVAC Equipment loads
Chillers & cooling towers Boilers (natural gas)
16% 16% 18% 22% 28% Lighting
Heat pumps, HVAC, elect. heater
Equipment loads
Chillers & cooling towers Boilers (fuel oil)
Greenhouse heating 10% 22% 11% 19% 35% 4%
For carbon dioxide emissions, each campus has a similar breakdown to the one seen in the energy profiles, where variation from campus to campus is chiefly due to enrollment difference, and the size
4 All buildings of the four campuses were audited using methods developed by the U.S. Department of Energy for its Industrial Assessment Center program. See http://www1.eere.energy.gov/industry/bestpractices/about_iac.html, and
http://iac.rutgers.edu/manual_industrial.php. Graduate students from CEEP and the College of Engineering of the University of Delaware were joined by DTCC students and staff in conducting the audits.
5 For example, see Figure 2.2 Energy Use Index for Building Type, pg 16 in Handbook of Energy Audits, 7th Edition by Albert
Thumann, William J. Younger
6 See building floorspace 200,001 to 500,000 in “Table E2A. Major Fuel Consumption (Btu) Intensities by End Use for All Buildings, 2003” available from the EIA at: http://www.eia.doe.gov/emeu/cbecs/cbecs2003/detailed_tables_2003/2003set19/2003pdf/e02a.pdf
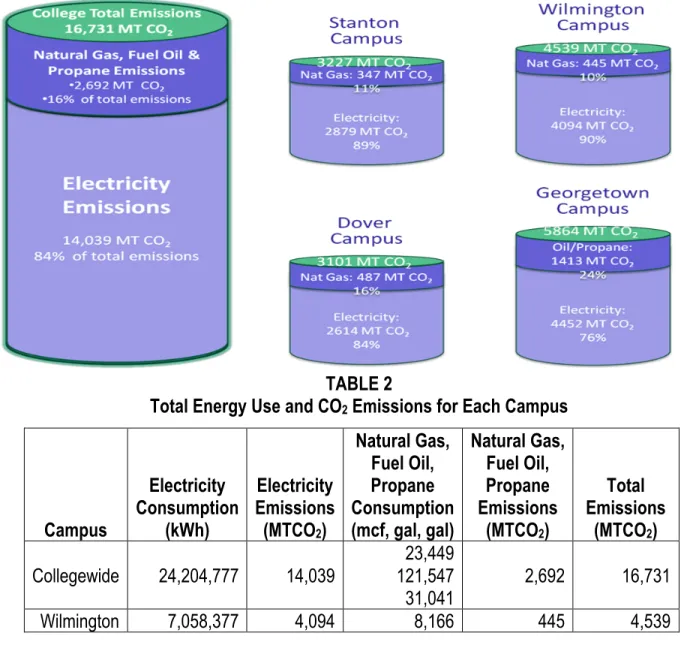
7
of the campus building stock. Some variation is also due to different equipment in use. For this reason, savings opportunities and the scale of impact of technologies will differ for each campus. Aggregating the emissions for the entire College, the direct burning of fossil fuels resulted in 2,692 metric tons (MT) of carbon dioxide emitted per year, while indirect emissions from using electricity resulted in 14,039 MTCO2 per year, or 84% of the College total of 16,731 MTCO2 in fiscal year 2009
(Figure 4 and Table 2).
Figure 4: Total College Emissions and Campus-by-Campus Breakdown
TABLE 2
Total Energy Use and CO2 Emissions for Each Campus
Campus Electricity Consumption (kWh) Electricity Emissions (MTCO2) Natural Gas, Fuel Oil, Propane Consumption (mcf, gal, gal) Natural Gas, Fuel Oil, Propane Emissions (MTCO2) Total Emissions (MTCO2) Collegewide 24,204,777 14,039 23,449 121,547 31,041 2,692 16,731 Wilmington 7,058,377 4,094 8,166 445 4,539
8 Stanton 4,964,050 2,879 6,364 347 3,227 Dover 4,507,152 2,614 8,921 487 3,101 Georgetown 7,675,198 4,452 121,547 31,041 1,234 179 5,864 Using the results of the inventory and building audits, a portfolio of initiatives were developed for each campus that will ultimately result in the College reducing energy consumption, stabilizing power demand, and making a significant reduction in its carbon footprint.
Many of the same initiatives can be implemented throughout all of the campuses, but several projects are unique to one or two campuses. College-wide collaboration will enable economies of scale by sharing knowledge, experience and coordinating implementation. Summing the energy savings available (and estimating the savings from solar power generation under a competitively-bid power purchase agreement7), the College could reduce its energy bills by nearly $600,000 per year (see
Table 1, column labeled “Annual Savings”).
College Energy Savings & Emissions Reduction Potential
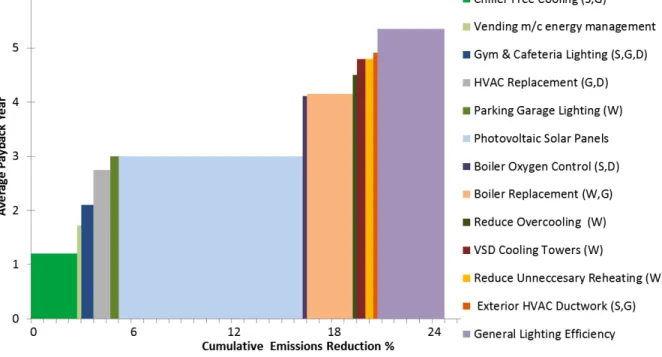
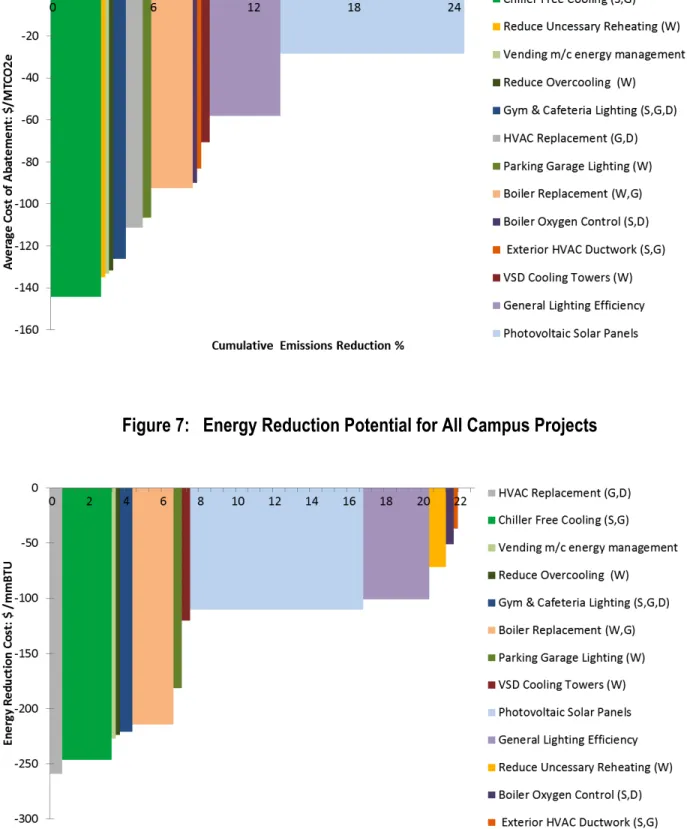
To illustrate the energy savings reductions potential for the College, the following three figures combine the action plans for all four campuses. In each figure, projects that are only available on specific campuses are labeled using the first letter of the campus location (i.e., S = Stanton, W = Wilmington, G = Georgetown, & D = Dover). Figure 5 shows the average payback period for the combined campus projects.
Savings of more than 25% of the BAU projected energy use by DTCC have been identified, allowing the College to choose options for implementation. As Figure 5 notes, more than 80% of the savings pay back their initial costs in less than five years and 100% have paybacks that are less than six years. The CEEP research team also assessed the value of LED parking lot lighting on the
7 Currently, it is cost-effective to secure solar energy through a power purchase agreement in which the College agrees to use its land and roof areas to host solar panels and buying the electricity from the panels at a specified price over a 10- to 20-year period. Under this arrangement, federal tax benefits available only to private companies can be optimized and DTCC can avoid all capital costs. For a detailed discussion of this approach, see CEEP’s study for the City of Newark (2009), available at: http://ceep.udel.edu.
9
Georgetown, Stanton, and Dover campuses. While the payback is currently in excess of 12 years, outside the 10-year timeframe of the SEMP, the team suggests revisiting this option in the near future, as rising electricity prices and continued improvements in this technology may lower the breakeven year considerably in the next four years or so.
Figures 6 and 7 record the net cost to the College of the measures reported in Figure 5. Measures with bars below the horizontal zero-cost line actually save money for the College. That is, the lower energy bills accompanying the implementation more than pay for the cost to implement them. Figure 6 records the cost to reduce College emissions by one ton and Figure 7 indicates the cost per unit of energy saved. The same measure can produce different savings rates. For example, eliminating unnecessary reheating of areas in a building can be accomplished by low-cost building management strategies. Because reheating relies on high-carbon electricity in Wilmington, the impact of the measure on carbon emissions is greater than on energy use. Nonetheless, in both cases, it saves money while improving the College’s carbon footprint.
10 Figure 6: Average Cost of CO2 Abatement for All Campus Projects
11
Table 3 summarizes the costs and benefits of each project on each campus. Detailed information is provided in the four campus reports.
TABLE 3
Summary of Campus Action Plans
Wilmington
Wilmington Action
Action Plan
Phase Initial Cost to Del Tech Annual Savings
Annual Energy Savings (mmBTU) Annual CO2 Savings (MT) Payback Year
Vending m/c energy management 3-‐year $2,000 $1,349 42 7 1.5 Parking Garage Lighting 3-‐year $42,572 $14,781 459 78 3.0 Photovoltaic Solar Panels 3-‐year $0.09-‐0.13/kWh $22,632* 1,941 330 3.0 Remove Unnecessary Reheating 10-‐year $50,000 $10,352 940 50 4.5 VSD Cooling Towers 10-‐year $107,400 $21,418 664 113 4.8 Reduce Overcooling 10-‐year $70,000 $13,823 429 73 4.8 General Lighting Efficiency 10-‐year $286,175 $38,157 1,184 201 7.0 Boiler Replacement 10-‐year $70,000 $7,697 687 37 8.2 * Based on assumed installed capacity of 461 kW and savings per solar kWh of $0.02.
Stanton
Stanton Action
Action Plan
Phase Initial Cost to Del Tech Annual Savings
Annual Energy Savings (mmBTU) Annual CO2 Savings (MT) Payback Year
Chiller Free Cooling 3-‐year $45,000 $33,794 1,048 178 1.3 Vending m/c energy management 3-‐year $2,200 $1,218 38 6 1.8 Gym & Cafeteria Lighting 3-‐year $35,041 $18,529 575 98 1.9 Photovoltaic Solar Panels 3-‐year $0.09-‐0.13/kWh $8,478* 1,074 183 3.0 Exterior HVAC Ductwork 10-‐year $3,780 $703 63 3 4.0 Boiler Oxygen Control 10-‐year $20,000 $3,659 238 13 5.1 General Lighting Efficiency 10-‐year $245,646 $30,350 941 160 7.5 * Based on assumed installed capacity of 255 kW and savings per solar kWh of $0.02.
12
Dover
Dover Action
Action Plan
Phase Initial Cost to Del Tech Annual Savings
Annual Energy Savings (mmBTU) Annual CO2 Savings (MT) Payback Year
Vending m/c energy management 3-‐year $2,200 $1,218 38 6 1.8 Gym & Cafeteria Lighting 3-‐year $5,492 $1,868 58 10 2.9 General Lighting Efficiency 3-‐year $105,000 $34,119 1,058 180 3.0 Photovoltaic Solar Panels 3-‐year $0.09-‐0.13/kWh $23,272* 2,948 501 3.0 Oxygen Control 10-‐year $20,000 $6,242 557 30 3.1 HVAC Replacement 10-‐year $25,000 $4,352 135 23 5.4 * Based on assumed installed capacity of 700 kW and savings per solar kWh of $0.02.
Georgetown
Georgetown Action
Action Plan
Phase Initial Cost to Del Tech Annual Savings
Annual Energy Savings (mmBTU) Annual CO2 Savings (MT) Payback Year
Boiler Replacement 3-‐year $0 $80,354 2,338 461 0.0 HVAC Replacement 3-‐year $0 $30,846 957 163 0.0 Chiller Free Cooling 3-‐year $80,000 $69,189 2,146 365 1.1 Gym & Cafeteria Lighting 3-‐year $6,276 $4,283 133 23 1.5 Vending m/c energy management 3-‐year $800 $443 14 2 1.8 Photovoltaic Solar Panels 3-‐year $0.09-‐0.13/kWh $51,284* 6,035 1,026 3.0 General Lighting Efficiency 10-‐year $160,697 $39,341 1,220 207 3.9 Exterior HVAC Ductwork 10-‐year $26,176 $2,292 204 11 5.8 * Based on assumed installed capacity of 1423 kW and savings per solar kWh of $0.02.
To illustrate how a specific measure creates value for the College community, the case of using solar power on the Stanton campus is used. The Stanton campus has the opportunity to install solar panels (often called photovoltaic or PV panels) on its building(s) to generate electricity. Photovoltaic power utilizes energy from sunlight to create electricity. Since electric generation using this technology is fueled directly by solar energy, no greenhouse gases are emitted. Replacing conventional electricity with solar power has the potential to significantly reduce the College’s carbon footprint. An additional benefit of PV power is its low maintenance and operations costs.
The research team explored options for use of this technology on each campus. For the Stanton campus, a detailed survey of building roofs, garages and ground mount locations was conducted to
13
determine suitable host sites. Financial analyses were also performed using a power purchase agreement (PPA) model involving third-party ownership for at least a part of the technology’s useful life.8 This model is equivalent to the one developed by CEEP for the University of Delaware and the
City of Newark.
The financial basis for this decision is simple: the College will seek, through a competitive bidding process, to purchase power from the solar plant hosted on its campus at a cost equivalent to its current and projected electricity prices. Perhaps, the College might consider paying an initial green premium of 1.0 to 2.0 cents per kWh if the later years of a PPA recover the initially higher costs. Based on a projection of the likely long-term cost of electricity from non-renewable sources, it is expected that College payments for solar electricity will be less than it would cost to purchase grid power in 3-8 years.9 Because the College will not initially own the solar plant, it will incur no capital
cost.
For the Stanton Campus, the solar electricity generation plan is based on installing a 255kW system located on the “good condition” rooftop surfaces.10 Total rooftop capacity for the campus based on
current model efficiencies is estimated at 800 kW. Installing the 255kW system would enable the Stanton campus to generate 314,679 kWh of energy, or approximately 6% of their annual electricity consumption.
Initial Cost Annual Energy Savings Annual Cost Savings Payback Annual CO2 Savings (Metric Tons) $0.09-0.13/kWh* 314,679 kWh $8,478** ~3 years 184
*Represents a range for an initial PPA price of electricity; the initial price and escalation rate would be negotiated in the PPA contract.
**Based on an assumed installation capacity of 255 kW at the Stanton Campus and savings per solar kWh of $0.02.
8 Third-party ownership is necessary to capture tax benefits available under federal law only to private owners.
9 DTCC recently held bids for a solar power purchase agreement that yielded prices per kWh below electricity rates currently paid by
the College.
10 Only rooftop surfaces categorized as in “good condition” are considered. Further potential exists after scheduled rooftop resurfacing and maintenance are performed.
14
The College is able to install photovoltaic systems at each campus and the combined capacity for all the campuses might be as high as 5 megawatts (MW) based on all proper rooftop areas.11 If this
technology is installed by a private company and billed at a lower cost per kWh than future
conventional electricity prices, the College reduces its energy costs over the long term (panels have useful lives of 25 years), requires less electricity from the grid (much of which is currently supplied by coal power plants, which have the highest carbon emissions per kWh of electricity supplied), and helps the region to transition to a sustainable future. The equipment also provides an exceptional learning opportunity for faculty and students, both during and after installation.
Summary
The potential for the College to cost-effectively reduce energy demand and generate its own energy in a sustainable manner is substantial. Actions described in the SEMP will serve to strengthen the leadership of Delaware Technical & Community College as a green learning and doing model for Delaware and the region. The Plan can be integrated into the College’s educational and outreach programs and can become a point-of-departure for the community to innovate new approaches and new knowledge needed to be the challenge of sustainability.
The proposed projects will continue the progress made by the College in reducing energy demand. For example, all campuses have installed high efficiency lighting – changing T-12 fluorescent bulbs to the more efficient T-8 models, using compact fluorescent lamps where available, and upgrading exit signs to ultra-high efficiency light emitting diode lamps.
As an educational institution, DTCC has shown a serious commitment to programs, policies and technology developments that can help its campuses and the wider community to implement more sustainable practices consistent with sustainability education goals. Essential to this process, engagement and involvement of all members of the community is indispensable. Each campus report discusses Green E-Letter or Green Liaison programs that can invite the creativity of faculty,
11 5 MW includes all rooftop areas permissible for photovoltaic installation; this decreases to 2.8 MW for “good condition” rooftop surfaces at the time of this report.
15
students and staff to improve and expand upon the SEMP. If Delaware Technical & Community College decision-makers can harness the ideas and energy of its members, the prospects for a sustainable future brighten.