Do Reentry Courts
Reduce
Recidivism?
Results from the Harlem Parole Reentry Court
research
By Zachary Hamilton March 2010
Acknowledgements Page i
ACKNOWLEDGEMENTS
This evaluation would not be possible if it were not for the assistance of several individuals and agencies. I would like to acknowledge the Division of Parole for partnering on the construction, implementation and operation of the Harlem Parole Reentry Court program. In addition, I wish to thank Parole Officers Carmen Lavine, Yvonne Oliver, Senior Parole Officer Alfonso Camacho and Jill Leonard for their assistance in obtaining process and implementation data included in the report. I would like to thank the New York State Division of Criminal Justice Services (DCJS) for providing the sample and recidivism data used in the evaluation. The author is solely responsible for the methodology and results obtained with the DCJS data. Additional thanks to Center staff Mike Rempel, Dana Kralstein, Chris Watler, John Megaw, Greg Berman, Al Siegel, Nigel Jackson and Don Farole for analytic, methods and editorial support.
Table of Contents Page ii
TABLE OF CONTENTS
SECTION TITLE PAGE
EXECUTIVE SUMMARY i-iv
CHAPTER 1 - INTRODUCTION 1
Evaluation Report 1
CHAPTER 2 - THE STATE OF PRISONER RENTRY 2-7
INCARCERATION TRENDS 2
REENTRY TRENDS 3
REENTRY EFFORTS 4
ARRAY OF NEEDS AND CHALLENGES 4
REENTRY PROBLEM SOLVING 7
CHAPTER 3 - THE REENTRY COURT MODEL 8-13
ACTIVE INGREDIENTS OF THE REENTRY COURT MODEL 8 HARLEM PAROLE REENTRY COURT MODEL 9
REENTRY EVALUATIONS 11
CHAPTER 4 - STUDY DESIGN AND ANALYSIS PLAN 14-19
REENTRY COURT PROFILE 14
COMPARISON SAMPLE CONSTRUCTION 15
OUTCOME MEASURES 18
ANALYTIC PLAN 19
CHAPTER 5 - RESULTS 20-28
RECIDIVISM AND REINCARCERATION RATES 20
COX REGRESSION ANALYSES 21
ROLE OF DURATION 23
PREDICTORS OF GRADUATION 27
CHAPTER 6 - DISCUSSION AND CONCLUSION 29-34
PROGRAM IMPACT 29
STUDY LIMITATIONS 31
POLICY IMPLICATIONS 32
REFERENCES 35-40
TABLE TITLE PAGE
Table 4.1 Reentry Court Participant Profile 16 Table 4.2 Baseline Characteristics of Reentry Court and Comparison Group Sample Before and
After Propensity Score Matching
17 Table 4.3 Impact Outcome Descriptives 19 Table 5.1 Recidivism Outcomes by Group 21 Table 5.2 Logistic Regression Three-Year Rearrest and Revocation Outcomes 26 Table 5.3 Descriptives for Additional Measures in the Graduation Model 27 Table 5.4 Logistic Regression Predicting Reentry Court Graduation 28
FIGURE TITLE PAGE
Figure 5.1 Cumulative Rearrest Hazards of Reentry Court Participants Versus Comparison Group
Subjects up to Three Years Following Incarceration 22 Figure 5.2 Cumulative Revocation Hazards of Reentry Court Versus Comparisons Group Subjects
up to Three years Following Incarceration
23 Figure 5.3 Time in Program on Two-and Three-Year Rearrests and Revocations 25
Executive Summary Page iii
EXECUTIVE SUMMARY
The Harlem Parole Reentry Court was established in June of 2001 in response to the high concentration of parolees returning to the East Harlem neighborhood of Manhattan. Created by the Center for Court Innovation in cooperation with the New York State Division of Criminal Justice Services and the Division of Parole, the Reentry Court provides intensive judicial
oversight, supervision and services to new paroleesduring the first six months following release from state prison.The goal of the program is to stabilize returning parolees in the initial phase of their reintegration by helping them to find jobs, secure housing, remain drug-free and assume familial and personal responsibilities. Following graduation, participants are transferred to traditional parole supervision, where they may continue to receive case management services voluntarily through the Reentry Court.
There are presently at least two dozen specialized reentry courts operating nationwide, but little is known about their operations and effects. The current report assesses the impact of the Harlem Parole Reentry Court following program modifications that were implemented after an initial formative evaluation. A quasi-experimental design was utilized, comparing Reentry Court participants with otherwise similar parolees placed in traditional supervision. From a pool of 20,750 parolees released in Manhattan from November 2002 through February 2008, 317
Reentry Court participants were matched to 637 comparison parolees utilizing a 2 to 1 propensity score matching procedure. Sample parolees were then tracked over three years from their release.
Impact findings include:
• Rearrests: Reentry Court parolees (including both graduates and failures) were less likely to be rearrested, although only some effects approached statistical significance
(misdemeanor rearrests over the first year and drug-related rearrests over the first two years).
• Reconvictions: Reentry Court parolees were less likely to be reconvicted, and the effects were significant at one, two, and three years (43 percent versus 53 percent at three years). • Revocations: Reentry Court parolees were more likely to be revoked and returned to
prison.
o Revocations for technical violations were significantly higher at one, two, and
three years (15 percent versus 8 percent at three years).
o Revocations (for any reason) were significantly higher after two and three years
(56 percent versus 36 percent at three years)
• Role of Program Completion: Additional analyses indicated that Reentry Court parolees who completed the program experienced lower odds of rearrest and revocation. Pre-intervention characteristics that were associated with a greater likelihood of program completion included prior parole term, marriage/cohabitation, high school diploma or GED, and prior drug treatment.
Executive Summary Page iv The Reentry Court seems to have had a positive effect with regard to preventing new crimes as measured by rearrests and reconvictions. However, participants were found to have higher rates of revocations. In particular, program participants were more likely to be revoked for technical violations of parole conditions. Given the lower caseload and greater intensity of the program, it is assumed that “supervision effects” are partially responsible for the higher rate of technical violations. In other words, the Harlem Parole Reentry Court may be detecting violations that might otherwise have gone unnoticed. This suggests that reentry courts may want to explore enhancing the use of alternative sanctions in lieu of revocation. Furthermore, reentry courts should explore the possibility of providing greater feedback to parole officers and case managers, making them aware of potential unintended consequences when supervision is increased.
Chapter 1. Introduction Page 1
CHAPTER 1 INTRODUCTION
Since June of 2001, the Harlem Parole Reentry Court has been operating as a programming alternative to traditional parole. The Court attempts to prevent recidivism by easing the transition from prison to community life, linking parolees to a wide range of social services, including drug treatment, transitional employment and vocational services, health care and mental health
treatment. The Reentry Court was developed by the New York State Division of Parole, the New York State Division of Criminal Justice Services and the Center for Court Innovation, with technical assistance from the U.S. Department of Justice, Office of Justice Programs (OJP). The Reentry Court is based at the Harlem Community Justice Center, a multi-jurisdictional
community court project operated by the Center for Court Innovation in partnership with the New York State Office of Court Administration.
Utilizing a problem-solving court model, the Reentry Court teams an administrative law judge with case managers, parole officers and social service providers. The Reentry Court seeks to increase parole compliance through a formalized hearing process, where sanctions and incentives are administered to promote positive behavior and services are provided to assist in the
reintegration process. Working closely with parole and community-based service providers, the Reentry Court utilizes pre-release assessments and coordinated services to assist in transitional planning and ameliorate deficits and barriers to successful reentry.
EVALUATION REPORT
This report examines the Reentry Court’s impact with regard to post-program rearrest,
reconviction and revocation outcomes. This evaluation compares the progress of Reentry Court participants to those on traditional parole released from July, 2002, to February, 2008, on key outcomes across a three-year follow-up period.
Chapter 2 describes the use of incarceration, parole and the current state of community
corrections, with an emphasis on the barriers and other issues pertaining to reentering offenders in East and Central Harlem, New York.
Chapters 3 presents the use of Reentry Courts as a community corrections alternative as well as providing more detail with regard to the Harlem Parole Reentry Court model, describing the program’s mission, operational components and resources.
Chapter 4 presents the evaluation methodology, Reentry Court participants’ descriptive characteristics and initial bivariate comparisons with traditional parolees in the study sample. Chapter 5 presents study findings examining the program’s impact, including: discharge status, one- two- and three-year rearrest, reconviction and revocation measures, survival curves, and multivariate assessments of recidivism and graduation predictors.
Chapter 6 discusses the overall impact of the Harlem Reentry Court and future directions with regard to additional research, policy changes and programmatic modifications.
Chapter 2. The State of Prisoner Reentry Page 2
CHAPTER 2
THE STATE OF PRISONER RENTRY
The creation and implementation of the Harlem Parole Reentry Court did not occur in a vacuum. Before the Harlem Reentry Court opened its doors in 2001, the national, state and local
conditions for reentry offered great challenges for individuals attempting to reintegrate into their community following a term of incarceration in the state prison system. At the time, the
development of the Harlem Reentry Court was viewed as a much needed response to a parole system that returned the majority of offenders back to prison within three years of their release. The period prior to the court’s inception saw a large surge in the nation’s prison population. During the 1980s and 1990s, national prison population estimates increased nearly 600 percent, peaking at well over 2 million parolees in total (Justice Policy Institute, 2003). The result of policies that increased the use of incarceration was an influx of offenders entering the parole system and increasing caseloads for parole staff.
The challenges facing policy makers were not just system capacity problems and increased cost but, human and community problems. As this chapter will illustrate, the needs and deficits of parolees returning from years of incarceration impact the probability of successful reentry. If no attempt is made to ameliorate potential risk factors, recidivism and reincarceration is likely to occur – outcomes that are not desirable for the individuals involved, their neighborhoods or the criminal justice system. This chapter outlines the issues that parolees, their communities and the system face as a result of policy changes that occurred prior to, and during, the implementation of the Harlem Reentry Court.
INCARCERATION TRENDS
The stage for the reentry court was set decades before its inception, with a six-fold increase in the national prison population. Although it is clear that this increase did not occur by accident, it was also not the result of a single policy but a culmination of several actions, taking place in multiple states as part of a political and cultural shift to get “tough on crime.” The use of non-discretionary sentencing guidelines (i.e. “truth-in-sentencing”) and mandatory minimums
inflated, not only the use of prison as a sentencing disposition but also, the length of prison terms as a whole. Most of the rise in incarceration has been attributed to the proportion of
incarcerations per arrest (Blumestien and Beck, 1999), indicating that more people are being sentenced to prison for the same crimes that would not have elicited such a sentence prior to policy shifts (Travis, 2005).
Researchers, scholars, prison administrators and many others have attributed much of the increase in prison populations to federal and state policy shifts occurring in the early 1980s, especially those which heightened sanctions for drug law violations and drug-related crimes (Belenko, 2006; Caulkins and Chandler, 2006; Festinger et al., 2002; Mackenzie, 2000; Marlowe, Patapis and Dematteo, 2003; Mumola, 1999). Increased use of mandatory minimum prison sentences, escalating term adjustments for lower weights of drug possession and a
Chapter 2. The State of Prisoner Reentry Page 3 of drug offenders entering the prison system (Belenko, 2006). From 1980 to 1996 the per capita rate of prison admissions increased by more than 930 percent (Travis, 2005). The Reagan Administration implemented the Crime Control Act of 1984, which dramatically increased federal mandatory minimums for drug-related crimes. Several states ultimately followed suit raising mandatory minimums for many drug offenses (Belenko, 2006).
To some extent the incarceration trends for drug crimes started in New York. In 1973 the Rockefeller Drug Laws went into effect. Sentencing mandates put into action drastically increased the number of new drug offenders being incarcerated. According to the NYS Department of Correctional Services (2008), the percentage of drug offenders in New York prisons ballooned from 11% in 1973 to a peak of 35% in 1994. These laws had a substantial impact in Black and Latino neighborhoods such as East and Central Harlem, as sanctions disproportionately impacted minority residents. Although only representing 33 percent of the New York State population, Blacks and Hispanics represent 94 percent of individuals
incarcerated under the Rockefeller Drug Laws (Drucker, 2002). Only recently has legislation been enacted to eliminate mandatory minimum sentences and expand the role of rehabilitation and alternatives to incarceration in New York State.
REENTRY TRENDS
The same policy shifts that increased the volume of offenders entering the front door of
corrections (prison admission) also increased the number of individuals exiting through the back door (parole). As of 2007, it is estimated that over 725,000 prisoners are released annually (West, 2008) of which the vast majority (nearly 80%) are released to conditional supervision (e.g. parole) (Beck, 2000). The proportion of new releases who have committed drug offenses has also risen dramatically. From 1984 to 2000, the percentage of people released from prison following an incarceration for a drug conviction increased 20 percent. Today, drug offenders’ account for one-third of all prison releases (Hughes, Wilson and Beck, 2001).
The intended purpose of parole has always been to a) assist offenders’ reintegration into society and b) protect the community from recidivism through extended supervision. In recent decades, this two part purpose began to tilt toward the elements that overtly demonstrated “protection of the community.” This policy shift was evidenced by the expanded use of parole revocations. A substantial portion of the increased use of incarceration since 1980 can be attributed to the large numbers of offenders returning via parole violations (Petersilia, 2000). Recent estimates find that one-third of the prison population is currently serving time following a violation of parole
conditions. Travis and Lawrence (2002) reported that more offenders were returned to prison on parole violations than were initially incarcerated (for any reason) in 1980. Furthermore, of those who return to parole on a repeat trip, only 20 percent were successfully discharged. Travis and Lawrence termed cases with a high-risk for return as “churners” for their continual cycle in and out of prison (Travis and Lawrence, 2002).
Chapter 2. The State of Prisoner Reentry Page 4 REENTRY EFFORTS
Supervision Effects
While incarceration trends can be linked to legislative and law enforcement initiatives, reasons for increases in returns for parole violations are harder to pinpoint. Although there is little documentation of how the “tough on crime” era affected parole, several policy changes have been found to increase the rate of parole violations. Parole agencies came to prioritize public safety concerns; they sought to decrease the chances that parolees would recidivate via a new arrest/conviction. These strategies centered on increased supervision. Strategies such as intensive supervision parole (ISP), increased drug testing, and home confinement have all been used in an attempt to reduce new offending. However, evaluations of such efforts have shown comparable findings to traditional parole with regard to new arrests/convictions an increased likelihood of technical violations (Petersilia, 1999).1
For some, these findings are consistent with parole’s mandate to “protect the community”. The theory rests on the idea that noncompliance with parole’s technical conditions can be used as a proxy for criminal behavior. Hence, identifying those likely to recidivate before they have the opportunity to commit new offenses and thus, harm the community is actually a positive
outcome. However, there is no evidence supporting the idea that returning parolees to prison for technical violations prevents new crime (Petersilia and Turner, 1993). Travis, Solomon and Waul (2001) suggest that there is no solid evidence suggesting that merely increasing parole
supervision is an effective crime prevention strategy.
The combination of increased caseloads for parole officers and increased technical violations has resulted in a dramatic increase in negative outcomes for parolees spanning two decades. Glaze (2002) reported that 70 percent of parolees completed their term in 1984 compared to 45 percent completing in 2002. Failure has also been shown to occur rather quickly following release; 68 percent of parolees are rearrested within the first three years and 52 percent are returned to prison (Langan and Levin, 2002). The vast majority of these early failures are due to technical
violations, as only 10-15 percent can be attributed to new offenses (Beck, 2001). Furthermore, Travis (2005) reports that in the last 20 years, while rates of new prison admissions (for all crimes) increased threefold, the rate of returns to prison for technical violations has increased sevenfold.
ARRAY OF NEEDS AND CHALLENGES
When attempting to improve the outcomes of parolees, the challenges are substantial. Problem behaviors, poverty and social service needs are often highly correlated, and this is especially true for criminal justice populations. Recidivism risks for parole populations are multi-dimensional,
1 Technical violations are based on noncompliance with any number of requirements, which vary by state. Most
states require parolees to: make directed and scheduled reports with the parole office, abstain from firearm or other dangerous weapon possession, and remain within the county or jurisdictional boundaries (unless otherwise granted permission), obtain and retain employment, meet financial obligations (i.e. supervision fees, restitution, and child support), support dependants and participate in mandated treatment (Travis, 2005).
Chapter 2. The State of Prisoner Reentry Page 5 including: substance abuse, criminal thinking, mental health, employment, family and medical issues.
Substance Abuse
One result of the increased imprisonment of drug offenders is hundreds of thousands of inmates now leaving correctional facilities and returning to their communities in need of substance abuse treatment. In recent years, the public health perspective has become a more appealing approach for correction officials with regard to interventions for these offenders. The logic being that desistance from substance use will ultimately decrease an offender’s risk of recidivism. Mitchell, Wilson and MacKenzie, (2006) suggest that substance-abusing offenders who are not provided effective treatment are substantially more likely to recidivate and, therefore, any time an individual spends under correctional supervision should be viewed as a time for treatment to occur. It is also commonly known that the need for substance abuse treatment is much greater among criminal justice populations than within the general population (Belenko and Peugh, 2005). Brownsberger, Love, Doherty, and Shaffer (2004) report that treatment need/prevalence is sevenfold greater in correctional populations when compared to general population estimates; furthermore, substantial evidence suggests that drug abuse treatment can effectively reduce the likelihood of relapse and recidivism following incarceration (Friedmann et al., 2004; Gerstein et al.1997; Hubbard et al., 1997; Inciardi et al., 1997; Mackenzie, 2000).
Criminality
Parolees typically have extensive criminal histories. Langan and Levin (2002) report that prior to their most recent incarceration, 93 percent of returning prisoners have been previously arrested, 81 percent had a prior conviction, and 44 percent had a previous incarceration. Criminal thinking patterns such as an enhanced sense of entitlement, justification, and lack of responsibility are thought to contribute to drug use and criminal behavior (National Institute on Drug Abuse, 2000). Criminal attitudes and thinking remain a neglected aspect of offender assessment and treatment (Simourd and Oliver, 2002). Criminal thinking has been described as a “dynamic” cognitive process that can, and must, be altered before offenders can live successfully in the community (Knight et al., 2006).
Mental Health
The presence of mental health issues is also relatively common. Belenko and Peugh (2005) reported that 24 percent of state inmates show evidence of a psychological problem. Rates of co-occurring substance use and psychiatric disorders within criminal justice populations are
significantly higher than in the general population (Teplin, 1994). Peters and Hills (1997)
reported that there are more mentally ill, substance-abusing offenders currently incarcerated than there are free clients receiving services in psychiatric hospitals across the country.
Employment/Education Barriers
Employment is typically a condition of parole, and a lack of employment and education is associated with negative outcomes, such as crime (Butzin, Martin and Inciardi, 2005). However,
Chapter 2. The State of Prisoner Reentry Page 6 gaining employment is often difficult for released offenders. Felony records restrict the types of jobs parolees may obtain. In addition the vast majority of parolees have not completed high school. The Bureau of Justice Statistics reported that only 46 percent of incarcerated individuals have a high school diploma or GED (Beck, 2000). One year after release, as many as 60 percent of former inmates are not employed in the legitimate labor market (Petersilia, 2000).
Furthermore, released offenders typically have had little prior employment, possess few tangible skills, lack education/degree requirements to obtain more profitable employment and rank lower than general population estimates with regard to problem-solving skills (Belenko, 2006, Belenko and Peugh, 1998, Fiorentine, 1998, Seiter, and Kadela, 2003). More recent findings suggest that the policy changes that resulted in increased prison sentences will ultimately impact subsequent employment earnings and opportunities for incarcerated offenders as skills, education and experience requirements were delayed or unachievable during their incarceration (Lindquist, Hardison and Lattimore, 2004).
Family
A substantial proportion of incarcerated offenders have children, many of whom are minors, dependent on their care (Belenko and Peugh, 1998). Upon release, parents must often begin providing child support and paying other debts incurred during their incarceration. If the incarceration forced a release/change in custodial rights, parolees may find their children in foster or group homes (Dodge and Pogrebin, 2001). To regain custodial rights, some offenders may be required to attend parenting programs, participate in supervised visitations and prove stable housing and employment for an extended period following their release (Travis, 2005). All of these additional conditions weigh heavily on a parolee who is attempting to stay compliant and reintegrate with their family and the community.
Medical Issues
Many parolees also require medical services, which is not surprising given the high correlations among crime, poverty and poor health (Anno, 1991; Belenko and Peugh, 2005; Hammett, Harmon, Maruschak, 1999). Parolees have been found to be disproportionately more likely to live as transients and in crowded conditions, be economically disadvantaged, and have a higher prevalence of intravenous drug use, which, in turn, result in a greater likelihood of medical problems when compared to the general population (Petersilia, 2000). Infectious diseases such as hepatitis, tuberculosis, and HIV/AIDS, are in higher prevalence among incarcerated and
community supervised populations, when compared with the general population (Belenko and Peugh, 2005; Fiorentine, 1998; National Institute on Drug Abuse, 2006). Physician visits, referrals, medications and special treatments can be disruptive to the reentry transition.
Neighborhood Concentration
Another component of the reentry problem is the effects that it can have on neighborhoods. The distribution of offenders returning to communities is anything but proportionate, with poor urban neighborhoods often responsible for housing a large portion of returning offenders (Lynch and Sabol, 2001). The Urban Institute’s Returning HomeProject (2001) areas offenders returned to
Chapter 2. The State of Prisoner Reentry Page 7 and found these communities have high amounts of poverty, female-headed households,
unemployment and high school drop outs (Visher, LaVigne and Travis, 2004).
An example of the connection between prisoner reentry and neighborhood disadvantage is observed in East Harlem. Over 2,200 prisoners are released to parole in Upper Manhattan each year, constituting roughly 50 percent of all parolees assigned in Manhattan.2 Within Upper Manhattan, the East Harlem neighborhood is home to a high concentration of persons returning from prison. Infamously dubbed a “corridor for reentry,” within a seven block stretch from 126th
Street to 119th Street, 1 in 20 men have been incarcerated. The vast majority of these residents have served (or are currently serving) time on parole (Justice Mapping Center, 2003).
Data from the New York State Division of Parole indicates that, compared to other parolees in Manhattan, Upper Manhattan parolees are more likely to have a drug and/or alcohol history, to be unemployed, to have a history of felony offending, to have a history of violent offending, and to have a history of parole violations. This area is also noted for high rates of poverty and
unemployment. Once released, the likelihood of successful reintegration is low2. A recent evaluation of Manhattan parolee outcomes was conducted by the Center for Court Innovation. Among those persons released between 2001 and 2008, it was found that, within three years following release from prison, 62 percent had been rearrested, 52 percent had been reconvicted and 32 percent had their parole revoked.
Contextual, or neighborhood problems, can exacerbate parolee problems. For example, drug offenders and/or those with substance abuse issues often return to neighborhoods with active drug markets. The availability of a nearby drug market provides an easy opportunity for former dealers to return to illegal employment and former addicts to relapse (Travis and Petersilia, 2001).
REENTRY PROBLEM SOLVING
Beginning in the late 1990’s, in response to the overwhelming problems facing persons returning from prison, practitioners began to offer up new ideas. In 1999, the U.S. Department of Justice, Office of Justice Programs (OJP) began several reentry initiatives. Under OJP’s auspices, the national Reentry Court Initiative was created to pilot projects aimed at providing supervision, social services, and case management to offenders reentering from incarceration. Based on the drug court model, the Reentry Court Initiative sought to provide graduated sanctions in
combination with needed social services that are likely to produce lasting change (Travis, Solomon and Waul, 2001). The initiative established nine pilot programs, of which the Harlem Reentry Court is one, to examine the effectiveness of a specialized court designed to address issues of reentry with a community-oriented approach.3 The following chapter will outline the reentry court model and provide details as to its use in Harlem.
2 Data cited was produced for the Harlem Community Justice Center by special request from the New York Division
of Parole in 2006.
3 It should be noted that OJP provided technical assistance to each of the nine sites and state funding was obtained
Chapter 3. The Reentry Court Model Page 8
CHAPTER 3
THE REENTRY COURT MODEL
One major reentry problem is the inefficient transition from prison to parole supervision. The period immediately following release represents an initial opportunity to build a support system and thereby reduce the likelihood of recidivism (Travis, 2005). The Reentry Court model was created to address this need (Maruna and LeBel, 2003; Travis, 2005). Adapting successful components of the drug court model, the reentry court uses judicial oversight and a collaborative case management process, with parole officers taking on a larger role finding new and additional resources for their parolees and assisting in the design of the reentry plan with a judge and other court partners. In addition to providing an extra layer of oversight, the judge administers
incentives and sanctions to promote compliance.
In 2001, the Harlem Parole Reentry Court was chosen as one of nine different reentry court programs initiated across the nation (Petersilia, 2000). Although sites were encouraged to tailor their model to match the needs of their target population and community, a process evaluation revealed six core elements common among the pilot programs (Lindquist, Hardison and Lattimore, 2004).
1. Assessment and Planning: Eligibility criteria and psycho-social assessment and service need identification, and multiple reentry planning partners (e.g. judge, parole officers, case managers, correctional administrators).
2. Active Oversight: Formal court appearances and judicial involvement 3. Management of Support Services: Court monitored social services
4. Accountability to Community: Feedback and input provided by an advisory board, efforts made to pay fees and restitution and involvement of victims’ organizations
5. Graduated and Parsimonious Sanctions: The use of predetermined sanctions for violations in lieu of revocations and sanctions administered universally.
6. Incentives for Success: Rewarding completion of program milestones (e.g. early release, graduation ceremonies to recognize milestones
More recently, a study identified 24 reentry courts operating nationwide (Huddleston, Marlowe and Casebolt, 2008), although it is unclear whether all of these programs have adopted the complete set of model elements that are described to this chapter.
ACTIVE INGREDIENTS OF THE REENTRY COURT MODEL
This section examines the “active ingredients” of the reentry court model, or those elements thought to produce a greater impact than traditional parole.
Chapter 3. The Reentry Court Model Page 9
Procedural Justice
The reentry court model is committed to the use of the public forum rather than the standard, closed-door process typically utilized by parole. This allows the parolee to have a potentially greater perception of fairness, which, in turn, is theorized to help parolees internalize the
requirements of parole and increase the likelihood of compliance (Tyler, 1988). As witnessed in drug courts, the concept of procedural justice posits that if offenders know the reasoning behind the court’s decision, they gain a greater respect for the law and are more likely to obey it in the future. In the reentry court model the judge is responsible for openly and publicly discussing program requirements, sanctions and their purposes (Travis, 2005).
Ceremonies
Another key element is the recognition of accomplishment. Borrowed from the drug court model, reentry courts use praise and incentives to mark interim compliance, culminating in public graduation ceremonies to recognize completion. At graduation ceremonies, the judge distributes certificates and participants deliver speeches of redemption (Travis, 2005). What is normally a handshake and a few kind words provided in the office of a parole officer at the completion of a traditional parole term becomes a potentially memorable public moment of demarcation. Often family members and significant others attend these ceremonies to support parolees’ reintegration.
Judicial Authority
In contrast to traditional parole, the reentry court leverages judicial authority through the through formal court proceedings (Travis, 2005). However the role of the judge is altered from those of typical criminal court proceedings to involve greater involvement in case management, planning and continued supervision. In reentry courts, the parole officer and judge work collaboratively to assess reentry planning, graduated sanctions and incentives.
HARLEM PAROLE REENTRY COURT MODEL
The Harlem Parole Reentry Court is based at the Harlem Community Justice Center, a multi-jurisdictional community court located on 121st street in the heart of East Harlem. The Court offers pre-discharge planning as offenders move from correctional facility to community supervision; provides intensive services and oversight in the period immediately following release; and forms effective partnerships at the local level to overcome barriers that restrict access to critical services, including treatment, housing and employment services.Ultimately, the goal of the court is to enhance public safety and reduce recidivism among parolees returning to East and Central Harlem. Through the development of a continuum of locally provided services tailored to the individual needs of each parolee and regular judicial monitoring during the first six months of parole, the Reentry Court seeks to reduce further criminal involvement, parole violations and returns to prison, while facilitating the re-integration of parolees into their families and communities.
Chapter 3. The Reentry Court Model Page 10
Eligibility and Admission
Through the partnership with the New York State Division of Parole, eligible participants are identified at either the Queensboro Correctional Facility for male participants or Bayview Correctional Facility for women. These are pre-release facilities where offenders returning from prison to New York City are transferred. Here they receive screening and assessments prior to community release. The Senior Parole Officer for the Harlem Parole Reentry Court identifies potential participants based on their expected return addresses in the neighborhoods of East and Central Harlem. Parolees with serious Axis I mental health diagnoses, sex offenders and persons with a history of arson are excluded from the program. Eligible participants are gauged for motivation and acceptance of the Reentry Court program.4 The final selection of participants is determined by a Senior Parole Officer in collaboration with the two Reentry Court program parole officers. The program is not voluntary. Once selected, participation is mandated much like traditional parole.
Programming, Duration and Phases
The Reentry Court is designed to comprise the first six months of the parolee’s term. Extensions beyond six months are not uncommon if the individual is progressing and the Division of Parole agrees. After program completion, parolees are transferred to a traditional parole caseload for the remainder of their supervision term.
The Harlem program is divided into two phases. In Phase One, parolees report to their parole officer every week and attend hearings before the Administrative Law Judge (ALJ) every two weeks. The purpose of the court appearances is to provide judicial oversight in the reentry progress, to engage the parolee, and review compliance with the rules of parole and case management plans. Where needs are identified, parolees are mandated to attend social service programs, including: drug treatment, mental health treatment, vocational and/or educational training. Successful completion of Phase One can lead to relaxation of reporting requirements, curfews, travel restrictions or other rules at the discretion of the ALJ and Parole Officer. Phase One lasts approximately two months.
In Phase Two the parolee reports to their parole officer every other week and appears before the ALJ once per month. In addition, the parolee is expected to progress from transitional
employment to permanent, full-time employment, to assume other responsibilities such as payment of child support (if required), and to comply with social service programming. Phase Two is designed to last four months. A graduation ceremony is held for parolees who
successfully complete Phase Two. The parolees are encouraged to bring their family members/significant others to recognize their achievements. Certificates of completion are awarded to graduates, many of whom speak publicly of their struggles and accomplishments. Following successful completion, the parolee is transferred to a traditional parole bureau. Additional aftercare services are available as needed at the Harlem Community Justice Center.
4 As the list of eligible participants outnumbers potential participant openings, offenders who are steadfast against
Chapter 3. The Reentry Court Model Page 11
Resources Sanctions and Incentives
The Senior Parole Officer identifies eligible participants during transitional incarceration and provides oversight and guidance to the two Reentry Court Parole Officers, who provide day-to-day supervision and case management. The Administrative Law Judge oversees the continued progress of the participants and administers incentives and sanctions to encourage compliance. Finally, the Resource Coordinator assists in linking parolees to social services that have either been voluntarily requested or mandated by the court.
To provide a more intensive focus, the Parole Officers generally have a caseload of 40 parolees versus the 65 to 70 parolee caseload that is typical of traditional parole. The smaller case load is designed to facilitate connections to treatment and employment services as well as enable more home, employment, treatment and office visits. Linking parolees to needed services is one of the Reentry Court’s highest priorities. A large portion of the participants have substance abuse and/or employment difficulties and are linked to local treatment and employment services. In-house services are also available at the Harlem Community Justice Center, including mediation, family group counseling, and housing assistance.
When parolees are noncompliant with mandated services and other parole conditions, the Judge, in consultation with the Reentry Court team, applies graduated sanctions. Sanctions begin with increased court appearances but may also include: the delay of phase progression, increased frequency of drug testing, stricter curfews and electronic monitoring. These sanctions are used in an effort to quickly return the participant to compliant behavior and to avoid the use of
revocations. Conversely, the Judge administers positive incentives in response to participant success. Possible incentives include: judicial recognition, certificates of accomplishment, relaxation of travel restrictions, small tokens such as pens and writing journals, and of course, public ceremonies to mark key program milestones.
REENTRY EVALUATIONS
Many attempts have been made to provide programming for parolees returning from prison. Evaluations have demonstrated varying degrees of success; a mix of positive and negative findings is the norm for reentry programs. Given the cluster of issues that can accompany the typical person attempting reentry, program administrators and evaluators anticipate a high rate of failure. Most programs hope to improve recidivism outcomes by 5 to 10 percent. Even if this rate of success is achieved, it is not uncommon for more that 50 percent of program participants to recidivate with in three years of release (Langan and Levin, 2002).
Evaluations of less than successful programs typically cite implementation issues and other program elements as a source of negative findings. Some evaluations have found that program models that focus too heavily on supervision are ineffective (McKenzie, 2000). Others cite a mixture of program conception and implementation problems as barriers to achieving positive effects. One well known example of a reentry program that produced unintended negative effects was Project Greenlight (Wilson and Davis, 2006). Greenlight was designed to provide pre-release Cognitive Behavioral Therapy (CBT) to offenders transitioning from incarceration to the community. Although designed to offer an evidence-based practice, the implementation was less
Chapter 3. The Reentry Court Model Page 12 than optimal. Wilson and Davis cited several implementations issues that affected treatment delivery, including inappropriately high class sizes, less than optimal facilitator training, ill-conceived matching of participant risk levels and additional mandated programming that was later deemed unnecessary. These issues ultimately contributed to the negative program findings, as survival analyses indicated that Greenlight participants performed significantly worse than comparison group offenders on several recidivism measures at one-year following release. The authors’ final caution for reentry program providers is to ensure fidelity to the program model, as ineffective programs may not be simply innocuous but actually increase the chances of
recidivism and revocation.
Program evaluations citing positive effects, or decreases in recidivism, underline the importance of meeting offenders’ multiple service needs (Setier and Kadela, 2003). Inciardi and colleagues (1997) reveal positive recidivism findings in the evaluation of the Key-Crest program, which tailored the intensity of substance abuse and vocational training from prison, to work release, and finally to parole. Furthermore, vocational training programs, cognitive behavioral therapies and drug treatment have generally demonstrated reductions in recidivism post release/program completion (Andrews and Bonta, 1998; Pearson and Lipton, 1999; Setier and Kadela, 2003; Wexler, Falkin, and Lipton, 1990)
Reentry Court Evaluations
On paper, reentry courts seem like an intriguing innovation that should produce similarly
successful outcomes that are witnessed in evaluations of adult drug courts (Mitchell, Wilson, and MacKenzie, 2006; Rempel et al., 2003). The reentry court model provides many of the services cited as successful interventions with returning prisoner populations (i.e. transitional planning, drug treatment and vocational training). Maruna and LeBel (2003) go as far as to suggest that the federal Reentry Court Initiative has to positively modify parole and community supervision if instituted on a broad scale. However, despite the initiation of several reentry courts in 2001, to date there has been little research examining their impact.
A particularly significant but still forthcoming study evaluates the Serious and Violent Offender Reentry Initiative (SVORI). This initiative is a federal effort to examine and improve outcomes for offenders reentering communities from correctional facilities. SVORI programs include a common set of elements, such as: transition planning and other pre-release programs, drug treatment, job training, educational programs, work release and vocational programs (Bushway and Reuter, 2001; Gaes et al., 1999; Lattimore, et al., 2009; Seiter and Kadela, 2003). In an upcoming multi-site impact evaluation of SVORI’s 16 programs, it was found that adult program participants showed slightly lower rates of rearrest among all participants, similar rates of
reincarceration among men, and higher rates of reincarceration among women (Lattimore, 2009).5 Although the SVORI programs all have some elements in common, only one of the 16 evaluation sites (the Allen County Reentry Court) follows the reentry court model. At the time of this evaluation, no results have been produced measuring the specific impact of the Allen County Reentry Court program.
5 Though it is not part of the 16 sites participating in the evaluation, The Harlem Parole Reentry Court is a SVORI
Chapter 3. The Reentry Court Model Page 13 A preliminary evaluation of the Harlem Parole Reentry Court was completed in 2003. This evaluation included a comprehensive process study, documenting challenges and achievements in the program’s early implementation. Additionally, the study included a preliminary impact evaluation of 45 individuals who had participated in the program from June 2001 through June 2002. A comparison group was selected from traditional parolees who were served in local area parole offices and matched on key pre-release measures. Although several measures of
recidivism were evaluated for all study participants at one year post-admission, no significant impacts were identified (Farole, 2003). The report identified two key factors that may have contributed to the lack of findings in the initial pilot phase of the program: barriers to implement the program design in the initial years and low statistical power for the evaluation, due to a small sample size (45 participants and 90 comparison group subjects). Although the findings were not significant, the results nonetheless suggested that the program might have modest effects in reducing reconvictions but a negative impact with regard to increasing returns to prison, where most participants were returned for technical violations of parole conditions.
In summation, little is known about the effectiveness of reentry courts, despite substantial interest in the model among federal, state and local decision makers. To help fill this gap in the literature, the current analysis examines the impact of the Harlem Parole Reentry Court using a relatively large sample and comparison group and evaluates recidivism outcomes up to three years post-release.
Chapter 4. Study Design and Analysis Plan Page 14
CHAPTER 4
STUDY DESIGN AND ANALYSIS PLAN
A 2003 study provided a detailed process evaluation of the Harlem Reentry Parole Court, including planning and preliminary implementation (Farole, 2003). This preliminary analysis of the Court utilized a quasi-experimental design comparing one-year rates of reconviction and reincarceration between program participants and a matched sample of traditionally supervised parolees in Northern Manhattan during the same time period. Although the study methodology for the impact analysis was relatively strong, there were several limitations that made it difficult to find any measurable effect of the court, namely small sample size and follow-up time period. Only 45 Reentry Court participants could be used in the analysis and subjects could only be tracked of one year following release.
The current analysis avoids some of the previous study’s limitations. Specifically, many more parolees have now participated in the program, increasing the total number of subjects and, in turn, the statistical power. Second, the period for measuring follow-up recidivism measures was extended to include one-, two-, and three-year post-prison discharge, thus increasing the
understanding of the impact of the Reentry Court.
Following the completion of the 2003 evaluation, the Harlem Reentry Court made several modifications in an attempt to improve the program’s functioning. Two new parole officers were assigned to the Reentry Court and tasked with implementing a more concise version of the program design than was utilized in the initial years. Less emphasis was given to revocations and more to the provision of treatment services and graduated sanctions. Where originally only non-violent drug offenders were allowed to participate; eligibility criteria expanded to include a wide array of prior charges (including parolees with violent offenses). Furthermore, instead of keeping parolees for their entire term, the program reduced its duration to six months to extend the reach of the program to a greater number of individuals and of service delivery during the riskiest period of reentry.6 The current analysis selected only those subjects who participated after these adjustments occurred (in Year Two of operations). Hence, the study sample includes those offenders who were admitted to the program in November of 2002 until February of 2008. REENTRY COURT PROFILE
At the time of sample construction, 317 Reentry Court participants were study eligible. Upon admission to the program, an interview is conducted to gather demographic, criminal and additional participant descriptive measures. Additional criminal history measures were obtained through the New York State Division of Criminal Justice Services (DCJS). The profile of
Reentry Court offenders is provided in Table 4.1. Generally, the volume of the Reentry Court has stayed relatively constant each year with a slight peak in 2006, and the exception of 2007 when the program was forced to take a short hiatus due to funding cuts.7 The mean age of participants
6 Individuals may stay in the program beyond six months if they apply and are granted early release. However, these
cases represent the exception rather than the rule.
Chapter 4. Study Design and Analysis Plan Page 15 is 31 and 99 percent are male.8 Nearly all offenders are black (68%) or Hispanic (30%). Only 10 percent of participants reported being married at the time of intake. The vast majority of
participants (90%) do not possess a diploma or GED and 11 percent reported being foreign born. Nearly 70 percent reported prior participation in drug treatment and 16 percent reported previous completion of a detoxification program.
Reentry Court participants typically have been in and out of the criminal justice system multiple times, as the mean number of prior arrests and convictions exceeds double digits (15 and 11, respectively). The arrests and convictions tend to be of a serious nature, as nearly half are for felony and/or drug related crimes. As expected, most participants were serving terms for drug crimes (68%), and one-third have had a previous term on parole. The mean time served in prison is nearly three years.
COMPARISON SAMPLE CONSTRUCTION
The current impact analysis makes use of a quasi-experimental design comparing Harlem Parole Reentry Court participants with a sample of parolees released onto traditional parole supervision during the same time period (November, 2002 – February, 2008). All comparison subjects selected met eligibility criteria that reflected a similar release process to Reentry Court participants, including: an exclusion of sex or arson offenders, having received parole supervision in New York City, and the arrest that resulted in their incarceration must have occurred in Manhattan.9 The total population of potential comparison parolees meeting these initial eligibility requirements was 20,750.
To further reduce selection bias in the comparison group, propensity score matching was implemented. The propensity score matching approach is considered a strong methodological alternative to random assignment (Cochran and Rubin, 1973; Rosenbaum and Rubin, 1983).This procedure allows for the reduction of differences between the participant and comparison groups on demographic, criminal history and other theoretically relevant measures. The result is to create a comparison sample that is statistically identical to the Reentry Court participant group on all key pre-release characteristics.
The propensity score matching procedure takes specified pre-release characteristics and creates a single summary measure (e.g. the propensity score). This summary measure represents the predicted probability of being a Reentry Court participant. In this study, a two-to-one matching strategy was employed. Each participant’s score was compared to the pool of potential
comparison subjects, and the two comparison subjects with the closest score (of those not already selected) were selected for the final sample. The two-to-one ratio was used to increase the power of the final analysis.
8 It should be noted that four female parolees participated in the program prior to November 2002 and several more
have been admitted since February 2008.
9 Prior findings suggest that offenders often commit crime in areas in which they reside (Hipp and Yates, 2009;
Rengert, Piquero and Jones, 1999). This eligibility criterion was utilized to create a closer comparison with Reentry Court participants; parolees that commit their crime in Manhattan are likely to serve their parole term in Manhattan and thus be similar to those participating in the Reentry Court.
Chapter 4. Study Design and Analysis Plan Page 16
Table 4.1 Reentry Court Participant Profile (N=317)
Year of Parole Admission
2002 (Nov. - Dec.) 2%
2003 21%
2004 21%
2005 21%
2006 27%
2007 5%
2008 (Jan. - Feb.) 4%
Demographics
Mean Age 31
Male 99% Race/Ethnicity
Black 68%
Hispanic 30%
White 2%
Other <1%
Married 10% Highest Education Completed
8th grade 16%
Some High School 74%
High School / GED 8%
Associates Degree or Higher 2%
Immigrant to U.S. 11%
Ever in Treatment 69%
Completed Prior Detox 16%
Criminal History Mean
Total Prior Arrests 15
Misdemeanor Arrests 7
Felony Arrests 8
Drug Arrests 7
Violent Felony Arrests 2
Total Prior Convictions 11
Misdemeanor Convictions 5
Felony Convictions 4
Drug Convictions 5
Violent Felony Convictions 1
Prior Parole Term 33%
Current Offense Category
Drug 68%
Theft 18%
Violent 15%
Weapons 5%
Mean Months in Custody 35
Mean Months Prison Minimum 35
Mean Months Prison Maximum 85
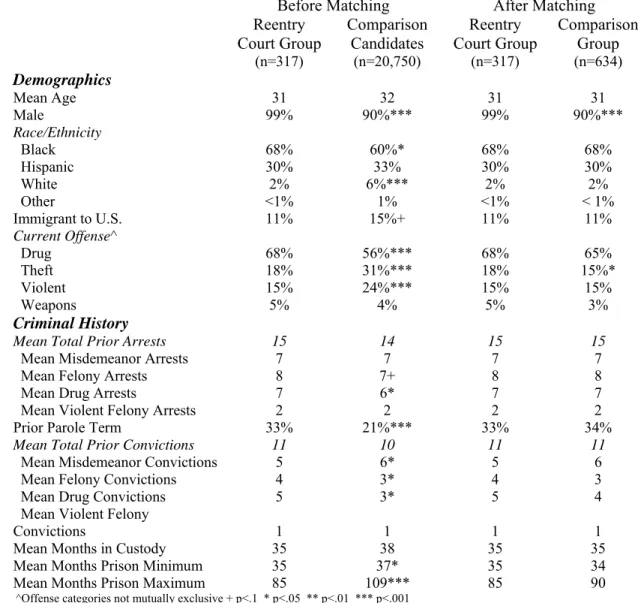
Following the completion of the matching process, diagnostics were performed, comparing the created comparison sample to the Reentry Court group, to validate the success of the matching process. Comparing the two groups across all identified pre-intervention measures resulted in two significant differences - Male and Current Theft Offense (p< .001 and .05, respectively), indicating that the matching process was adequate. Table 4.2 compares the constructed
comparison group with the Reentry Court group on all pre-release characteristics both before and after the propensity score matching process. What should be taken away from this table is how
Chapter 4. Study Design and Analysis Plan Page 17 selection bias is reduced by the propensity matching process. The final participant and
comparison groups are highly comparable.
Table 4.2 Baseline Characteristics of Reentry Court and Comparison Group Sample Before and After Propensity Score Matching (N=21,115)
Before Matching After Matching Reentry
Court Group
Comparison Candidates
Reentry Court Group
Comparison Group
(n=317) (n=20,750) (n=317) (n=634)
Demographics
Mean Age 31 32 31 31
Male 99% 90%*** 99% 90%***
Race/Ethnicity
Black 68% 60%* 68% 68%
Hispanic 30% 33% 30% 30%
White 2% 6%*** 2% 2%
Other <1% 1% <1% < 1%
Immigrant to U.S. 11% 15%+ 11% 11%
Current Offense^
Drug 68% 56%*** 68% 65%
Theft 18% 31%*** 18% 15%*
Violent 15% 24%*** 15% 15%
Weapons 5% 4% 5% 3%
Criminal History
Mean Total Prior Arrests 15 14 15 15
Mean Misdemeanor Arrests 7 7 7 7
Mean Felony Arrests 8 7+ 8 8
Mean Drug Arrests 7 6* 7 7
Mean Violent Felony Arrests 2 2 2 2
Prior Parole Term 33% 21%*** 33% 34%
Mean Total Prior Convictions 11 10 11 11
Mean Misdemeanor Convictions 5 6* 5 6
Mean Felony Convictions 4 3* 4 3
Mean Drug Convictions 5 3* 5 4
Mean Violent Felony
Convictions 1 1 1 1
Mean Months in Custody 35 38 35 35
Mean Months Prison Minimum 35 37* 35 34
Mean Months Prison Maximum 85 109*** 85 90
^Offense categories not mutually exclusive + p<.1 * p<.05 ** p<.01 *** p<.001
One of the advantages of the propensity score matching process is that it simplifies the analysis when testing for program impact. That is, without the use of propensity score matching, one would need to control for pre-release characteristics, possibly through the use of numerous covariates in a multiple regression analysis. Propensity score matching eliminates the need to control for additional measures, as the process creates a (near) equal distribution of the variations among both program and comparison group participants.
Chapter 4. Study Design and Analysis Plan Page 18 OUTCOME MEASURES
For the current analysis, programimpact is defined as a lower rate of recidivism among Reentry Court participants than the comparison group. Three measures of recidivism are used – rearrests, reconvictions and parole revocations. Rearrests and reconvictions are further broken down by seriousness of the event (misdemeanor or felony). Revocations are also broken down by subtypes – new convictions and technical violations. Technical violations are returns to prison based on violations of parole conditions, in other words, returns that are not the result of a new conviction. The use of multiple measures of recidivism is necessary to detail parolees’ problem behaviors following release. Arrests do not necessarily result in convictions (i.e. when charges are dismissed) and convictions do not necessarily result in a return to prison (i.e. when offenses committed do not merit a prison sentence). Furthermore, it is of critical importance to provide rates of returns to prison for technical violations versus those for new crimes, as returns for violations may be the result of supervision effects described earlier.
Finally, all three measures of recidivism will be examined across three time periods - one-, two- and three-years following release. The use of multiple years of follow-up is a key advantage of this study, as it allows for examination of the duration of program impact, both during and after participation in the Reentry Court. In addition, days-to-rearrest and reconviction will be
compared (i.e. days from incarceration release date to the recidivism event in question). Table 4.3 describes the outcomes to be used as part of the program impact analyses, which includes the eligible Reentry Court participants (n=317) and the matched control group subjects (n=634). Within one year of release 42 percent of study subjects were rearrested, and by years two and three over 60 percent of the sample population were rearrested (61% and 69%, respectively).In all three follow-up periods the majority of rearrests are for misdemeanors. A nearly equal percentage of parolees were rearrested for drug (versus non-drug) offenses. Nearly one-third of subjects were reconvicted within the first year, nearly half were reconvicted by year two and slightly more than 60 percent were reconvicted by year three. Again, the majority of reconvictions were for misdemeanor offenses; the rate of misdemeanors is nearly twice that of felony reconvictions in all three years after release. Over 20 percent of the sample was revoked within one year following release. By three years the frequency of revocations had more than doubled (44%). Revocations for new convictions occurred at a nearly equal rate as those for technical violations within the first year (12% and 10%, respectively); however, the difference has more than doubled by year two (25% and 10%, respectively) and tripled by year three (34% and 10% respectively). Finally, when parolees were rearrested, the average time to rearrest was 322 days or slightly more than ten months. Furthermore, the average time to revocation was 346 days or slightly more than eleven months.
Chapter 4. Study Design and Analysis Plan Page 19
Table 4.3 Impact Outcome Descriptives (N=951)
Outcome
One-Year Outcomes (n=899)
Rearrested 42%
Misdemeanor 28%
Felony 21%
Drug 24%
Non-Drug 25%
Reconvicted 32%
Misdemeanor 26%
Felony 9%
Total Revoked 23%
Technical Violations 10%
New Convictions 12%
Two-Year Outcomes (n=767)
Rearrested 61%
Misdemeanor 45%
Felony 36%
Drug 38%
Non-Drug 39%
Reconvicted 49%
Misdemeanor 40%
Felony 15%
Total Revoked 36%
Technical Violations 10%
New Convictions 25%
Three-Year Outcomes (n=526)
Rearrested 69%
Misdemeanor 53%
Felony 46%
Drug 49%
Non-Drug 48%
Reconvicted 59%
Misdemeanor 22%
Felony 11%
Total Revoked 44%
Technical Violations 10%
New Convictions 34%
Days from Release to Recidivism
Mean Days to Rearrest (n=621) 322 Mean Days to Revocation (n=365) 346
ANALYTIC PLAN
The coming sections will investigate program impact. Analysis of the one-, two- and three-year recidivism outcomes were performed using bivariate cross-tabulation procedures, utilizing chi-square significance testing. Cox regression survival analysis will be used to examine group differences on days to rearrest and reconviction, utilizing a Wilcoxon statistic to assess
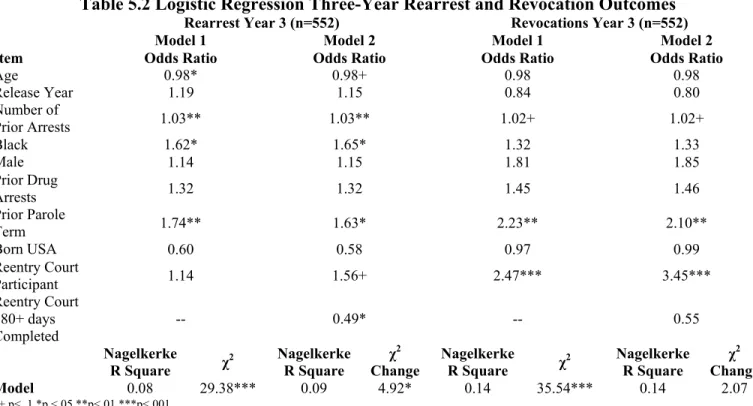
significant differences. Logistic regression analysis was utilized to identify characteristics that predict two- and three-year rearrest and revocation outcomes. An additional regression analysis was performed, examining the predictors of Reentry Court program graduation.
Chapter 5. Results Page 20
CHAPTER 5 RESULTS
RECIDIVISM AND REINCARCERATION RATES
Table 5.1 displays the results covering the impact of the Reentry Court on rearrests,
reconvictions and parole revocations. Reentry Court participants were rearrested at lower rates than comparison group parolees but the difference was not significant at one, two or three years. Rearrests for misdemeanors did approach significance at one year (p<.1), and rearrests on drug charges approached significance at two years. Overall, two-thirds of both samples were
rearrested as of three years post-release (67% versus 69%, respectively).
Regarding reconvictions, the Reentry Court produced significantly lower reconviction rates across all three years (p<.05). By three years post-release, the difference between groups was almost ten percent (43% versus 52%, respectively).
The Reentry Court produced a higher rate of reincarceration on parole violations than the comparison group. At one year, differences between overall revocation rates approached
significance (p<.1); however, Reentry Court offenders had nearly twice as many revocations for technical violations (15% versus 8%) and this difference was statistically significant (p<.01). By two years the overall revocation rates were significantly different and this effect is almost entirely due to the higher rates of technical violations for Reentry Court participants (p<.001). Finally at three years, differences in overall revocation rates (56% versus 38%, respectively) and technical violation revocation rates (15% versus 7%, respectively) remained significantly higher for Reentry Court participants. Additionally, unlike the one- and two-year comparisons,
revocations for new convictions were also found to be significantly higher for Reentry Court parolees (p<.05) at Year 3 when compared to traditional parolees.
Interestingly, Reentry Court participants were revoked more frequently for misdemeanors. That is, it is assumed that there is a partially dependent association between reconvictions and revocations. At three years, felony reconvictions are equal among the two groups; however, despite Reentry Court participants’ lower rate of reconvictions for misdemeanors at year three, the rate of revocations for new convictions is significantly higher (41% vs. 30%, respectively). This indicates partial support for a supervision effect, where Reentry Court participants seem to be revoked more often for misdemeanor reconvictions than comparison group parolees; however, this effect is not identified until year three, when participants have been out of the program for over a year.
Of those rearrested and revoked, group differences on mean days to rearrest and revocation were compared using independent sample t-tests. For both groups and both measures, the mean time to the recidivism event is under one year. For days till rearrest, Reentry Court participants were out longer before being rearrested and this difference approached significance (p<.1). With regard to days to revocation, the reverse is found; comparison group subjects were out longer before being revoked, but the difference did not approach significant levels.
Chapter 5. Results Page 21
Table 5.1 Recidivism Outcomes by Group (N=899)
Outcome Reentry Court Group Comparison Group
One-Year Outcomes (n=899)
Rearrested 40% 44%
Misdemeanor 25% 30%+
Felony 21% 21%
Drug 22% 25%
Non-Drug 24% 25%
Reconvicted 28% 34%*
Misdemeanor 23% 28%+
Felony 6% 10%+
Total Revoked 27% 21%+
Technical Violations 15% 8%**
New Convictions 11% 13%
Two-Year Outcomes (n=767)
Rearrested 58% 62%
Misdemeanor 42% 46%
Felony 36% 36%
Drug 34% 40%+
Non-Drug 38% 40%
Reconvicted 44% 51%*
Misdemeanor 35% 42%*
Felony 16% 15%
Total Revoked 45% 31%***
Technical Violations 17% 8%***
New Convictions 28% 24%
Three-Year Outcomes (n=526)
Rearrested 67% 69%
Misdemeanor 51% 55%
Felony 43% 47%
Drug 44% 51%
Non-Drug 47% 49%
Reconvicted 43% 52%*
Misdemeanor 42% 50%
Felony 21% 21%
Total Revoked 56% 38%***
Technical Violations 15% 7%**
New Convictions 41% 30%*
Days from Release to Recidivism
Mean Days to Rearrest (n=621) 348 309+ Mean Days to Revocation (n=365) 335 354
+ p< .1 *p <.05 **p<.01 ***p<.001
COX REGRESSION ANALYSES
Cox regression analyses were conducted on the time-to-rearrest and revocation for the entire sample. Figure 5.1 presents the months-to-rearrest for Reentry Court participants and comparison group subjects, displaying the monthly cumulative percentage of rearrested parolees following release from incarceration. Similar to the results shown in Table 6.1, comparison subjects show a higher rate of rearrests, but the differences were not significant. Group differences increased between months 14 through 21, but drew close to even by the end of year three.
Chapter 5. Results Page 22 Figure 5.2 presents the months-to-revocation for Reentry Court participants and comparisons group subjects, displaying the monthly cumulative percentage revoked parolees following release from incarceration. A separation occurs between the groups beginning at month five, and monthly significant differences occur there after10. The trend of higher cumulative revocation rates among those in the Reentry Court increases steadily throughout the three year tracking period; however, beginning at 24 months, the difference between the two groups stays relatively stable, hovering around 15 to 20 percent. The Wilcoxon statistic is significant (p<.001)
indicating that not only are Reentry Court participants more likely to be revoked but they revoke significantly sooner than comparison group subjects following release from incarceration.
Chapter 5. Results Page 23 ROLE OF DURATION
After an examination of the revocation hazard curve it appears as though the study groups’ recidivism rates diverge significantly at, or around, the six-month mark, which may coincide with program completion/graduation.Prior research would indicate that completion of a program or, at least receiving a substantial dosage, will predict better results at follow-up (National
Institute on Drug Abuse, 2000; Pearson et al., 2009).Unfortunately, Reentry Court program completion and an adequate minimum intervention dose sometimes coincide but, at other times, represent completely separate events for participants. More specifically, participants can
complete program requirements, graduate and be transferred to regular parole all at the scheduled 6-month mark. However, a small portion of offenders graduate and continue on in the program until successful termination of parole.11 Others might go through the graduation ceremony
slightly prior to their pre-specified six-month date (eventually staying in the program to complete their remaining time). Still others may be transferred to regular parole prior to completing 6 months if they move out of the parole office area.
11 As described earlier, this can happen if a transfer to traditional parole is delayed or if the participant applies and is