225
EQUITY IN THE USE OF PHYSICIAN VISITS IN OECD COUNTRIES:
HAS EQUAL TREATMENT FOR EQUAL NEED BEEN ACHIEVED?
byEddy van Doorslaer*, Xander Koolman* and Frank Puffer**
Abstract
This paper uses methods proposed by Wagstaff and Van Doorslaer (2000) to generate new international comparative evidence for 1996 on the degree of horizontal equity achieved in health care utilisation in 14 OECD countries. The index of horizontal inequity used measures deviations in the degree to which the use of doctor visits is distributed according to need. The data for the 12 European Union member states are taken from the third wave of the European Community Household Panel, the data for Canada are from the second wave National Population Health Survey and the US data stem from the first wave of the Medical Expenditure Panel Survey. We find that in all countries physician visits tend to be significantly more concentrated among the worse-off. After standardising for need differences across the income distribution, significant horizontal inequity in total physician visits emerges in only 4 of the countries studied: Portugal, the United States, Austria and Greece. However, disaggregating by general practitioner and specialist visits reveals that this is the net effect from quite diverging patterns in the type of doctor consulted by income level: in all countries (except Luxembourg) the rich see a medical specialist more often than expected on the basis of need, while the use of GP visits is fairly closely related to need and in several countries even distributed somewhat pro-poor. The degree and distribution of private health insurance coverage and regional disparities seem to have the expected effect on inequity but in most countries their contribution is rather small. Only in the United States, the effect of private insurance cover is quite large. The results suggest that even in countries which have long achieved fairly universal and comprehensive degrees of health insurance coverage, some differential patterns of doctor utilization remain: higher income individuals are more likely to receive specialist services whereas lower income individuals are more inclined to use general practitioner care. To the extent that these differential use patterns result in differences of quality of treatment, persons in equal need cannot be said to receive equal treatment at all income levels.
Introduction
Most OECD Member states have long achieved close to universal coverage of their population for a fairly comprehensive package of health services. There are exceptions, but in most of these countries, * Department of Health Policy and Management, Erasmus University, 3000 DR Rotterdam, The Netherlands.
Corresponding author: Eddy van Doorslaer Tel. +31 10 4088555. E-mail: vandoorslaer@bmg.eur.nl. This paper derives from the project “Economic determinants of the distribution of health and health care in Europe” (known as the ECuity II Project), which is funded in part by the European Community’s Biomed II programme (contract BMH4-CT98-3352). We are grateful to the EC for financial support and to Stéphane Jacobzone, Peter C. Smith and discussants and participants at the OECD Health Conference “Measuring up”, Ottawa, 5-7 Nov, for helpful comments on an earlier version.
226
access to good quality physician services is ensured at relatively low and sometimes at zero financial cost, even for low-income groups. This is mainly the result of a variety of public insurance arrangements aimed at ensuring equitable access. Equity in access is also regarded as a key element of health system performance by the OECD (Hurst and Jee-Hughes, 2001). The question that arises is to what extent OECD countries have achieved the goal of equal access or utilisation for equal need, irrespective of other characteristics like income, place of residence, ethnicity, etc. ? As in our previous cross-country comparative work (Van Doorslaer et al., 1992, 1993 and 2000) we will focus here on the principle of horizontal equity – i.e.that those in equal need ought to be treated equally – and test for the extent of any systematic deviations from this principle by income level. Van Doorslaer et al. (2000) concluded that both in the United States and in several European countries some systematic deviation of the horizontal equity principle could be detected, i.e.that persons in equal need be treated equally, irrespective of their income. In particular, we found that often the rich tend to be more intensive users of medical specialist services than one would expect on the basis of differences in need for care.
This earlier work was based on secondary analysis of existing national health interview surveys or general purpose surveys (like the General Household Survey for the UK) and – despite great efforts at maximizing data comparability – it was still hampered by cross-country comparability problems of self-reported utilisation and health data. Since 1994, the European Statistical Office (Eurostat) has started the European Community Household Panel which collects longitudinal data on the socio-economic characteristics, self-reported health status and annual health care utilisation of representative samples of the populations of all EU member states. For the first time, very comparable survey data have become available which enable the cross-European comparison of levels and patterns of health care utilisation. Here we use the 1996 data wave which provides comparable data for 12 EU member countries.1 In North-America, the 1996 US National Medical Expenditure Panel and the Canadian 1996 National Population Health Survey collect utilisation data which are very comparable to the European data. This paper provides the first comparative analysis of the use of physician services in those European and North-American datasets with the objective of determining the degree to which the 14 countries included in the analysis have been able to achieve an equitable distribution of physician services.
The paper starts by defining our equity measurement instruments in Section 1. Section 2 contains a summary of the salient features of the health care systems in the 14 countries which may affect the degree to which systematic deviations of an equitable distribution may occur by income status. Section 3 provides a description of the data and estimation methods used and Section 5 presents the main results. We conclude with a discussion in Section 5.
1. Horizontal inequity in health care delivery
1.1. Defining horizontal inequity
Many OECD countries have explicitly included equity in access to health care as one of the main objectives in policy documents (Van Doorslaer et al., 1993; Hurst and Jee-Hughes, 2001). In most European countries and in Canada, an egalitarian viewpoint of social justice seems to have been an important source of inspiration for these positions with respect to health care access. This is not true of the United States, where the (more libertarian) viewpoint that access ought to be guaranteed to a minimum standard of health care appears to have been one of the driving forces behind the introduction and expansion of public programmes like Medicaid and Medicare. But also in many other countries, traces of both viewpoints can be found. In Ireland and the Netherlands, for instance, health care systems have only aimed to equalize access for the lower income parts of the population. Usually, the horizontal version of the egalitarian principle is interpreted to require that people in equal need of care are treated equally, irrespective of characteristics such as income, place of residence, race, etc.2 It is this principle of horizontal equity that the present study uses as the yardstick for the international comparisons. This yardstick is obviously only useful for performance measurement to the extent that this principle is in accordance with a country’s policy objectives. For countries not subscribing to this
227 principle, the methods may still be useful for comparison with others but not for internal performance measurement.
The method we use in this paper to measure the degree of horizontal inequity in health care delivery is conceptually identical to the ones used in Wagstaff and Van Doorslaer (2000a) and Van Doorslaer et al. (2000). It proceeds by comparing the actual observed distribution of medical care by income with the distribution of need. Because a measure of the need for medical care is obtained by the method of indirect standardization, it does assume implicitly that “on average, the system gets it right” or that the average treatment differences between those in unequal need are appropriate. This means that in order to statistically equalize needs for the groups or individuals to be compared, we are using the average relationship between need and treatment for the population as a whole as the vertical equity norm. In other words: on the assumption, that the average relationship can be used as the (country specific) norm, we will investigate to what extent there are any systematic deviations from this norm by income level.
1.2. Measuring inequity
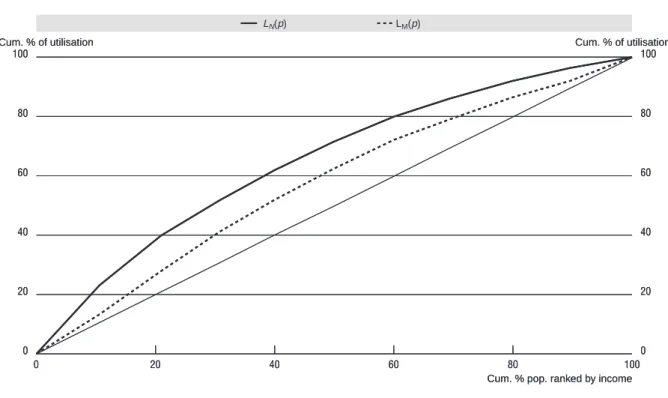
Let mi denote the amount of medical care received by individual i in a given period. The inequality in the distribution of medical care by income is captured by the medical care concentration curve LM (R)) in fig 1, which graphs the cumulative proportion of medical care against the cumulative proportion R of the sample, ranked by income. The concentration index, CM, corresponding to LM(R) indicates the degree of inequality in the distribution of medical care and can be measured as twice the area between LM(R) and the diagonal, or equivalently as:
(1)
But the degree of inequality in utilization of medical care will tell us something about the degree of inequity only in the unlikely event that need for medical care does not vary with income. If this is not the case, it needs to be compared to the degree of inequality in need. Using the method of indirect standardization (see below) we can generate a predicted value for each individual i indicating the amount of medical care she would have received if she had been treated as others with the same need characteristics were, on average, treated by the system.3 We interpret this as her need for medical care, N. By analogy, we can then define a concentration index of need (i.e.indirectly standardized medical care) CN based on the concentration curve of need, labeled LN(R), as follows:
(2)
The extent of horizontal equity can then be assessed by comparing each income group’s share of “need” (or need-expected utilization) with its share of medical care (or unstandardized utilization). If horizontal equity obtains, each group’s medical care share will equal its share of need. The degree of horizontal inequity can be measured by comparing the curves LM(R) and LN(R) in Figure 1: if the latter lies above (below) the former, the higher income groups obtain a higher (lower) share of medical care than their share of need, and we say there is horizontal inequity favoring the better-off (worse-off). The proposed measure of horizontal inequity HIWV is defined as twice the area between the need and medical care concentration curves and can simply be computed as the difference between CM and CN:
(3)
A positive (negative) value of HIWV indicates horizontal inequity favoring the better-off (worse-off). A zero index value indicates no horizontal inequity, i.e.that medical care and need are proportionally distributed across the income distribution. It is worth emphasizing that coinciding concentration curves for need and actual use provide a sufficient but not a necessary condition for no inequity. Even with crossing curves, one could have zero inequity if, for example, inequity favoring the poor in one part of the distribution exactly offsets inequity favoring the rich in another.4
+ +
= −
=
∫
m mWVP L p p C
HI
1
0
(
)
d
2
1
m
i*,
dR
)
(
2
1
1 0
∫
−
= L R
CN N
[
]
∫
− = −= 1
0
(
)
(
)
d
2
N M M NWV L p L p p C C
228
1.3. Explaining horizontal inequity
Obviously, if any inequitable pattern of utilisation is observed, the interesting question is why it arises. There are several ways in which one can try to go beyond measurement and towards explanation of inequity findings.5 One straightforward – albeit indirect – method of assessing to what extent any observed inequity patterns are due to the distribution of other (i.e.non-need) factors which may have an impact on the demand for care is by including such additional determinants in the need standardization process. Even if such determinants clearly do not belong in a vector of need adjusters, it allows to assess indirectly to what extent the observed degree of inequity is affected by the inclusion of such non-need determinants. This approach resembles the assessment of the role of “intermediary factors” and “confounders” in the analysis of any association. In this case, the question is to what extent the association between an individual’s health care use and his or her relative rank in the income distribution is mediated or confounded by variables other than acceptable proxies for “need” such as demographics and self-reported morbidity.
In this paper, we will briefly explore the role of just two other possible access determinants: private health insurance coverage and regional access differences. Obviously, the inclusion of a dummy variable indicating that the individual (or household) has private coverage allows for the estimation of an insurance effect, but it does not enable us to distinguish between the moral hazard effect (those with insurance are likely to have higher use) and the selection effect (those with higher expected use are more likely to buy cover). Because the voluntary purchase of such cover is related to the likelihood of (future) consumption, in principle the insurance coverage variables ought to be treated as endogenous. We do not attempt such an investigation here. The sole purpose of this exercise is to ascertain to what extent the existence and unequal distribution of such coverage affects the degree of measured inequity. Similarly, the question to what extent income-related differences in physician utilisation rates are driven by regional differences in availability ideally ought to be examined using the appropriate variables capturing regional characteristics like GP and specialist densities, mean distances to facilities, etc. In the absence of such regional data, the regional dummies inevitably only capture inter-regional differences in utilisation but do not allow to attribute these differences to specific regional characteristics. Still, because
Figure 1. Concentration curves for actual and need-expected medical care
0 100
80
60
40
20
0
100
80
60
40
20
0
20 40 60 80 100
LM(p)
LN(p)
Cum. % of utilisation Cum. % of utilisation
Cum. % pop. ranked by income
0 100
80
60
40
20
0
100
80
60
40
20
0
20 40 60 80 100
LM(p)
LN(p)
Cum. % of utilisation Cum. % of utilisation
229 of their policy relevance, it seems worth exploring to what extent our inequity findings are affected by the insurance and regional factor.
2. Differences in equity-relevant health care delivery system characteristics in Europe
While all of these countries included in this analysis – except for the United States6 – had by 1996 achieved close to universal coverage of their population for the majority of physician services, important other between-country differences remain with respect to potentially equity-relevant features of their financing and delivery systems. In Appendix Tables A1 and A2 we have summarized some of the salient system characteristics which may have an impact on any differential utilisation of the general practitioner or medical specialist by income level. In a number of countries, there are different groups of insured with often varying degrees of coverage or rules of reimbursement at different levels of income. This is the case for rather small numbers of high income earners with private coverage in Denmark and Germany, but it concerns sizeable portions of the population in Ireland and the Netherlands. Some countries’ public insurance rules, like Portugal, France and Belgium, still require their citizens to pay substantial copayments while in many other countries (like Denmark, Canada, Germany, Spain, Portugal and the United Kingdom) visits to public sector doctors are free at the point of delivery. In some countries, notably Denmark, Canada, Ireland, Italy, The Netherlands, Portugal, Spain and the UK, the primary care physician acts as a “gatekeeper” referring to secondary care provided by medical specialists, whereas in other countries, there is direct access to all physicians. Some countries pay their general practitioners mainly by capitation (Denmark, Italy, Netherlands) or salary (Greece, Portugal, Spain) whereas others rely mainly on fee-for-service payment. Although this summary is by no means complete in the sense that it provides a full picture of the diversity represented by these systems characteristics, it does serve to illustrate which factors may help to account for any regularities found in the cross-country differences in horizontal equity.
3. Data and estimation methods
3.1. Data
The data for the European Union (EU) member countries are taken from the third wave (held in 1996) of the European Community Household Panel (ECHP) conducted by Eurostat, the European Statistical Office.7 The ECHP is a survey based on a standardised questionnaire that involves annual interviewing of a representative panel of households and individuals of 16 years and older in each EU member state (Eurostat, 1999). It covers a wide range of topics including demographics, income, social transfers, health, housing, education, employment, etc. We use data for the following twelve member states of the EU: Austria, Belgium, Denmark, Germany, Greece, Ireland, Italy, Luxembourg, Netherlands, Portugal, Spain and the United Kingdom. The three missing member states are France, Finland and Sweden.8 The Canadian data are taken from the 1996 wave of the National Population Health Survey (NPHS) conducted by Statistics Canada.9 A total of 73 402 individuals aged 12 years or older were selected for an in-depth interview, but we have only included individuals of 16 and older. The survey includes questions on health care utilization, health status, risk factors, and demographic and socio-economic information. The data are weighted using the survey weights to adjust for the complex multi-cluster sample design of the NPHS. The US data are taken from the Medical Expenditure Panel Survey (MEPS) conducted by the Agency for Healthcare Research and Quality (AHRQ)10 It is a nationally representative survey that collects detailed information on the health status, access to care, health care use and expenses, and health insurance coverage of the civilian noninstitutionalized population of the United States. Analysis was restricted to individuals over the age of 16. Some summary information on all surveys is presented in Table 1.
The ECHP income measure (i.e.our ranking variable) is disposable (i.e.after-tax) household income per equivalent adult, using the modified OECD equivalence scale.11 Total household income includes all the net monetary income received by the household members during the reference year (which is 1995 for the 1996 wave). It includes income from work (employment and self-employment), private income (from
230
investments and property and private transfers to the household), pensions and other direct social transfers received. No account has been taken of indirect social transfers (e.g.reimbursement of medical expenses), receipts in kind and imputed rent from owner-occupied accomodation. Income information was more limited in the Canadian survey. Respondents are only being asked for their best estimate of total income, before taxes and deductions, of all household members from all sources in the past 12 months in eleven income categories. We assigned $2 500 to the lowest income category, $87 500 to the highest income category and midpoints to the remaining categories. These assigned income values were equivalised using the “modified OECD scale”. The US before-tax household income measure recorded in the survey was adjusted to a net household income using estimates of the federal tax paid per household, which was obtained with the NBER TAXSIM model. Insufficient information was available to estimate state taxes.
Measurement of utilisation of general practitioner (GP) and medical specialist services in the ECHP is based on the question “During the past 12 months, about how many times have you consulted a GP/medical specialist?” Similar questions referring to a 12 month reference period were used in Canada and the United States, though the US MEPS survey does not distinguish between GP and specialist visits. The measurement of health was based two types of questions. Respondents’ categorical responses to a question on self-assessment of their general health status in the ECHP could be “Very good, good, fair, bad or very bad” while the analogous five response options in the NPHS and MEPS are “Excellent, very good, good, fair or poor”. A further health related question in the ECHP is: “Do you have any chronic physical or mental health problem, illness or disability? (yes/no)” and if so “Are you hampered in your daily activities by this physical or mental health problem, illness or disability? (no; yes, to some extent; yes, severely)”. We used two dummies to indicate the degree of limitation. Similar but not quite identical questions were used in the NPHS and MEPS. The exact wording and definition is presented in Table 2.
The survey information used on health insurance coverage is described in Table 3. The available information in the ECHP is fairly limited and not very specific. The few questions are insufficiently tailored to specific countries to be always meaningful. The question was “Are you (also) covered by private medical insurance, whether in your own name or through another family member?” This variable for many countries may be an indicator of a mixture of various different types of (additional) coverage. It can be the main source of cover (as for higher income groups in The Netherlands), it can be complementary cover (for copayments or for things not covered in the public scheme, as in e.g.Austria, Denmark, Ireland, Luxembourg, Spain) or it can be supplementary or “double cover” (for things already covered in the public sector, as e.g.in the United Kingdom). In several countries, this variable can refer to various types at the time. For example, in Belgium, it can be the coverage for “normal physician services” for self-employed (who do not have compulsory cover), it can be complementary cover for hospital public
Table 1. Details of surveys and samples
Year Survey Age limits Sample size Recall period
doctor visits Income variable Equivalence scale
Canada 1996 National
Population Health Survey
16+ 55 249 12 months Before tax
household income, per equiv adult, midpoints
11 classes
Modified OECD
12 EU member states
1996 European
Community Household
Panel
16+ 105 889 12 months Disposable
household income per equiv adult
Modified OECD
United States 1996 Medical
Expenditure Panel Survey
16+ 15 973 12 months Net hh income
after federal tax, estimated using
TAXSIM
Modified OECD
231 copayments or it can be supplementary cover. In the MEPS, the variables relating to (private) health insurance coverage were far more detailed. For the sake of comparability, we neverteless only used a simple 0/1 indicator of the presence of private coverage without specifying further detail of type and degree of coverage. Similarly, for the NHPS, we only used whether or not the individual had private coverage for prescription drugs. Whatever the type and level of private coverage, in virtually all countries for which the variable is available, the uptake of private cover generally tends to rise with income level.
The information available in the ECHP regarding the region of residence of the respondents was very limited. Mostly for privacy reasons, either no information was provided (as in Denmark, Germany, Luxembourg, Netherlands) or only at a very broad regional level (all other countries). Also the MEPS public use files only contain the four large US Census regions. Only in the NPHS, some more detailed regional disaggregation below provincial level was available but for comparative purposes we only used the provincial level. As such, the regional fixed effects on physician visits can only pick up variations across some large regions in the various countries and cannot really be assumed to pick up local circumstances in supply of and demand for such care. The information we could use is presented in Table 3.
3.2. Estimation methods
Health care utilisation data like physician visits are known to have a very skewed distribution with typically the large majority of survey respondents reporting zero or few visits and only a very small proportion reporting frequent use. Various specifications of two-part models have been proposed in
Table 2. Details of health questions
Country and survey Wording of general self-assessed health question
and response categories Wording of question on chronic ill-health European ECHP “How do you rate your health in general?”
very good, good, fair, bad or very bad
“Do you have any chronic physical or mental health problem, illness or disability? (yes/no)” and if so “Are you hampered in your daily activities by this physical or mental health problem, illness or disability? (no/ yes, to some extent/ yes, severely)”.
Canadian NPHS In general would you say your health is excellent/very good/good/fair/poor?
Because of any condition or health problem, do you need the help of another person in preparing meals/in shopping for groceries or other necessities/in doing normal everyday housework/in doing heavy household chores such as washing walls or yard work/in personal care such as washing, dressing or eating/in moving about inside the house? (yes/no). US MEPS In general, compared to other people of
[one’s] age, would you say your health is excellent/very good/good/fair/poor?
Combination of a number of questions asking whether respondent is limited in any way in the ability to work at a job, do housework or go to school because of an impariment of a physical or mental health problem (yes/no).
Table 3. Details of insurance and region variables
Country survey Wording of private health insurance question Regional dummies European ECHP “Are you (also) covered by private medical insurance, whether
in your own name or through another family member?”
Regional dummies for Belgium (2), Ireland (1) , Austria (2), UK (10), Italy (10), Greece (3), Spain (6), Portugal (7)
Canadian NPHS Four questions: “Do you have insurance that covers all or part of the cost of your prescription medications? (Include any government or employer-paid plans) (yes/no)”
10 provinces
US MEPS Constructed from a series of detailed questions about insurance status. Indicates whether or not the individual had any private insurance during the year
Four large census regions: Northeast, Midwest, South and West
232
the literature, distinguishing between the probability of positive usage and the conditional amount of usage given positive use in the reference period (cf. e.g.Pohlmeier and Ulrich, 1995; or Jones, 2000, for a review). The choice depends on both theoretical and statistical considerations regarding the utilization process. The two-part model we have used to predict “needed” health care use is based on a logit specification for the first part and a truncated negative binomial count model for the second (conditional) part. This version resembles the hurdle model proposed by Mullahy (1986) and used before by e.g.Gerdtham (1997) and Wagstaff and Van Doorslaer (2000b) to analyze equity in the utilisation of physician visits.
The logit model estimates the probability of any positive use in the reference period as (4)
where Λ(.) is the cumulative density function of the logistic distribution and β is the estimated parameter vector. For the second part we use a truncated negative binomial model with the truncation at zero (cf.e.g.Greene, 1997). The expected value of positive consumption with this model, conditional on consumption being positive, is
(5)
where β is the estimated coefficient vector and Po is the probability of observing zero counts. 1/(1-Po) is an adjustment factor to ensure that the probabilities of positive counts sum to one (Pohlmeier and Ulrich, 1995). The combined two-part model predictions of overall utilization are obtained by multiplying the predictions from equations 4 and 5. For all countries and surveys, cross-sectional sample weights were used in all computations in order to make the results more representative of the countries’ populations.12 Robust standard errors were obtained by applying White’s correction for heteroskedasticity. Huber’s correction for cluster sampling was applied for countries where cluster sampling had been used and primary sampling unit information was made available.13
4. Results
4.1. Quintile distributions of health care utilisation
Tables 4-7 present unstandardized and need-standardized quintile distributions of GP and specialist visits for the EU countries and Canada. Standardized distributions were obtained by adding the difference between the observed and standardized (or expected) means per quintile to the overall country sample mean. Expected means were obtained using a simple (one-part) OLS model for convenience. European quintile rates have to be interpreted with caution as they were computed as population-weighted averages of country-specific quintiles.14 Simple difference and ratio measures for
)
(
)
1
(
Pr
ob y= x = Λ xβ)
1
1
)(
exp(
)
,
0
(
0 P x
x y y E i i
− =
≥ β
Table 4. Mean number of GP visits by income quintile (unstandardised)
Note: EU-12 rates computed as weighted average of country-specific rates.
Austria Belgium Denmark Germany Greece Ireland Italy Luxem-bourg
Nether-lands Portugal Spain United
Kingdom EU-12 Canada
Bottom 20% 6.02 6.47 3.41 5.53 2.96 4.75 4.76 3.70 3.10 4.27 4.19 4.90 4.83 4.07
20-40% 6.00 6.51 3.47 5.69 2.37 4.87 5.20 4.01 3.25 3.71 4.37 4.51 4.87 3.54
40-60% 5.21 4.84 3.31 5.08 2.27 3.37 4.63 3.40 3.00 3.62 4.23 3.64 4.29 3.13
60-80% 4.74 3.94 2.77 4.86 1.71 2.86 4.43 3.17 2.69 3.45 3.24 3.22 3.88 2.83
Top 20% 4.97 4.26 2.35 4.08 1.65 2.59 3.51 2.37 2.56 2.88 2.66 2.74 3.30 2.72
Mean 5.39 5.21 3.06 5.05 2.19 3.69 4.51 3.33 2.92 3.59 3.74 3.80 4.23 3.26
Q1/Q5 1.21 1.52 1.45 1.36 1.80 1.83 1.35 1.56 1.21 1.48 1.58 1.79 1.46 1.50
Q1-Q5 1.05 2.21 1.06 1.45 1.31 2.16 1.25 1.33 0.55 1.39 1.53 2.16 1.52 1.35
233 the bottom and top quintile have been added to ease cross-country comparisons of utilization differences by income level.
It is clear that some countries, notably Germany and Austria, have above-European average rates of utilization for both GP and specialist visits. Some general patterns can be observed. Countries with below-average utilisation rates for both types of visits include Ireland, Netherlands, Denmark, UK, Portugal, Spain and Greece. Belgium and Italy have above-average GP visit rates only and Luxembourg
Table 5. Mean number of GP visits by income quintile
OLS standardised for age, sex and morbidity
Note: EU-12 rates computed as weighted average of country-specific rates.
Austria Belgium Denmark Germany Greece Ireland Italy Luxem-bourg
Nether-lands Portugal Spain United
Kingdom EU-12 Canada
Bottom 20% 5.09 5.33 2.92 5.00 2.16 4.12 4.57 3.36 2.83 3.23 4.01 4.02 4.29 3.44
20-40% 5.49 5.68 3.07 5.23 2.22 3.83 4.72 3.61 2.94 3.43 3.90 3.92 4.39 3.33
40-60% 5.47 5.09 3.37 5.12 2.39 3.47 4.46 3.43 2.98 3.77 3.87 3.71 4.26 3.23
60-80% 5.14 4.86 3.11 5.20 2.04 3.49 4.50 3.22 3.02 3.83 3.49 3.79 4.23 3.10
Top 20% 5.77 5.08 2.84 4.67 2.10 3.51 4.22 3.02 2.82 3.67 3.42 3.59 3.99 3.19
Q1/Q5 0.88 1.05 1.03 1.07 1.03 1.17 1.08 1.11 1.00 0.88 1.17 1.12 1.08 1.08
Q1-Q5 –0.68 0.25 0.07 0.33 0.05 0.61 0.35 0.33 0.01 –0.44 0.59 0.44 0.31 0.25
N 6 446 5 928 4 978 8 510 11 258 7 363 17 434 1 898 9 111 11 577 15 283 6 103 105 889 55 249
Table 6. Mean number of specialist visits by income quintile (unstandardised)
Note: EU-12 rates computed as weighted average of country-specific rates.
Austria Belgium Denmark Germany Greece Ireland Italy Luxem-bourg
Nether-lands Portugal Spain United
Kingdom EU-12 Canada
Bottom 20% 2.65 2.21 0.98 2.95 1.89 0.53 1.14 2.81 1.68 1.22 1.45 1.32 1.83 1.18
20-40% 2.91 1.93 0.96 3.45 1.63 0.58 1.31 2.52 2.07 1.07 1.64 1.12 1.99 1.19
40-60% 2.65 1.70 1.05 3.52 1.78 0.57 1.24 1.97 1.82 1.21 1.58 1.14 1.98 1.10
60-80% 2.62 1.58 1.17 3.07 1.60 0.70 1.29 2.41 1.76 1.54 1.58 0.98 1.84 1.16
Top 20% 3.39 2.04 0.98 3.48 1.56 0.74 1.34 1.99 1.61 1.80 1.70 1.14 2.03 1.20
Mean 2.84 1.89 1.03 3.29 1.69 0.62 1.26 2.34 1.79 1.37 1.59 1.14 1.93 1.17
Q1/Q5 0.78 1.08 1.00 0.85 1.21 0.72 0.85 1.41 1.04 0.68 0.85 1.16 0.90 0.98
Q1-Q5 –0.74 0.17 0.00 –0.53 0.33 –0.21 –0.20 0.82 0.07 –0.58 –0.26 0.18 –0.20 –0.02 N 5 578 5 801 4 980 8 485 11 257 7 361 17 428 1 898 9 125 11 574 15 283 6 104 104 875 55 249
Table 7. Mean number of specialist visits by income quintile
OLS standardised for age, sex and morbidity
Note: EU-12 rates computed as weighted average of country-specific rates.
Austria Belgium Denmark Germany Greece Ireland Italy Luxem-bourg
Nether-lands Portugal Spain United
Kingdom EU-12 Canada
Bottom 20% 2.40 1.87 0.92 2.64 1.32 0.44 1.05 2.48 1.45 0.90 1.34 1.06 1.60 0.99
20-40% 2.75 1.78 0.84 3.21 1.47 0.46 1.20 2.32 1.81 0.98 1.49 0.91 1.81 1.13
40-60% 2.68 1.74 1.05 3.57 1.83 0.58 1.24 2.01 1.81 1.22 1.48 1.15 1.99 1.13
60-80% 2.66 1.84 1.25 3.24 1.81 0.78 1.31 2.46 2.02 1.66 1.69 1.17 1.97 1.25
Top 20% 3.67 2.24 1.09 3.80 1.99 0.86 1.51 2.43 1.84 2.07 1.96 1.41 2.30 1.33
Q1/Q5 0.65 0.84 0.84 0.69 0.66 0.51 0.69 1.02 0.79 0.44 0.68 0.75 0.70 0.74
Q1-Q5 –1.27 –0.37 –0.17 –1.16 –0.67 –0.42 –0.47 0.06 –0.39 –1.16 –0.62 –0.35 –0.69 –0.34 N 5 578 5 801 4 980 8 485 11 257 7 361 17 428 1 898 9 125 11 574 15 283 6 104 104 875 55 249
234
is the only country with above-average specialist visit rates only. Canadian rates of GP and especially specialist care are below the European average. These inter-country differences in mean utilisation levels are probably closely related to GP and specialist availability and remuneration per country.
More interesting for our purposes are the patterns by income. It is striking that in all countries, low income groups are more intensive users of GP care than higher income groups. The discrepancy differs by country but, on average, the bottom decile group reports about 50 per cent more GP visits or about 1.5 extra visit per year. However, after need standardization, the quintile gradients almost disappear in both ratio and difference measures and for almost all countries. In two countries – Austria and Portugal – they even change sign and turn into pro-rich differences. In all other countries, GP utilisation seems to be distributed very much as expected on the basis of reported morbidity.
The picture is quite different for visits to a medical specialist (Tables 6 and 7). The unstandardised use is distributed much more equally across quintiles, with only a slightly higher use for higher income groups in most countries. After standardization, however, all distributions (except the one for Luxembourg) are clearly and significantly in favour of the higher income groups, suggesting that the rich appear to receive a higher share of specialist visits than expected on the basis of their need characteristics. The gradients seem particularly steep in Portugal and Ireland. As in the case of GP visits, the Canadian distribution is quite close to that of the average European country, albeit at a somewhat lower level. Although these differences may appear to be small, their relative magnitude becomes more apparent when expressed in terms of the total populations: even if the richest quintile on average has only 0.5 more visits per adult per year than the poorest quintile, it would require in most countries a redistribution of many millions of visits in order to achieve an equal standardize d distribution.
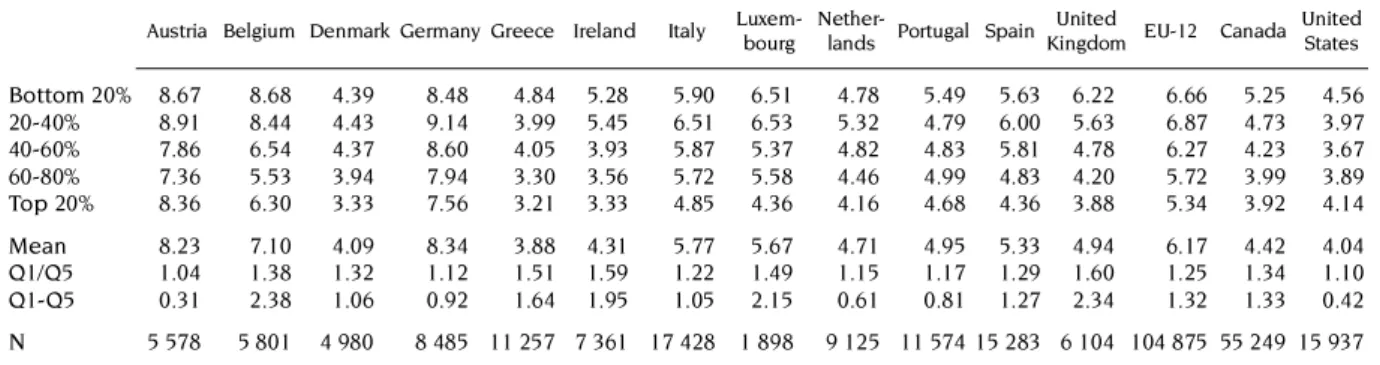
Tables 8 and 9 show the overall picture as the (unstandardized) quintile distributions for all physician visits (i.e.the sum of GP and specialist visits) to enable a comparisons with the United States. It is worth noting from Table 8 that the average US physician visit rates are much lower than in Europe and somewhat lower than in Canada. In all countries, without any exception, there is a negative difference between the bottom and top quintile rates. However, Table 9 shows that, after standardisation for need differences, the utilisation gradient becomes positive in most countries but the bottom-to-top quintile ratio is substantially below one only in Portugal (0.72), the United States (0.77), in Austria (0.79) and Greece (0.85). This suggests that only in these countries, the standardized doctor use of the poorest quintile is 20-30 per cent lower than that of the richest quintile. In all other European countries and in Canada, this difference is less than 10 per cent suggesting that there is not much of a gradient in utilization left after the standardisation, or a fairly equal treatment for equal need across quintiles.
While quintile distribution are useful in providing insights into the differences in the distributions of physician visits across countries, the methods used to measure inequality differences based on the bottom-versus-top differences and ratios suffer from well-known disadvantages. First, while the use of OLS for the standardisation has the convenient property of preserving the mean in the predictions, its
Table 8. Mean number of total physician visits by income quintile (unstandardised)
Note: EU-12 rates computed as weighted average of country-specific rates. Austria Belgium Denmark Germany Greece Ireland Italy
Luxem-bourg
Nether-lands Portugal Spain United
Kingdom EU-12 Canada United States Bottom 20% 8.67 8.68 4.39 8.48 4.84 5.28 5.90 6.51 4.78 5.49 5.63 6.22 6.66 5.25 4.56
20-40% 8.91 8.44 4.43 9.14 3.99 5.45 6.51 6.53 5.32 4.79 6.00 5.63 6.87 4.73 3.97
40-60% 7.86 6.54 4.37 8.60 4.05 3.93 5.87 5.37 4.82 4.83 5.81 4.78 6.27 4.23 3.67
60-80% 7.36 5.53 3.94 7.94 3.30 3.56 5.72 5.58 4.46 4.99 4.83 4.20 5.72 3.99 3.89
Top 20% 8.36 6.30 3.33 7.56 3.21 3.33 4.85 4.36 4.16 4.68 4.36 3.88 5.34 3.92 4.14
Mean 8.23 7.10 4.09 8.34 3.88 4.31 5.77 5.67 4.71 4.95 5.33 4.94 6.17 4.42 4.04
Q1/Q5 1.04 1.38 1.32 1.12 1.51 1.59 1.22 1.49 1.15 1.17 1.29 1.60 1.25 1.34 1.10
Q1-Q5 0.31 2.38 1.06 0.92 1.64 1.95 1.05 2.15 0.61 0.81 1.27 2.34 1.32 1.33 0.42
235 use is inappropriate for a continuous and normally distributed dependent variable with non-negative count data and a lot of zero observations. Second, while quintiles do provide some relevant information on the distribution of the utilization, both of the “range” measures of inequality (i.e.the ratio and the difference of the bottom and top quintile) are arbitrary and incomplete in the sense that they are not sensitive to the experience of the middle three quintiles. In the next section we examine whether the general patterns observed are confirmed when we use more appropriate standardisation techniques and inequity measures. We also explore some of the possible determinants of the findings. 4.2. Horizontal inequity indices
The estimated CM and HIWV indices and their t statistics are presented in Tables 10-12 for all countries15 for GP visits, specialist visits and the total of the two. In the standardisation procedure, need is proxied by a vector of nine age-sex dummies,16 four dummy variables for self-assessed health
Table 9. Mean number total physician visits by income quintile
OLS standardised for age, sex and morbidity
Note: Results for all non-US countries computed as sums of standardised visit rates for GP and specialist. Austria Belgium Denmark Germany Greece Ireland Italy
Luxem-bourg
Nether-lands Portugal Spain United
King-dom
EU-12 Canada United States Bottom 20% 7.48 7.20 3.83 7.64 3.48 4.56 5.62 5.84 4.28 4.13 5.34 5.08 5.90 4.43 3.59
20-40% 8.24 7.46 3.92 8.44 3.69 4.29 5.92 5.92 4.75 4.41 5.39 4.83 6.20 4.47 3.79
40-60% 8.15 6.82 4.42 8.69 4.22 4.05 5.70 5.45 4.79 4.99 5.35 4.87 6.25 4.35 3.90
60-80% 7.79 6.69 4.36 8.44 3.85 4.27 5.81 5.68 5.03 5.49 5.18 4.96 6.20 4.35 4.26
Top 20% 9.43 7.32 3.93 8.48 4.10 4.37 5.73 5.45 4.66 5.74 5.38 5.00 6.29 4.52 4.67
Q1/Q5 0.79 0.98 0.98 0.90 0.85 1.04 0.98 1.07 0.92 0.72 0.99 1.02 0.94 0.98 0.77
Q1-Q5 –1.95 –0.12 –0.10 –0.84 –0.62 0.18 –0.11 0.39 –0.38 –1.61 –0.04 0.08 –0.39 –0.10 –1.08 N 5 578 5 801 4 980 8 485 11 257 7 361 17 428 1 898 9 125 11 574 15 283 6 104 104 875 55 249 15 937
Table 10. HIWV indices for GP visits, 12 EU countries and Canada, 1996
Note: Blanks in the table indicate that the relevant standardising variables were missing for the country in question.
1. Need only = Indirectly standardised for 15 need dummies [age, sex, self-assessed health and (hampered by) chronic condition]. 2. Need + region = ind. stand. includes need plus regional dummies.
3. Need + private insurance = ind. stand. includes need plus private insurance dummy. 4. Need + both = ind. stand. includes need, region and private insurance dummies. 5. t-statistics based on robust standard errors.
HIWV index adjusted for:
Need only1 Need + region2 Need + priv. insurance3 Need + both4
CM t5 HIWV t HIWV t HIWV t HIWV t
Austria –0.0496 –3.45 0.0178 1.34 0.0173 1.31 0.0102 0.78 0.0094 0.71
Belgium –0.1023 –8.78 –0.0198 –2.25 –0.0194 –2.53 –0.0189 –2.18 –0.0187 –2.46
Denmark –0.0787 –5.24 –0.0045 –0.32 –0.0053 –0.38
Germany –0.0631 –5.04 –0.0188 –1.66
Greece –0.1257 –8.06 –0.0109 –0.87 –0.0215 –1.66
Ireland –0.1282 –9.39 –0.0430 –2.97 –0.0409 –2.82 –0.0238 –1.64 –0.0226 –1.54
Italy –0.0642 –3.57 –0.0277 –1.78 –0.0133 –0.89 –0.0271 –1.73 –0.0131 –0.87
Luxembourg –0.0883 –5.51 –0.0324 –2.14
Netherlands –0.0472 –4.59 –0.0034 –0.35
Portugal –0.0696 –5.17 0.0146 1.19 0.0087 0.71 0.0188 1.53 0.0128 1.04
Spain –0.0908 –8.35 –0.0437 –4.12 –0.0402 –3.79 –0.0398 –3.75 –0.0372 –3.51
United Kingdom –0.1154 –9.7 –0.0145 –1.28 –0.0148 –1.31 –0.0147 –1.29 –0.0144 –1.28
236
(SAH) and one or more dummies for the presence of a chronic condition or handicap and the extent to which it hampers the individual in his or her usual activities. These are the same variables as the ones used in the standardised quintile distributions but the regressions are now estimated using the two-part model consisting of a logit and a zero-truncated negative binomial model. The HIWV indices and their robust standard errors were estimated using equation A4 in the appendix. Country indices, ranked by magnitude, along with 95 per cent confidence intervals are also presented in Figures 2-4.
The significantly negative CM indices in the first column of Table 10 confirm that in all countries, without any exception, lower income groups use GP services significantly more often than higher income groups. However, this unequal distribution largely coincides with the (unequal) distribution of need for such care: both the table and the graph in Figure 2 show that there are few countries with a HIWV index for GP visits that is large (in absolute value) and significantly different from zero. The index
Table 11. HIWV indices for specialist visits, 12 EU countries and Canada, 1996
Note: See Table 10.
HIWV index adjusted for:
Need only Need + region Need + priv insurance Need + both
CM t HIWV t HIWV t HIWV t HIWV t
Austria 0.0360 1.83 0.0807 3.93 0.0771 3.76 0.0776 3.74 0.0732 3.53
Belgium –0.0303 –2.46 0.0358 2.93 0.0378 2.56 0.0247 2.07 0.0289 2.05
Denmark 0.0197 0.72 0.0725 2.71 0.0621 2.33
Germany 0.0150 1.01 0.0587 4.14
Greece –0.0360 –2.15 0.0767 5.13 0.0576 3.78
Ireland 0.0696 3.02 0.1496 6.30 0.1469 6.21 0.0691 2.85 0.0663 2.74
Italy 0.0205 1.26 0.0621 3.95 0.0471 3.17 0.0547 3.52 0.0422 2.88
Luxembourg –0.0658 –2.51 –0.0041 –0.16
Netherlands –0.0206 –1.34 0.0372 2.47
Portugal 0.0959 3.85 0.1904 7.18 0.1630 6.44 0.1756 6.59 0.1528 5.97
Spain 0.0248 1.65 0.0763 4.86 0.0499 3.26 0.0645 4.13 0.0428 2.79
United Kingdom –0.0245 –1.12 0.0830 4.12 0.0749 3.78 0.0623 3.10 0.0570 2.88
Canada 0.0009 0.08 0.0631 6.45 0.0608 6.23 0.0514 5.26 0.0500 5.12
Table 12. HIWV indices for all physician visits, 12 EU countries, Canada and the United States, 1996
Note: See Table 10.
HIWV index adjusted for:
Need only Need + region Need + priv insurance Need + both
CM t HIWV t HIWV t HIWV t HIWV t
Austria –0.0223 –1.41 0.0403 2.91 0.0389 2.81 0.0340 2.45 0.0320 2.30
Belgium –0.0866 –9.26 –0.0009 –0.12 –0.0001 –0.02 –0.0030 –0.43 –0.0016 –0.23
Denmark –0.0564 –3.73 0.0163 1.23 0.0131 0.99
Germany –0.0343 –3.21 0.0118 1.32
Greece –0.0882 –6.28 0.0273 2.51 0.0127 1.13
Ireland –0.1095 –7.56 –0.0112 –0.82 –0.0098 –0.71 –0.0061 –0.44 –0.0053 –0.38
Italy –0.0492 –2.86 –0.0083 –0.60 –0.0012 –0.09 –0.0095 –0.69 –0.0021 –0.16
Luxembourg –0.0815 –5.19 –0.0159 –1.11
Netherlands –0.0384 –3.64 0.0127 1.38
Portugal –0.0274 –1.68 0.0635 4.72 0.0524 3.97 0.0626 4.65 0.0525 3.98
Spain –0.0602 –5.58 –0.0084 –0.85 –0.0137 –1.39 –0.0091 –0.91 –0.0136 –1.38
United Kingdom –0.0973 –8.17 0.0094 0.91 0.0074 0.72 0.0043 0.41 0.0034 0.33
Canada –0.0595 –9.09 0.0107 1.87 0.0044 0.77 0.0013 0.23 –0.0029 –0.51
237 Figure 2. HIWVindices for GP visits (with 95% confidence intervals), EU countries and Canada
0.08
ESP
0.04
0
-0.04
-0.08
0.08
0.04
0
-0.04
-0.08
IRL LUX ITA BEL DEU GBR GRC CAN DNK NLD PRT AUT
0.08
ESP
0.04
0
-0.04
-0.08
0.08
0.04
0
-0.04
-0.08
IRL LUX ITA BEL DEU GBR GRC CAN DNK NLD PRT AUT
Figure 3. HIWV indices for specialist visits (with 95% confidence intervals), EU countries and Canada 0.25
LUX
0.20
0.15
0.10
-0.05
BEL NLD DEU ITA CAN DNK ESP GRC AUT GBR IRL PRT
0.05
0
0.25
0.20
0.15
0.10
-0.05 0.05
0 0.25
LUX
0.20
0.15
0.10
-0.05
BEL NLD DEU ITA CAN DNK ESP GRC AUT GBR IRL PRT
0.05
0
0.25
0.20
0.15
0.10
-0.05 0.05
238
values are negative for Canada and for all European countries except Portugal and Austria, but they are significantly different from zero only in the cases of Spain, Ireland, Luxembourg and Belgium. The latter three countries are all known to have more favourable cost sharing arrangements for certain groups of low-income users of GP care cf. Appendix Table A1). This is not true in Spain where GP visits are free at the point of delivery but there is a 40 per cent copayment rate for prescribed medicines, with cost sharing exemptions for pensioners only. On the other hand, also the Netherlands has free GP care for the sickness fund insured and Germany and Austria also have some copayment exemptions for low income groups but these countries do not show significantly negative indices. It appears to matter, therefore, to what extent these copayment exemptions are targeted towards the poorest in society and whether they can be reinsured.
Unfortunately, the ECHP survey does not provide any further detail on the copayment liability per household or individual. Only the variable indicating the presence of some type of private insurance coverage can be used as a proxy for it. We can observe that standardizing for private insurance generally tends to produce only a (marginal) reduction in the HIWV indices for GP visits. The impact is not negligible in Ireland and it makes the index more negative in the cases of Portugal and in Canada. In Canada it even makes it significant. This means that private insurance in these two countries contributes to a less pro-poor distribution of GP utilisation. But the effect is not very large.
The impact of standardising for regional utilisation differences is similarly small, although it now makes the Ireland and Luxembourg HIWV indices significantly negative. Inclusion of both variables simultaneously only makes the Irish inequity index non-significant and the Canadian inequity index significantly negative. However, all index values are relatively small and, all in all, these findings suggest that there seems to be little to worry about in terms of GP access in most European countries and Canada. There is some slight horizontal inequity in GP use favouring the lower income groups in about a third of these countries only, but the reasons for it seem to have little to do with inequalities in private coverage or regional differences. The only real exception is Ireland, where private insurance coverage does seem to be an important factor contributing to this finding.
Figure 4. HIWV indices for all physician visits (with 95% confidence intervals), 12 EU countries, Canada and United States
0.100
LUX
0.075
0.050
0.025
-0.050
IRL ESP ITA BEL GBR CAN DEU NLD DNK GRC AUT PRT
0
-0.025
USA
0.100
0.075
0.050
0.025
-0.050 0
-0.025 0.100
LUX
0.075
0.050
0.025
-0.050
IRL ESP ITA BEL GBR CAN DEU NLD DNK GRC AUT PRT
0
-0.025
USA
0.100
0.075
0.050
0.025
-0.050 0
239 Things are quite different with respect to the use of specialist services, as shown in Table 11. Concentration indices for specialist use (CM) show much less evidence of a concentration of utilization among the less well-off. They are negative and significant only in Belgium, Luxembourg and Greece, while they are not significantly different from zero in any of the other countries except Ireland and Portugal, where they are significantly positive. In all countries except Luxembourg we now find significantly positive HIWV indices, indicating a significant degree of horizontal inequity favouring the rich. Figure 3 shows that this is a general phenomenon but that there are also some important differences between countries. Especially in Portugal and Ireland, the degree of “excess” use of specialist visits by higher income groups (as compared to their needs) is much larger than in the other European countries, which generally show index values between 0.04 and 0.08.
The other columns in Table 11 also shed some light on the sensitivity of these positive index values to insurance and region. Inclusion of private insurance in the standardisation reduces the HIWV index values in all countries where it is available, but most of all in Ireland. The Irish index is more than halved when private insurance is standardised for, indicating that the lack of such cover does seem to act as some access barrier to specialist care for lower income groups, in spite of their entitlement to free specialist care (cf. Harmon and Nolan, 2001). After controlling for private cover, the remaining degree of horizontal inequity is of the same magnitude as that in other countries. In Portugal, on the other hand, the influence of private insurance coverage seems much smaller than the influence of regional utilization differences. This is mainly becayse private insurance is much less widespread in Portugal. Moreover, even after standardising for region and insurance effects, the Portuguese HIWV index remains very large.
Adjusting for region reduces the degree of inequity in the other southern European countries (Spain, Greece and Italy) and – to a lesser extent – in the UK and Canada. This highlights the fact that in these countries the income-related inequities in specialist use are – at least in part – associated with regional differences in access to such care. Not surprisingly, adjusting for private insurance coverage also reduces the degree of inequity in the UK (where quicker or more convenient access to specialist care is precisely what such cover buys) and to a lesser extent also in Spain, Belgium, Denmark, Austria, Canada and Italy. It is important to note that in none of the countries studied, adjusting for insurance and region makes the inequity index non-significant. This suggests that although region and insurance cover do play some role, they cannot account entirely for the observed inequity in specialist use.
Finally we turn to the results for all physician visits in Table 12 and Figure 4, defined as the sum of GP and specialist visits. The main reasons are i) to take into account that substitution of GP visits by specialist visits may occur to a different degree among the rich and the poor and ii) to enable a comparison with the US 1996 MEPS data which do not allow to distinguish between GP and specialist visits. It is worth noting that this distinction is not always clear in some European countries either. Apparently, also in Luxembourg both GPs and specialists provide primary care services and it is well known that certain specialists, like pediatricians and gynaecologists to a large extent provide primary care services in some countries with direct access to specialist care like Belgium, Italy and Spain. As a result, the separate analysis is not always entirely feasible. On the other hand, of course, the aggregation of GP and specialist visits compounds the problem of quality differences. It is most improbable that GP and specialist visits represent on average the same level of quality. As a result, any equity patterns detected in volume are very likely to underestimate any true treatment inequities taking account of quality differences. Table 12 shows that the use of the aggregate of all doctor visits is unequally distributed in favour of the lower income groups (all CM indices negative) in all countries, but most of all in Ireland, and least of all in the United States. Further disaggregation of the US visits rate shows that this is mainly due to the major component, i.e.office visits, being only slightly pro-poor (CM= –0.0044, t = –0.55). The other two types of physician visits, i.e.outpatient visits (CM = –.1463, t = –3.68) and especially emergency room visits (CM= –.1865, t = –11.12), show very negative and significant inequality indices. This highlights the fact that the average mix of visits is not the same at every income level.
In all countries, the distribution of all physician visits is also fairly closely related to need since most HIWV indices are not significantly different from zero. There are only four exceptions: Greece,
240
Austria, and especially the United States and Portugal do show a significant degree of horizontal inequity favouring the rich. In these countries, lower income groups report significantly lower physician use than can be expected on the basis of average usage patterns. In Greece, this seems to have a lot to do with regional disparities in utilization since the index becomes non-significant after adjusting for region. The fact that the US inequity index is reduced by almost 50 per cent when account is taken of private health insurance cover stems from the fact that, unlike in Europe or Canada, such cover is the primary source of coverage for the great majority of the population under 65, but it does indicate that a large part of the inequity seems to be due to gaps and inequalities in such cover. In Portugal, on the other hand, neither adjustment for region, nor for insurance affect the degree of inequity a great deal.
5. Conclusion
In this paper we have compared distributions of doctor visit rates in 12 EU member countries to similar distributions for Canada and the United States in 1996. The identical design and questionnaire used in the European Community Household Panel survey provides a very high degree of comparability across the European countries, but also for Canada and the United States a fairly high degree of comparability could be achieved. We have used both simple quintile distributions and concentration indices estimated by means of two-part models to assess the extent to which adults in equal need for physician care appear to have equal rates of doctor visits. We emphasized that the usefulness of the measurement method crucially hinges on the acceptance of the horizontal equity principle as a policy goal. To the extent that equal treatment for equal need is not an explicit policy objective, the measures cannot, of course, be used for equity performance assessment.
The cross-country comparative results suggest the following conclusions. First, while average annual rates of doctor visits vary substantially between countries, the patterns of their relative distribution across income groups show some remarkable similarities. Secondly, there appears to be relatively little reason for concern about the access to – and distribution of – GP services. The higher use of GP care among lower income individuals that is observed in virtually every country appears to be largely in accordance with the higher needs for such care by these groups, suggesting little or no horizontal inequity. In a few countries only – Spain, Ireland, Belgium and Luxembourg – preferential treatment of lower income groups through copayment reductions or exemptions may explain the (slightly) pro-poor distributions. Third, the fairly equal need-standardised distributions of GP care are hardly affected by regional disparities in GP utilisation or by the presence of private insurance coverage. This is not so surprising given that a good deal of this private cover relates to the use of medicines or buys preferential access to secondary care. Fourth, the distributional patterns are completely different for the use of medical specialist care. In all countries except Luxembourg, significantly positive indices emerge, indicating inequity favouring the higher income users. In two countries, Portugal and Ireland, the degree of such a pro-rich distribution of use is much larger than in all other countries. Fifth, for the use of specialist services, the findings can to some extent be explained by the presence of (additional) private cover and by regional disparities in the availability of such care. Especially in Ireland, but to a lesser degree also in Spain, Belgium, Denmark, Austria, Canada, Portugal and Italy, private insurance seems to be one of the factors contributing to this finding. Similarly, systematic regional differences in utilization play some role in the generation of horizontal inequities in use by income, especially in the Southern European countries. However, neither the adjustment for insurance coverage, nor for the region of residence removes the inequities entirely: even after such correction, a significant degree of horizontal inequity in specialist usage remains in all countries. Sixth, aggregating all physician visits allows for an overall picture which assumes away quality differences between GP and specialist care but enables a comparison with the US results. In most countries, both poor and rich people do get to see a doctor when they appear to need one, but there are important differences in the type of doctor seen. In three European countries – Portugal, Austria and Greece – and in the United States, we find evidence of significant pro-rich inequity in total physician visits. In Greece, this is to a large extent related to regional disparities in doctor visits, while in the United States it is higly related to the presence of private insurance coverage.
241 The conclusion which emerges, therefore, is that most European countries and Canada appear to have ensured a fair degree of equal access to the GP for people with equal needs but unequal incomes. However, the same horizontal equity goal does not appear to have been attained with respect to the use of specialist services despite the fairly universal coverage of such services for decades now in most European countries and in Canada. Either higher income groups are over-utilising the services of specialists, or some access barriers for those on lower incomes remain. Differences in either insurance coverage or regional disparities appear to be only a small part of the explanation, although we need to point out that both of these variables were measured very crudely in this study. This finding corroborates earlier results for European health care systems and the United States (e.g.Van Doorslaer et al., 2000) and for Canada (e.g.McIsaac et al., 1997). The fact that it shows up in very different types of health care systems (albeit to differing degrees) suggests that it may have more to do with systematic differences in utilisation behaviour between higher versus lower income (or education) individuals than with the characteristics of health care delivery systems. A crucial question is, of course, whether the remaining systematic differentials in use are largely irrelevant from an equity point of view because they merely reflect differences in “tastes” for specialist services and do not translate into differences in health gains, or whether these use patterns do reflect important diagnostic and therapeutic quality differences which translate into the less well-off receiving lower standards of care than the better-off. Only in the latter case, they signal a violation of the equal-treatment-for-equal-need principle.
Disease-specific evidence for certain countries suggests that the differential patterns of utilization are by no means trivial. For example, one Canadian study has looked at differences in access to invasive cardiac procedurs after acute myacardial infarction by neighbourhood income in the province of Ontario (Adler et al., 1999). Whereas the rates of coronary angiography and revascularization were found to be significantly and inversely related to income, waiting times and one year mortality rates were significantly positively related to income. Each $10 000 increase in the neighborhoud median income was associated with a 10 percent reduction in the risk of death within one year. This suggests that differences in diagnostic and therapeutic utilization are not trivial and do appear to translate into differential outcomes by income as well. If such effects on access are so pronounced in a country with universal acces free of charge at the point of use, it is most unlikely that the differences in use of specialized services we find are less worrisome in countries without such universal free access.
Overall, in all countries except the United States, Portugal, Greece and Austria, total doctor visits appear to be distributed according to need, although the type of doctor seen varies with income. In Europe and Canada, lower income individuals are more likely to consult a GP while higher income individuals are more likely to see a specialist. In the United States, lower income people are more likely to consult a doctor through an emergency room or an outpatient department, while higher income individuals are more likely to consult a doctor in his office. To the extent that the quality of services rendered by these two types of doctors differs, and that the differentials are not merely due to taste differences but to access constraints in terms of either costs or information, this cannot be regarded as “equal treatment” and some concern over horizontal equity remains. This is even more true for the three countries where the use of GP or primary care doctor services does not compensate for the pro-rich distribution of specialist visits. In Austria and Portugal this horizontal inequity in overall doctor utilization could not be attributed to differential private coverage or regional disparities. It is worth noting, however, that the utilisation gradient in Austria appears to be of less concern given the very high average utilisation rates. With a (standardised) rate of 7.5 visits to the doctor per year, the bottom quintile can hardly be said to lack access. Perhaps the rate of 9.5 visits per year of the top quintile is more reason for concern!
Comparing our results to findings of others is difficult because of the many differences in approaches. Compared to the results presented in Van Doorslaer et al. (2000), there is only one different finding here: no significant inequity in all physician visits in 1996 for the Netherlands whereas we did find such a result for 1992. For Austria, Greece and Portugal we do not have any results of earlier analyses to compare with, but the present study confirms the earlier finding for 1987 for the United States (Van Doorslaer et al., 2000) that access to a doctor is not equal for those in apparently equal need. The pro-rich distribution of office visits is only very partially compensated for by the pro-poor
242
distribution in outpatient and emergency room visits. Indeed the results suggest that, if anything has changed, the distribution has become more pro-rich, since the horizontal inequity index for the United States has gone up from 0.044 in 1987 to 0.055 in 1996.
Our results also compare well to those from a recent Commonwealth Fund study. Schoen et al. (2000) have assessed disparities in access to health care by income in five countries using a common telephone survey. Whereas they found those with below average incomes to be in significantly worse self-reported health than average in all countries, these groups were only reporting significantly higher probabilities of a doctor visit in two of the countries studied, the UK and Canada. There were no differential probabilities in two other countries (Australia and New Zealand) and the lower income groups even had a significantly lower probability of having seen a doctor in the United States. Although the authors did not statistically standardize for need/morbidity differences across income groups in as in our study, the results for the three overlapping countries do seem to point into the same direction: little or no inequity by income in doctor access in Canada and the UK, but substantial inequity in the United States.
All in all, we hope that this paper has helped to demonstrate that even normative concepts like equity in health care access and use can be subjected to positive analysis and measurement using existing data sources if agreement can be reached on what the equity objectives are. The methods used could be adapted to analyze other types of health care use and to address other types of equity concerns (e.g.geographical, gender, ethnic or age disparities). The results show that even in the richest group of countries in the world, with fairly universal and comprehensive coverage of their populations some reason for concern about the unequal treatment for equal need remains.
243
NOTES
1. For various reasons, Finland, France and Sweden could not be included. Cf. footnote 8.
2. There is some debate as to whether it is not treatment but access, or rather access costs, which ought to be equalized (Mooney et al., 1991, 1992; Culyer et al., 1992a, 1992b; Goddard and Smith, 2001). For the present exercise, the difference seems fairly innocuous and mainly related to the interpretation of any remaining differences in utilization after standardising for need differences. To the extent that these are genuinely due to differences in preferences, and not due to differences in e.g. benefit perceptions resulting from differences in information costs, these would not be regarded as inequitable.
3. Note that this interpretation implies that “on average, the system gets it right”. The average relationship between need indicators and utilization, as expressed by the regression coeeficients, is the implied norm for assessing equity in this health care system. But this approach to measuring need is not intrinsic to the method of measuring equity. If need estimates could be obtained alternatively (e.g. from professional judgement), the equity measures could still be computed in the same way.
4. Cf. also footnotes 7 and 8 in Wagstaff and van Doorslaer (2000a).
5. One method proceeds by decomposing the total degree of inequality into its various sources and analysing cross-country differennces using a decomposition method proposed by Wagstaff et al. (200à). This approach is not pursued here because it requires identical variable definitions across countries.
6. During the first half of 1996, 83 per cent of all Americans were covered by private or public health insurance, leaving 17 per cent of the population, some 44.8 million persons, uninsured (Vistnes and Monheit, 1996). 7. More detailed information on the design and contents of this survey can be found at www-rcade.dur.ac.uk/echp/
8. Sweden does not take part in the ECHP. The French questionnaire only includes one question asking for all GP, medical specialist, dentist and optician visits which is not comparable to the other questions. Revised Finnish income data were not released yet at the time of the research.
9. More detailed information on the design and contents of this survey can be found at: www.stats.gov.nt.ca.
10. More detailed information on the design and contents of this survey can be found at www.meps.ahcpr.gov.
11. The modified OECD scale gives a weight of 1.0 to the first adult, 0.5 to the second and each subsequent person aged 14 and over, and 0.3 to each child aged under 4 in the household.
12. For the ECHP countries, in addition direct standardization for demographic differences was used by imposing the European age-sex distribution on all countries. This ensures that the differences between European countries are not merely a result of demographic differences.
13. Two countries (Luxembourg, Denmark) did not apply cluster sampling while some others (Germany, The Netherlands, Austria and Canada) did not provide the primary sampling unit information for privacy reasons. 14. In other words, the bottom European quintile does not contain the 20 per cent Europeans with the lowest
incomes but the population-weighted average of the bottom quintile of each of the 12 EU countries. 15. Except for the United States, for which we only have total physician visits.