GLOBAL
FINANCIAL
This is the seventh biannual Global Financial Centresreport, commissioned and published by the City of London from Z/Yen Group Ltd since March 2007. It has again taken the pulse and assessed the changing perspectives of market practitioners and regulators on what attracts them to locate in different international financial centres across the world. This report also adopts a new approach to profiling different types of centres along new dimensions of competitiveness that reflect how well-connected they are in the global financial architecture, and how diversified their financial services are. The reports provide a valuable basis for new work to be commissioned by the City of London to look more deeply at the factors driving the connectedness of established and emerging global financial centres.
Our job is to establish evidence for policies that will lead the City forward and we will be building on the valuable insights that this area of research has given us so far to look much more closely in future at the details of the competitive and cooperative factors.
What exactly affects the success of established and rapidly emerging major financial centres is a key question for London and the wider UK-based financial services industry and we are especially interested in how the leading centres will respond to the new challenges - for example the growing importance of Asia and the changes in international
supervision designed to minimise the effect of future crises. Whilst this will therefore be the last GFC report that we publish, we will be shortly announcing a new research programme that takes the
issues forward by examining them in greater depth.
It is important to note that responses for the current GFC report relate to the period to end 2009, a time of great volatility for the global economy as it began to emerge from deep recession. It is not surprising therefore to see the improvement in respondents’ optimism compared with the views of respondents six months and particularly one year before. Their optimism is still muted by the prospect of the challenges to be faced over the next few years in reaction to the financial crisis and any reading of relative rankings needs to take account of a very large uncertainty factor.
That said, the top-ranking centres have shown a much greater degree of stability in their perceived competitiveness to practitioners and are responding more robustly to the economic recovery. Respondents have assessed the two leading global centres of London and New York as level on ratings for the first time – a fact which bears out our view that these two are the ‘twin sister-cities of world finance’. The evidence of the survey points to the continued high ratings for these two leading global centres and reflects the multi-facetted nature of their competitive advantage. They both have rich institutional and communication linkages across the world. Respondents continue to believe that these two leading centres benefit from good levels of mutual cooperation -and as Chairman of Policy I see this in our good working relationships with New York. There are particular challenges for us to address this year and they are illuminated by this latest report. For the first time in four years, London has had more
Foreword
Stuart Fraser
questions raised by respondents in relation to the quality of its business environment, its access to skilled people and its infrastructure, than have been raised for New York. We cannot be complacent about this. Evidence from other commissioned research is that the comparative tax and regulation ‘offer’ of London as the leading global financial centre in Europe needs to be carefully considered by policymakers in the UK and in the EU. Proposed measures to address fiscal deficits and to put in place new frameworks for regulation and supervision of financial services need to be transparent and commensurate with the objectives sought. There are
important questions for us to explore with policymakers to ensure that a progressive reduction in fiscal deficits retains the confidence in the UK economy as a competitive location for an international financial services sector that last year contributed £60billion in taxes, 12% of the total UK tax take.
Retaining a fair, consistent and predictable tax policy and supervisory environment is critical to retaining London’s role as a global centre for a large range of financial services and this also requires our retaining open markets for the UK and our encouraging them globally. It is significant in this connection that Hong Kong and Singapore retain their ratings as the leading financial centres in Asia in the current report, but that there is continuing uncertainty about second-tier Asian centres.
The research underpinning the GFC reports has provided a unique record of practitioner perspectives through the global boom and the finance-led economic crisis. Z/Yen have monitored the perspectives of practitioners across the globe as the effects of unsustainable global capital-imbalances and the pursuit of risk taking by many, if not all, global integrated investment banks led to a reliance on sophisticated products designed to distribute risk that turned out in the end to have mediated systemic financial collapse.
We have seen concerted central bank interventions and government stimulus programmes of unprecedented scale. Their success in preventing a plunge into economic depression is a testament to the importance of international institutions and of intergovernmental cooperation. There is an equal challenge for the recovery phase. To resist those protectionist sentiments that would make the problem of global recovery much worse, we need to see an established improvement in the economies of Europe and the US to meet the stronger recovery in Asia. We need to secure trust in the operation of financial institutions, and establish the appropriate taxation, regulation and supervision to both encourage recovery and to protect against future crises.
Stuart Fraser London March 2010
The City of London’s Global Financial Centres Index (GFCI) was first produced by the Z/Yen Group in March 2007, to examine the major financial centres globally in terms of competitiveness, using a set of ratings and rankings. The GFCI has subsequently been updated every six months and the increase in the number of respondents and additional data in successive editions has enabled us to highlight the changing priorities and concerns of finance professionals across a period of great economic instability.
This report - Global Financial Centres 7 (GFC 7) - builds on the approach adopted in GFCI 6, with its increased emphasis on the inter-connectedness of centres, to allow a more in-depth examination of the
underpinnings of competitiveness. Whilst the ratings element is retained, there is a new approach to profiling major centres in terms of their linkages within the global financial architecture and the extent and quality of the services that they offer. This combined approach is reflected in the change of name to ‘Global Financial Centres’.
Background
The GFC approach provides profiles, ratings and rankings for 75 financial centres, drawing on two separate sources of data – instrumental factors (external indices) and responses to an online survey.
■Instrumental factors:Previous research indicates that there are many factors that combine to make a financial centre competitive. These can be grouped into five over-arching ‘areas of
competitiveness’ – People, Business Environment, Infrastructure, Market Access and General
Competitiveness. Evidence of a centre’s performance in these areas is drawn from a range of external measures. For example, evidence about a fair and just business environment is drawn from a corruption perception index and an opacity index. Sixty-four factors have been used in GFC 7, of which 24 have been updated since GFCI 6.
■Financial centre assessments: These are provided by responses to an ongoing online questionnaire completed by international financial services
professionals. Respondents are asked to
rate those centres with which they are familiar and to answer a number of questions relating to their perceptions of competitiveness. Since GFCI 6, a total of 507 new respondents have filled in the questionnaire, providing 7,161 new assessments from financial services respondents globally across the period July 2009 to December 2009. Overall, 32,170 financial centre assessments from 1,690 financial services professionals were used to compute GFC 7, with older assessments discounted according to age.
Full details of the methodology behind GFC 7 can be found at
www.cityoflondon.gov.uk/gfci. The ratings and rankings are, as previously, calculated using a ‘factor assessment model’, which combines the instrumental factors and questionnaire assessments. The full list of the 75 financial centres rated and profiled in GFC 7 is shown on page 28.
The ratings and rankings approach has been used to track financial services competitiveness over time, both in terms of individual centres’ performance, and
the wider issues of concern to
professionals in the field. In the light of the recent economic turmoil globally, the extensive data collected over the last three years allows for a deeper analysis of the aspects that make centres
competitive in different markets, from global leaders to local specialists. The data now held includes over 51,000 assessments from more than 3,000 respondents. The dataset used to model GFC 7 includes over 8.5 million data-points.
This allows us to create financial centre profiles. Generating a taxonomy is often likely to be a difficult and contentious endeavour. There are many alternative methods and many possible ways of defining different profiles of financial centres. The key requirement here was to base the profiling on hard data from the research rather than introduce our own subjective opinions.
Starting with clustering and correlation analysis of the different factors we have identified three key measures (axes) that determine a financial centre’s profile along different dimensions of
competitiveness:
■‘Connectivity’– this represents how well known a centre is around the world and how connected it is to other financial centres. The measure draws on the questionnaire data, whereby respondents are asked to assess only those centres with which they are personally familiar. A centre’s connectivity is assessed using a combination of ‘inbound’ assessment locations (the number of locations from which a particular centre receives assessments) and ‘outbound’ assessment locations (the number of other centres which respondents from a particular centre assess). A 2/3 weighting was given to inbound assessments. If the weighted ratings for a centre were provided by over 75% of other centres, the centre was
deemed to be ‘Global’. If the ratings were over 50%, this centre was deemed to be ‘Transnational’.
■‘Diversity’– the breadth of industry sectors that flourish in a financial centre. We consider this ‘richness’ of the business environment to be similar to biodiversity and use a combination of biodiversity indices (calculated on the 64 instrumental factors for each centre) to measure this. A high score on this measure means that a centre is well diversified; conversely a low score reflects a less rich financial services diversity.
■‘Speciality’– the quality and depth of certain industry sectors in a centre, such as asset management, investment banking and insurance. A centre’s performance on this dimension is
calculated from the difference between the GFCI rating and the industry sector ratings. If a centre is well above its overall GFCI rating in the industry sectors, it is profiled as a specialist.
Here, ‘Diversity’ (Breadth) and ‘Speciality’ (Depth) are combined on one axis to create a two dimensional table of financial centre profiles. The 75 centres are each assigned to a profile on the basis of a set of rules for the three measures: how well connected a centre is, how broad its services are, and how
specialised it is. The rating for each centre and the range for each profile category are given in brackets for reference. This profile ‘map’ shows the eight ‘Global Leaders’ (in the top left of the table) which have both broad and deep financial services activities and are connected with many other financial centres. This list includes London, New York, Hong Kong and Singapore, centres that have been identified as the leading global financial centres in previous editions of the GFCI. Paris and San Francisco are ‘Global Diversified’ centres as they are equally well connected but do not exhibit the same depth in different
Table 1
Financial Centre Profiles
Broad & Deep
Global Leaders
GFC 7 Range: 775 - 660
Chicago(678)
Frankfurt(660)
Hong Kong(739)
London(775)
New York(775)
Singapore(733)
Toronto(667)
Zurich (677) Established Established Transnational
GFC 7 Range: 692 - 595
Boston(652)
Edinburgh(615)
Melbourne(617)
Stockholm(595)
Sydney (670)
Tokyo (692)
Vancouver (623)
Established Players
GFC 7 Range: 647 - 566
Johannesburg (566)
Washington D.C.(647)
Relatively Broad
Global Diversified GFC 7 Range: 651 - 642
Paris(642)
San Francisco(651)
Transnational Transnational Diversified GFC 7 Range: 617 - 579
Amsterdam(604) Copenhagen(587) Dublin(612) Madrid(581) Milan(579) Montreal(617) Munich(610)
Seoul (615)
Vienna (583)
Local Diversified GFC 7 Range: 606 - 480
Athens (480)
Brussels(591)
Helsinki(573)
Lisbon(529)
Mexico City(563)
Osaka (606)
Oslo (581)
Sao Paulo(590)
Warsaw(520)
Relatively Deep
Global Specialists
GFC 7 Range: 671 - 643
Geneva(671)
Luxembourg(643)
Transnational Transnational Specialists GFC 7 Range: 670 - 568
Bahrain(587)
British Virgin Islands(596)
Cayman Islands(615)
Gibraltar (568)
Guernsey (632)
Hamilton(612)
Isle of Man(618)
Jersey(643)
Shenzhen(670)
Taipei(638)
Local Nodes GFC 7 Range: 600 - 535
Bahamas(557)
Buenos Aires(535)
Jakarta(535)
Malta(565)
Manila(527)
Mauritius(552)
Monaco (578)
Qatar (600)
Rio de Janeiro(566)
Wellington(582
Emerging
Global Contenders GFC 7 Range: 668 - 516
Beijing(651) Dubai(618) Moscow(516) Shanghai(668) Transnational Transnational Contenders GFC 7 Range: 571 - 549
Bangkok (549)
Kuala Lumpur (571)
Mumbai (562)
Evolving Centres GFC 7 Range: 574 - 447
Budapest(481)
Glasgow(570)
Istanbul(470)
Prague (543)
Reykjavik (447)
Riyadh(507)
Rome(574)
St. Petersburg(501)
Tallinn (488)
Global
Transnational
activities to be considered ‘Global Leaders’. Similarly, Geneva and Luxembourg are ‘Global Specialists’ (specialising primarily in Asset Management) but do not have sufficiently broad ranges of financial services activities to be ‘Global Leaders’. The four ‘Global Contenders’ of Beijing, Dubai, Moscow and Shanghai are profiled as global because there is widespread awareness of their activities, but their financial services are not currently sufficiently broad and deep to be considered leaders. Chart 1 shows the profiles mapped against the GFC 7 ranges.
The profiles shown in Table 1 are used in our geographical analyses later in this report.
Chart 1
Financial Centre Profiles Mapped against GFC 7 Ranges
Ranges >
GFCI7 Rating >
400 450 500 550 600 650 700 750 800
Evolving Centres Local Nodes Local Diversified Established Players Transnational Inter
national Contenders Transnational Specialists Transnational Diversified Established T
ransr national Global Contenders Global Specialists Global Diversified Global Leaders
The full set of GFC 7 ratings and rankings are shown in Table 11. We believe that the financial centre profiles are a very important addition to the GFC 7 report. However, the changes in individual centre ratings remain important and allow us to identify certain headline changes:
■Greater confidence amongst financial services professionals, shown by a rise in assessments;
■London and New York are now level in the ratings for the first time. Respondents continue to believe that these centres exhibit good levels of co-operation;
■London has dropped 15 points in the ratings, from 790 to 775 points - the second largest drop in scores. New York has overtaken London in three of the sub-indices: Business Environment, People and Infrastructure;
■Hong Kong and Singapore still lead in Asia but there is continuing uncertainty about secondary Asian centres.
GFC 7 shows that of the 75 centres rated, 71 centres have received higher ratings and only four have seen decreases in their ratings. GFCI 5 demonstrated that the financial crisis had created
uncertainty and a significant reduction in confidence, with an unprecedented fall in the ratings for every centre. There was also a ‘flight to safety’ with the ratings of the top centres falling less than those of the bottom centres. GFCI 6 saw a rise in many ratings potentially demonstrating the start of a return in confidence. This seventh report confirms that respondents to the online survey are more confident about the future of financial services than they have been for over a year.
Chart 2 demonstrates this particularly well – the three month average assessments of the top centres are now at the highest levels since GFCI started:
The Main Headlines of GFC 7
Chart 2
3 Month Moving Average
Assessments for the Top 25 Centres
Date >
A
v
erage Assessments >
GFCI5 GFCI4
GFCI3 GFCI6 GFC7
500 550 600 650 700 750 800 Dec-09 Nov-09 Oct-09 Sep-09 Aug-09 Jul-09 Jun-09 May-09 Apr-09 Mar-09 Feb-09 Jan-09 Dec-08 Nov-08 Oct-08 Sep-08 Aug-08 Jul-08 Jun-08 May-08 Apr-08 Mar-08 Feb-08 Jan-08 Dec-07 Nov-07 Oct-07 Sep-07 Aug-07 Jul-07
GFC 7 shows a general rise in ratings but this rise is variable, with the change in ratings varying from minus 25 points (Shenzhen) to plus 64 (Warsaw), with an average movement of plus 23 points. The largest rises in ratings were achieved mainly by the centres at the lower end of the index with Warsaw, Moscow, Lisbon and Budapest all seeing rises in excess of 50 points, to regain lost ground, with drops in score of 53, 58, 30 and 80 points respectively over the last two editions of GFCI.
For the first time in the GFCI, London and New York are equal first, both with 775 points on a scale of 1 to 1,000, as a result of London’s score falling 15 points. The gap between the two centres has consistently been narrow, ranging from 5 to 19 points over the previous six editions of GFCI, and Chart 3 demonstrates their recent convergence.
Chart 3
Top Four Centres GFCI Ratings Over Time
Date >
GFCI rating >
650 670 690 710 730 750 770 790 810 830
GFC 7 GFCI 6
GFCI 5 GFCI 4
GFCI 3 GFCI 2
GFCI 1
Singapore
Hong Kong
New York
London
Chart 3 shows that London and New York still lead the field although the gap between them and the third placed centre has been steadily cut from 81 points a year ago and 45 points six months ago to just 36 points now. The main concerns voiced about London’s competitiveness are the fear of a regulatory backlash that limits the freedom of financial institutions and the levels of corporate and personal taxation that may drive high earners abroad. New regulatory arrangements are also a concern in New York, and the loss of skilled personnel to the industry is a
concern of respondents in all the leading centres.
We have long argued that the
relationship between London and New York is mutually supportive and a gain for one does not mean a loss for the other. Whilst many industry professionals still see a great deal of competition, policymakers appear to recognise that working together on certain elements of regulatory reform is likely to enhance the competitiveness of both centres.
Finance professionals, however, believe that common regulation
between North America and Europe will be extremely difficult to negotiate. The GFCI questionnaire asks respondents which financial centres they believe are suffering most as a result of the current financial crisis. New York and London head the list, receiving substantially more mentions than any other centre:
This finding backs up the GFCI ratings. Respondents generally feel that the two long-established global centres have been impacted on the most by the economic crisis. This is reflected in GFC 7; London has fallen by 15 points in the ratings and although New York has seen a rating increase of 1 point, this is against an average increase of 23 points. Hong Kong received fewer than 20% of the
mentions of New York while Singapore received fewer than 10 mentions overall. Related to this, the GFCI questionnaire also asks what the most significant risks to competitiveness posed by the financial crisis are. The most commonly identified risks are shown in Table 3:
Table 2
The Five Centres Believed to be Suffering Most from the Crisis
Financial Centre Number of Mentions since GFCI 6
New York 110
London 89
Dubai 51
Reykjavik 37
Cayman Islands 29
Table 3
The Five Centres Believed to be Suffering Most from the Crisis
Risk Number of Mentions since GFCI 6
Regulatory ‘Kneejerk’ / Backlash 42
Credit Risk for Financial Institutions 29
Recession / Inflation 21
Increased Taxation 19
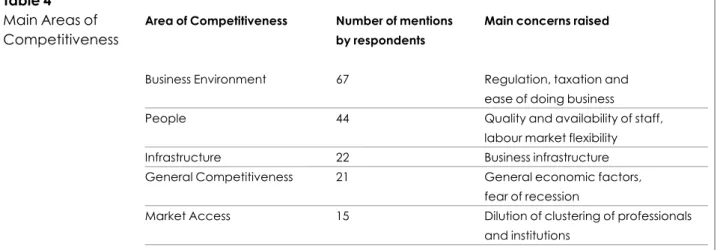
The fear of regulatory overload leads the field here and is backed up by responses to a further question in the GFCI
questionnaire about the most important factors of competitiveness. The number of times that each area is mentioned is summarised in Table 4:
Clearly the Business Environment is viewed as a key area - it is actually mentioned in responses more often than the next two areas, People and
Infrastructure, combined. This is a reflection of the regulatory reaction to the financial crisis but also reflects concerns over taxation. One of the themes that emerges from the responses is the need for predictability and stability of regulation.
One effect of London’s relative decline in competitiveness is that other leading European financial centres are catching up with London. Frankfurt was 141 points behind London six months ago and is now 115 behind while Zurich was 114 points behind and is now just 98 below London. Similarly, London’s lead over Paris and Geneva is less significant than it was six months ago in GFCI 6.
Another story to emerge from GFC 7 is the continuing development of the Asian financial centres. Overall the rise in scores of the Asian centres has continued, although it is not as dramatic as the
developments seen in GFCI 6. Hong Kong continues to thrive and has risen by 10 points since GFCI 6, maintaining its position in 3rd place just ahead of Singapore. Hong Kong and Singapore continue to be firmly established as the leading Asian centres. Tokyo, which, with the exception of GFCI 5, has always appeared in the top ten, has risen two places to 5th, and is the 3rd highest ranked Asian centre. There is some variability, however, about other Asian centres. GFCI 6 saw Shenzhen appear in the top 5 but GFC 7 sees it falling to 9th place and showing the largest drop in points in the survey. Shanghai has fallen one place to 11th although gaining 13 points, whilst Beijing and Seoul make considerable progress up the ranking to 15th and 28th respectively, both showing substantial gains in points. It is important therefore to pay attention to both the short term performance of these centres and their performance over the longer term.
Table 4
Main Areas of Competitiveness
Area of Competitiveness Number of mentions Main concerns raised by respondents
Business Environment 67 Regulation, taxation and ease of doing business
People 44 Quality and availability of staff,
labour market flexibility
Infrastructure 22 Business infrastructure
General Competitiveness 21 General economic factors, fear of recession
Market Access 15 Dilution of clustering of professionals and institutions
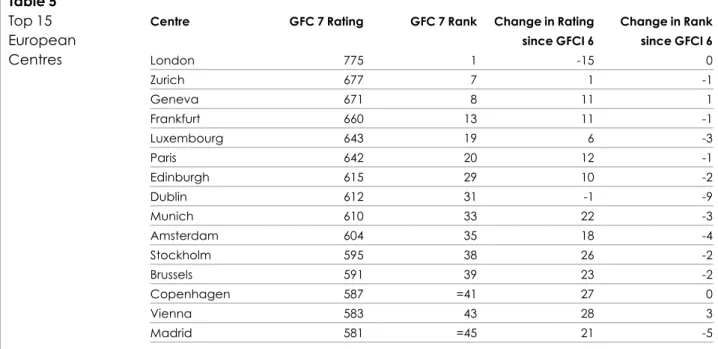
European financial centres have had mixed fortunes since GFCI 6. Table 5 shows the top 15 European financial centres, all of which have increased their ratings since GFCI 6 with the exception of London (-15) and Dublin (-1):
Zurich has slipped one place in the rankings and Geneva has gained one place; both remain in the top ten. Both centres remain strong in asset
management and private banking and receive strong support from respondents in the offshore centres and from London. All the major European centres display a good degree of consistency across the industry sub-indices and the area of competitiveness sub-indices. London is the leading financial centre in Europe but Frankfurt, Zurich and Paris also perform well in all areas – Zurich for example averages 8th place across all sector sub-indices with Frankfurt not far behind (further details of the sub-indices are shown on page 30).
From a profiling perspective, London, Zurich and Frankfurt are seen as ‘Global Leaders’. They are well known globally, and have a rich environment of different
types of financial services institutions. Geneva and Luxembourg, whilst being well connected, are seen to be high quality specialists in the field of Asset Management, rather than offering a fully diversified service, and are hence profiled as ‘Global Specialists’. Paris is a Global Centre and has very strong international connections. It does not, however, exhibit sufficient depth in financial services to be considered a Global Leader; we profile it as a Global Diversified Centre. Moscow is a ‘Global Contender’, exhibiting strong
international connections and many respondents (especially from Asia) have knowledge of the centre. Moscow does not yet have sufficient depth or breadth as a financial centre to be considered a specialist or diversified centre:
European Financial Centres
Table 5
Top 15 European Centres
Centre GFC 7 Rating GFC 7 Rank Change in Rating Change in Rank since GFCI 6 since GFCI 6
London 775 1 -15 0
Zurich 677 7 1 -1
Geneva 671 8 11 1
Frankfurt 660 13 11 -1
Luxembourg 643 19 6 -3
Paris 642 20 12 -1
Edinburgh 615 29 10 -2
Dublin 612 31 -1 -9
Munich 610 33 22 -3
Amsterdam 604 35 18 -4
Stockholm 595 38 26 -2
Brussels 591 39 23 -2
Copenhagen 587 =41 27 0
Vienna 583 43 28 3
The remaining centres in the European top 15 are classed as either Established or Diversified Transnational centres. The one exception to this being Brussels which is categorised as a ‘Local Diversified’ financial centre due to its lower
connectivity rating that the other leaders such as Zurich, Geneva, Frankfurt and Paris, although it is close to the boundary between Local and Transnational. Examining the assessments given to each major centre is a useful means of
assessing the relative strength and weakness of their reputations in different regions. It is important to note that
assessments given to a centre by people based there are excluded from the GFC 7 model to eliminate ‘home preference’.
In the following charts, the difference between overall mean assessments by region is shown. The additional vertical line shows the mean if all
assessments from the whole of the home region are removed.
Chart 4
Profile of European Centres
Broad & Deep
Relatively Broad
Relatively Deep
Emerging
Frankfurt London
Zurich
Paris Geneva
Luxembourg
Moscow
Established Transnational
Transnational Diversified
Transnational Specialists
Transnational Contenders
Established Players Local Diversified Local Nodes Evolving Centres
Edinburgh Stockholm
Amsterdam Copenhagen
Dublin Madrid
Milan Munich
Seoul Vienna
– –
– Athens
Brussels Helsinki Lisbon Warsaw
Monaco Budapest
Glasgow Istanbul Prague Reykjavik
Rome St. Petersburg
Tallinn
Global
Transnational
Local
London’s overall average assessment was 807. The chart on London indicates that London is well regarded in Europe but less well rated than average by the offshore centres; North American and Asian respondents are fairly close to the mean.
Zurich’s overall average assessment was 704. Zurich’s assessments show a more pronounced pattern than London with the Asian based respondents, who have a more negative perception of Zurich. European and North American respondents are positive against the mean.
Chart 5
Assessments by Region – Difference from the Mean – London
Average Assessment – Difference from Mean >
Location >
Mean without region
-200 -150 -100 -50 0 50 100
Offshore 29% North America 8% Europe 34% Asia 29%
Chart 6
Assessments by Region – Difference from the Mean – Zurich
Average Assessment – Difference from Mean >
Location >
-200 -150 -100 -50 0 50 100
Offshore 30% North America 8% Europe 37% Asia 25%
Frankfurt’s overall average assessment was 679. In a similar pattern to London, Frankfurt is given lower assessments by people based in offshore locations than elsewhere.
Chart 7
Assessments by Region – Difference from the Mean – Frankfurt
Average Assessment – Difference from Mean >
Location >
-200 -150 -100 -50 0 50 100
Offshore 12% North America 7% Europe 45% Asia 36%
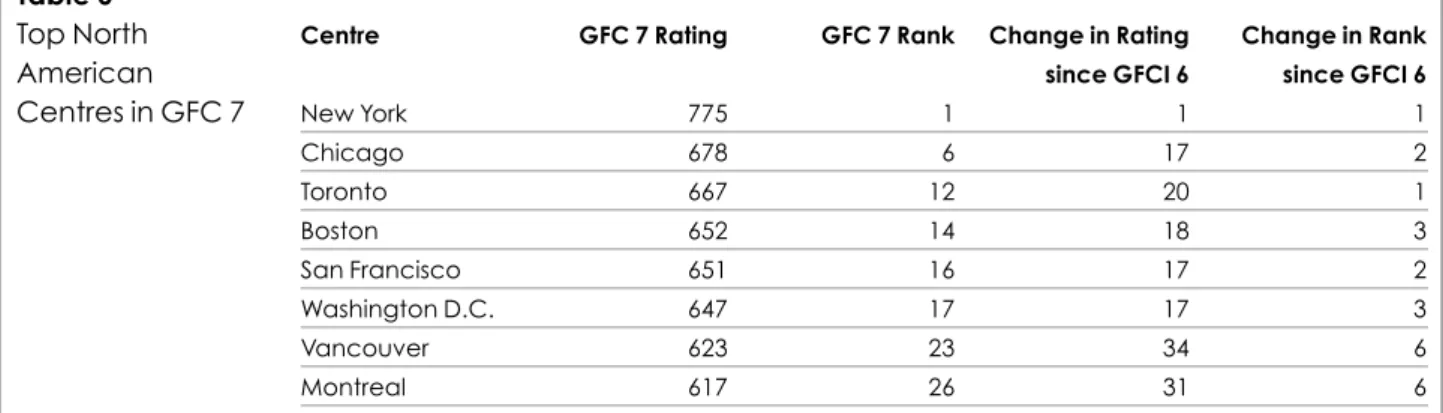
The North American Centres have all performed reasonably well in GFC 7 and all have increased their ratings from GFCI 6. As reported, New York has been impacted on the most by the financial crisis and has only risen by one point, while the Canadian centres have seen a greater increase in scores than the US centres:
Chicago retains its position in the GFC 7 top ten and remains the 2nd North American financial centre, after New York. Chicago is not just strong in derivatives trading, for which it is probably best known, but is a real ‘all-rounder’: it is strong in all areas, and in the top ten in all industry and area of competitiveness sub-indices. Chicago is rated highly by respondents based in New York but, surprisingly, very few other respondents in North America assessed Chicago.
Toronto has risen 20 points in the GFC 7 ratings. It is the 3rd North American financial centre and the clear leader in Canada. Toronto performs well in the People sub-index, where it is in 6th place, and in the Asset Management and Professional Services sub-indices, where it is 9th place in both categories. Calgary was recently added as a new financial centre to our online survey – it did not receive sufficient ratings to be included here.
New York, Chicago and Toronto all fit the profile of Global Leaders – they are well diversified, well connected and have strength across the sectors. San Francisco is profiled here as a Global Diversified Centre – it is well connected and serves a diversified industry but does not as yet show sufficient depth in enough sectors to be classified as a Global Leader.
North American Financial Centres
Table 6
Top North American Centres in GFC 7
Centre GFC 7 Rating GFC 7 Rank Change in Rating Change in Rank since GFCI 6 since GFCI 6
New York 775 1 1 1
Chicago 678 6 17 2
Toronto 667 12 20 1
Boston 652 14 18 3
San Francisco 651 16 17 2
Washington D.C. 647 17 17 3
Vancouver 623 23 34 6
Broad & Deep
Relatively Broad
Relatively Deep
Emerging
Global
Transnational
Local
Boston and Vancouver have both a broad and deep presence in financial services but are less well-connected with other centres around the world – they are ‘Established Transnational’ centres. Montreal is not yet deeply enough involved in some industry sectors to be an ‘Established Transnational’ centre. Washington is, perhaps surprisingly, an ‘Established Player’; on the measures of connectivity used for profiling, Washington is seen to be more of a local player than an international one, receiving support from some parts of North America (and Asia) but
not from London, Europe or New York. The difference between regional assessments is again examined here for some of the major centres, to see in which regions centres are most favourably regarded.
The overall average assessment for New York is 804. New York benefits from strong North American support but the offshore centres assess the city less positively. Europeans are close to the overall mean. Chart 8
Profile of North American Centres
Global Leaders Global Diversified Global Specialists Global Contenders
Chicago New York Toronto
San Francisco – –
Established Transnational
Transnational Diversified
Transnational Specialists
Transnational Contenders Established Players Local Diversified Local Nodes Evolving Centres
Boston Vancouver
Montreal – –
Washington D.C. – – –
Chart 9
Assessments by Region – Difference from the Mean – New York
Average Assessment – Difference from Mean >
Location >
-200 -150 -100 -50 0 50 100
Offshore 19%
North America 11% Europe 34%
Asia 35%
Chicago has an overall average assessment of 698. Chicago shows a similar pattern to New York with regard to the Offshore and North American
assessments, the former being lower than average, and the latter higher. Chicago is rated highly by respondents based in New York but surprisingly very few other
North American respondents assessed Chicago. A high level of response from Asian respondents is notable although the assessments given were lower than average.
Toronto is the only North American centre to receive a higher than average score from the offshore centres; it is also well regarded by respondents based in London, although less so by the rest of Europe.
Average Assessment – Difference from Mean >
Location >
-200 -150 -100 -50 0 50 100
Offshore 9% North America 13% Europe 32% Asia 44%
Mean without region Chart 10
Assessments by Region – Difference from the Mean – Chicago
Average Assessment – Difference from Mean >
Location >
-200 -150 -100 -50 0 50 100
Offshore 16% North America 18% Europe 26% Asia 39%
Mean without region Chart 11
Assessments by Region – Difference from the Mean – Toronto
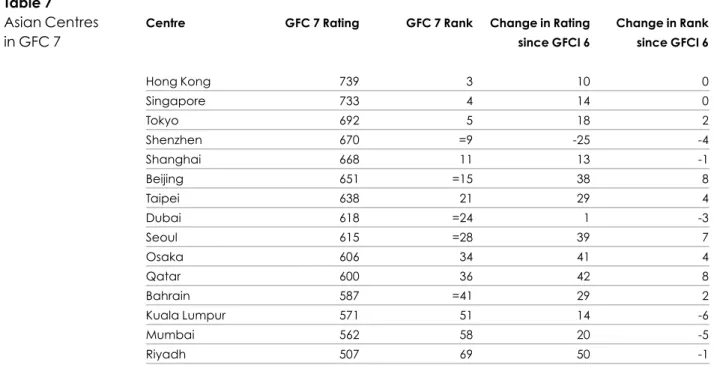
With the exception of Shenzhen, all Asian centres have shown an improvement in the GFC 7 ratings, which for many comes on top of a substantial increase in scores in GFCI 6.
Table 7
Asian Centres in GFC 7
Centre GFC 7 Rating GFC 7 Rank Change in Rating Change in Rank since GFCI 6 since GFCI 6
Hong Kong 739 3 10 0
Singapore 733 4 14 0
Tokyo 692 5 18 2
Shenzhen 670 =9 -25 -4
Shanghai 668 11 13 -1
Beijing 651 =15 38 8
Taipei 638 21 29 4
Dubai 618 =24 1 -3
Seoul 615 =28 39 7
Osaka 606 34 41 4
Qatar 600 36 42 8
Bahrain 587 =41 29 2
Kuala Lumpur 571 51 14 -6
Mumbai 562 58 20 -5
Riyadh 507 69 50 -1
Both Hong Kong and Singapore have continued to show a stable and strong performance. They are in 3rd and 4th places in all industry sector and competitiveness sub-indices, with the one exception of Singapore’s 5th place in the Insurance sub-index. Tokyo, which, with the exception of GFCI 5, has always appeared in the top ten, has risen two places to 5th, and is the third highest ranked Asian centre. It is a leading financial centre that performs well in most areas, placing it in the top 10 in all
sub-indices. Shanghai currently sits in 11th place and Beijing has risen by 38 points since GFCI 6 to 15th place. Shanghai does particularly well in the Banking, Asset Management and Insurance sub-indices. Beijing does well in the Insurance sub-index where it is in 7th place. Seoul, with an increase of 39 points has risen seven places in the rankings to 28th.Other notable improvements are recorded by Taipei and Osaka.
Global
Transnational
Local
Hong Kong and Singapore have clear profiles as Global Leaders. Beijing, Dubai and Shanghai are Global Contenders at present, in that they are all
well-connected but do not currently have sufficient breadth or depth in their financial services sectors to be Global Leaders. Shanghai is currently the strongest performer of the three. Tokyo profiles here as an Established
Transnational centre, in that it has breadth and depth of financial services but does not currently demonstrate the required global connectivity. Seoul is also a well diversified financial centre but currently lacks the depth of coverage in most sectors to be considered a leader. Shenzhen, despite its 9th place in GFC 7, only has a 58% connectivity rating and is thus profiled as a ‘Transnational’ centre rather than a ‘Global’ one.
It is useful to examine the pattern of assessments by region given to some of the major Asian centres, to see where they are well-regarded. In general, the
Asian centres are particularly well supported by Asian respondents in both the number of assessments and the average assessment given. Outside of Asia, the North American responses are more positive than average. The number of assessments given to Asian centres by American and European based
respondents is also low, suggesting that Asian centres are far less well known, and, probably as a consequence, less highly regarded than from within Asia.
Respondents from the offshore centres also rate them less positively than average. This pattern can be seen in the following charts.
Chart 12
Profile of Asian Centres
Global Leaders Global Diversified Global Specialists Global Contenders
Hong Kong Singapore
– – Beijing
Dubai Shanghai
Established Transnational
Transnational Diversified
Transnational Specialists
Transnational Contenders
Established Players Local Diversified Local Nodes Evolving Centres
Tokyo Seoul Bahrain
Shenzhen Taipei
Bangkok Kuala Lumpur
Mumbai
– Osaka Jakarta
Manila Qatar
Riyadh
Average Assessment – Difference from Mean >
Location >
-200 -150 -100 -50 0 50 100
Offshore 23% North America 6% Europe 25% Asia 46%
Mean without region Chart 13
Assessments by Region – Difference from the Mean – Hong Kong
Average Assessment – Difference from Mean >
Location >
-200 -150 -100 -50 0 50 100
Offshore 21% North America 7% Europe 24% Asia 47%
Mean without region Chart 14
Assessments by Region – Difference from the Mean – Singapore
Average Assessment – Difference from Mean >
Location >
-200 -150 -100 -50 0 50 100
Offshore 7% North America 5% Europe 19% Asia 69%
Mean without region Chart 15
Assessments by Region – Difference from the Mean – Shanghai
The GFCI questionnaire asks which centres are likely to become more significant in the next few years. As with GFCI 6, Asia features very strongly and is where respondents expect to observe the most significant improvements in performance, with Seoul entering the top five here:
Average Assessment – Difference from Mean >
Location >
-200 -150 -100 -50 0 50 100
Offshore 7% North America 9% Europe 28% Asia 54%
Mean without region Chart 16
Assessments by Region – Difference from the Mean – Tokyo
Average Assessment – Difference from Mean >
Location >
-200 -150 -100 -50 0 50 100
-335
Offshore 2% North America 1%
Europe 112% Asia 82%
Mean without region Chart 17
Assessments by Region – Difference from the Mean – Shenzhen
Table 8
The Five Centres Believed to be Suffering Most from the Crisis
Financial Centre Number of Mentions since GFCI 6
Shanghai 111
Shenzhen 51
Seoul 35
Beijing 35
GFCI respondents have been predicting the rise to prominence of Shanghai for the past two years. Shanghai and Shenzhen are centres that we will continue to monitor closely.
In past editions of the GFCI, Dubai has been repeatedly mentioned as a centre both likely to become more significant and where new offices will be opened. Here, however, Dubai features in neither category perhaps as a result of its recent, widely reported, financial difficulties.
Table 9
Centres Where New Offices will be Opened
Financial Centre Number of Mentions since GFCI 6
Shanghai 35
Hong Kong 29
Shenzhen 18
Beijing 15
The offshore centres have come under a fair degree of scrutiny during the financial crisis. Many offshore centres are
regarded as ‘tax havens’ and there has been significant pressure applied to these centres by many national regulators as well as international bodies such as the OECD. A key demand of the regulators
has been to increase the transparency of the internationally agreed tax standards. The scores of the offshore centres have generally risen in GFC 7, but not by as much as those of many other centres, while their rankings have, with the exception of the Isle of Man, declined:
Jersey increases its small lead over Guernsey, the two centres having scored within 4 points of each other since GFCI. Jersey is ahead of Guernsey in nine of the ten sub-indices; Guernsey is rated just ahead of Jersey in the Professional Services sub-index. There continues to be significant pressure applied to so-called ‘tax havens’ and the OECD is regularly updating its lists of financial centres that are complying with their requests.
As shown in GFCI 6, there continues to be a strong correlation between GFCI ratings and the OECD status: the offshore centres which are on the OECD ‘White List’, such as the Channel Islands, have higher GFCI ratings, whereas centres such as the Bahamas and Gibraltar (on the OECD ‘Grey List’) are well below the White Listed centres.
Offshore Financial Centres
Table 10
Top Offshore Centres in GFC 7
Centre GFC 7 Rating GFC 7 Rank Change in Rating Change in Rank since GFCI 6 since GFCI 6
Jersey 643 =18 3 -4
Guernsey 632 22 -6 -7
Isle of Man 618 =24 9 0
Cayman Islands 615 =28 7 -2
Hamilton 612 =31 15 -3
British Virgin Islands 596 37 12 -3
Gibraltar 568 53 25 -2
Bahamas 557 59 6 -11
Broad & Deep
Relatively Broad
Relatively Deep
Emerging
Global
Transnational
Local
As might be expected, the offshore centres are profiled as either International Specialists or Local Specialists if their international
connectedness is lower. They are profiled as specialists because of the quality and depth of their asset management sector. For most of the offshore centres, a significant proportion of their assessments are coming from other offshore centres. Jersey and Guernsey are near the border between Global and Transnational and wider global awareness would move them up to the profile of Global Specialists. Both these centres are working to change perceptions and to ‘rise above’ the status of offshore specialist centres by being seen as more diversified, although the following charts of average assessment by region suggest that they still have some way to go with changing global perceptions.
All the top offshore centres achieve higher than average assessments from other offshore centres and generally lower responses from elsewhere, particularly with regard to the
respondents from Asia. Asian responses were particularly low for Jersey and Guernsey; for Jersey the average Asian response was 157 points lower than the mean (515 against 672) and for Guernsey 193 points (470 against 663):
Chart 18
Profile of Offshore Centres
Global Leaders
–
Global Diversified
–
Global Specialists
–
Global Contenders
–
Established Transnational
Transnational Diversified
Transnational Specialists
Transnational Contenders
– – British Virgin Islands
Cayman Islands Gibraltar Guernsey
Hamilton Isle of Man
Jersey
–
Established Players Local Diversified Local Nodes Evolving Centres
– – Bahamas
Malta Mauritius
Average Assessment – Difference from Mean >
Location >
-200 -150 -100 -50 0 50 100
Offshore 59% North America 2% Europe 25% Asia 15%
Mean without region Chart 19
Assessments by Region – Difference from the Mean – Jersey
Average Assessment – Difference from Mean >
Location >
-200 -150 -100 -50 0 50 100
Mean without region (2nd vertical axis) Offshore 61%
North America 2% Europe 24% Asia 13%
Mean without region Chart 20
Assessments by Region – Difference from the Mean – Guernsey
Average Assessment – Difference from Mean >
Location >
-200 -150 -100 -50 0 50 100
Offshore 42% North America 10% Europe 21%
Asia 27%
Mean without region Chart 21
Assessments by Region – Difference from the Mean – Cayman Islands
=15
11
=9 21 =28
=9 8
=18 =18 22
53 =31
=45
33 43 47 35
=41
=41
=63 =24
=24 20
=26 34
36 39
=455 =45 =45=45
50
48
56 49 52
44 51
58
60
66 67
66 61
62
65
68
69 70
71
72
74 73
9 8
8 3 9
8 4
=1 13
7 =28
38
=54
5
3
4
=1 6 12 14 23
=15 17
=63 =26
=28
=31
37
=54 40 57
59
75
Key
Broad & Deep
Global Leaders
Established Transnational
Established Players
Relatively Broad Global Diversified
Transnational Diversified
Local Diversified
Relatively Deep Global Specialists
Transnational Specialists
Local Nodes
Emerging Global Contenders
Transnational Contenders
Table 11
GFC 7 Ratings1
GFC 7 Rank GFC 7 Rating GFCI 6 Rank GFCI 6 Rating Change Change in Rank in Rating
London =1 775 1 790
3
0 -15New York =1 775 2 774
1
1 1Hong Kong 3 739 3 729
3
0 10Singapore 4 733 4 719
3
0 14Tokyo 5 692 7 674
1
2 18Chicago 6 678 8 661
1
2 17Zurich 7 677 6 676
5
-1 1Geneva 8 671 9 660
1
1 11Shenzhen =9 670 5 695
5
-4 -25Sydney =9 670 11 651
1
2 19Shanghai 11 668 10 655
5
-1 13Toronto 12 667 13 647
1
1 20Frankfurt 13 660 12 649
5
-1 11Boston 14 652 17 634
1
3 18Beijing =15 651 23 613
1
8 38San Francisco =15 651 18 634
1
3 17Washington D.C. 17 647 20 630
1
3 17Jersey =18 643 14 640
5
-4 3Luxembourg =18 643 16 637
5
-2 6Paris 20 642 19 630
5
-1 12Taipei 21 638 25 609
1
4 29Guernsey 22 632 15 638
5
-7 -6Vancouver 23 623 29 589
1
6 34Isle of Man =24 618 24 609
3
0 9Dubai =24 618 21 617
5
-3 1Montreal =26 617 32 586
1
6 31Melbourne =26 617 33 584
1
7 33Seoul =28 615 35 576
1
7 39Edinburgh =28 615 27 605
5
-1 10Cayman Islands =28 615 26 608
5
-2 7Dublin =31 612 22 613
5
-9 -1Hamilton =31 612 28 597
5
-3 15Munich 33 610 30 588
5
-3 22Osaka 34 606 38 565
1
4 41Amsterdam 35 604 31 586
5
-4 18Qatar 36 600 44 558
1
8 42British Virgin Islands 37 596 34 584
5
-3 12Stockholm 38 595 36 569
5
-2 26Brussels 39 591 37 568
5
-2 23Sao Paulo 40 590 42 560
1
2 30Copenhagen =41 587 41 560
3
0 27Bahrain =41 587 43 558
1
2 29Vienna 43 583 46 555
1
3 28Wellington 44 582 54 541
1
10 41GFC 7 Rank GFC 7 Rating GFCI 6 Rank GFCI 6 Rating Change Change in Rank in Rating
Oslo =45 581 56 538
1
11 43Milan 47 579 47 554
3
0 25Monaco 48 578 39 563
5
-9 15Rome 49 574 57 537
1
8 37Helsinki 50 573 59 533
1
9 40Kuala Lumpur 51 571 45 557
5
-6 14Glasgow 52 570 49 550
5
-3 20Gibraltar 53 568 51 543
5
-2 25Johannesburg =54 566 50 550
5
-4 16Rio de Janeiro =54 566 61 532
1
7 34Malta 56 565 52 543
5
-4 22Mexico City 57 563 55 541
5
-2 22Mumbai 58 562 53 542
5
-5 20Bahamas 59 557 48 551
5
-11 6Mauritius 60 552 58 536
5
-2 16Bangkok 61 549 60 532
5
-1 17Prague 62 543 65 492
1
3 51Jakarta =63 535 62 511
5
-1 24Buenos Aires =63 535 63 507
3
0 28Lisbon 65 529 66 477
1
1 52Manila 66 527 64 494
5
-2 33Warsaw 67 520 69 456
1
2 64Moscow 68 516 67 462
5
-1 54Riyadh 69 507 68 457
5
-1 50St. Petersburg 70 501 70 453
3
0 48Tallinn 71 488 71 445
3
0 43Budapest 72 481 74 425
1
2 56Athens 73 480 73 433
3
0 47Istanbul 74 470 72 442
5
-2 28Reykjavik 75 447 75 415
3
0 321Note: Scores have been rounded to the nearest whole number. Where centres have tied, this is given as an equal ranking and they are listed in order according to their underlying scores,
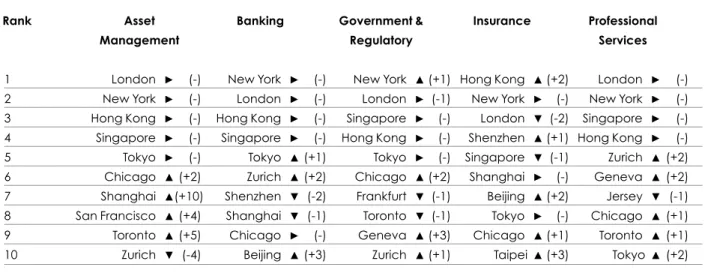
The GFC 7 dataset can be used to produce separate industry sector sub-indices for the Banking, Asset
Management, Insurance, Professional Services and Government & Regulatory sectors. These indices are created by building the GFC 7 statistical model using only the questionnaire responses from respondents working in the relevant industry sectors. For the first time, Hong Kong appears at the top of one of the sub-indices, rating highest amongst
professionals in the Insurance sector. Conversely, London’s position at number three in the same index is the first time
London has been outside of the top two places in any sub-index. London remains at the top in the Asset Management and Professional Services sub-indices, whilst New York retains the lead for the Banking sub-index, and has re-taken first place in the Government & Regulatory field, seen previously in GFCI 4.
Table 12 shows the top 10 ranked financial centres in the industry sector sub-indices. The figures in brackets show how each centre has moved in these sub-indices since GFCI 6:
1 London
3
(-) New York3
(-) New York1
(+1) Hong Kong1
(+2) London3
(-) 2 New York3
(-) London3
(-) London3
(-1) New York3
(-) New York3
(-) 3 Hong Kong3
(-) Hong Kong3
(-) Singapore3
(-) London5
(-2) Singapore3
(-) 4 Singapore3
(-) Singapore3
(-) Hong Kong3
(-) Shenzhen1
(+1) Hong Kong3
(-) 5 Tokyo3
(-) Tokyo1
(+1) Tokyo3
(-) Singapore5
(-1) Zurich1
(+2) 6 Chicago1
(+2) Zurich1
(+2) Chicago1
(+2) Shanghai3
(-) Geneva1
(+2) 7 Shanghai1
(+10) Shenzhen5
(-2) Frankfurt5
(-1) Beijing1
(+2) Jersey5
(-1) 8 San Francisco1
(+4) Shanghai5
(-1) Toronto5
(-1) Tokyo3
(-) Chicago1
(+1) 9 Toronto1
(+5) Chicago3
(-) Geneva1
(+3) Chicago1
(+1) Toronto1
(+1) 10 Zurich5
(-4) Beijing1
(+3) Zurich1
(+1) Taipei1
(+3) Tokyo1
(+2)Asset Management
Banking Government & Regulatory
Insurance Professional Services
Table 12
Industry Sector Sub-indices (Changes from GFCI 6 in brackets)
Rank
The top five positions in each of the sub-indices are generally occupied by the five top GFC 7 centres. Shenzhen’s 4th position in the ratings from the Insurance sector respondents and Zurich’s 5th in the
Professional Services sub-index are the only exceptions. The Asian centres have tended to perform well in the Insurance sub-index both in GFCI 6 and here, with seven of the top ten spots filled by Asian centres. Asian centres have also performed well in the Banking sub-index, filling six of the top ten places, with Beijing entering the top ten for the first time.
Toronto performs strongly in these
sub-indices, entering the top ten in the Asset Management sub-index for the first time, and appearing in the top ten for three categories in total, while placing 12th in the overall GFC 7. Shanghai and San Francisco have also made significant improvements in the Asset Management sub-index, rising 10 and 4 places respectively.
The Professional Services area remains largely unchanged from GFCI 6. The Swiss centres of Zurich and Geneva move into 5th and 6th positions respectively, with Guernsey (5th in GFCI 6) moving out of the top ten. Zurich and Geneva have also climbed into the top ten of the Government & Regulatory sub-index, replacing Paris and Sydney.
The instrumental factors used in the GFC 7 model are grouped into five key areas of competitiveness (People, Business Environment, Market Access, Infrastructure and General
Competitiveness). The GFC 7 factor assessment model is run with one set of instrumental factors at a time and the
results are compared to identify which factors have the greatest influence on which centres. Table 13 shows the top ten ranked centres in each sub-index (the figures in brackets show how the centre has moved in the sub-index rankings compared with GFCI 6):
London, which has led the field across these aspects for previous editions of GFCI, has here been overtaken by New York in three areas of competitiveness: People, Business Environment, and Infrastructure. Hong Kong and Singapore remain in 3rd and 4th place throughout although Singapore moves ahead of Hong Kong into 3rd place in the People sub-index.
Most of the sub-indices are fairly closely correlated to the main GFC 7 ranks. Shanghai, 11th in the overall rankings, has here climbed into the top 10 in all but one of the areas (Business Environment) and has made substantial gains since GFCI 6. Toronto, 12th overall, makes three appearances in the top ten here. Shenzhen, 9th overall, reveals significant differences in performance across the areas of competitiveness. Shenzhen has gained nine places to enter the top ten in
the General Competitiveness category, but does not feature in the top ten for the other sub-indices, ranking 12th in the People sub-index, 13th in Business Environment, 17th in Market Access and 20th in Infrastructure, all of which are substantial improvements on GFCI 6; this suggests that its ratings are volatile and susceptible to changes in instrumental factors.
The Five Key Areas of Competitiveness
1 New York
1
(+1) New York1
(+1) London3
(-) New York1
(+1) London3
(-) 2 London5
(-1) London5
(-1) New York3
(-) London5
(-1) New York3
(-) 3 Singapore1
(+1) Hong Kong3
(-) Hong Kong3
(-) Hong Kong3
(-)Hong Kong3
(-) 4 Hong Kong5
(-1) Singapore3
(-) Singapore3
(-) Singapore3
(-) Singapore3
(-) 5 Tokyo3
(-) Chicago3
(-) Tokyo1
(+2) Chicago1
(+2) Tokyo1
(+2) 6 Toronto1
(+3) Tokyo1
(+3) Zurich3
(-) Tokyo5
(-1) Zurich3
(-) 7 Chicago1
(+3) Zurich5
(-1) Shanghai1
(+19) Zurich5
(-1) Chicago5
(-2) 8 Sydney5
(-2) Sydney3
(-) Chicago5
(-3) Sydney1
(+3) Shanghai1
(+12) 9 Zurich5
(-2) Geneva5
(-2) Geneva1
(+1) Toronto1
(+3) Geneva5
(-1) 10 Shanghai1
(+7) Toronto1
(+5) Frankfurt5
(-2) Shanghai1
(+23) Shenzhen1
(+9)Rank People Business
Environment
Market Access Infrastructure General Competitiveness
Table 13
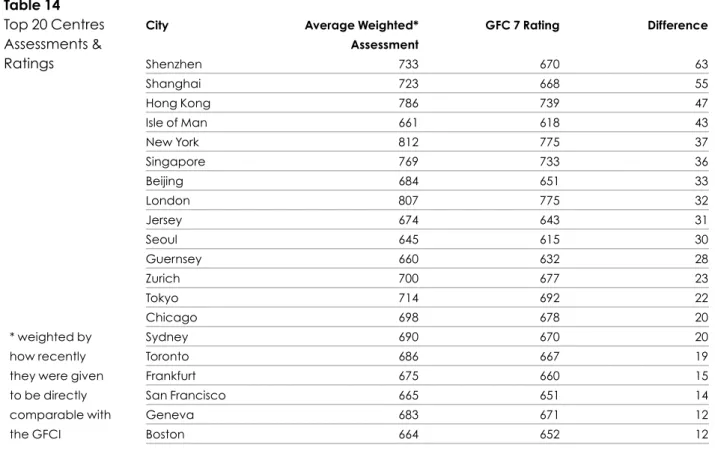
The reputation of a financial centre is another indicator of potential success. In the GFCI model, one way to look at this is to examine the difference between the average assessment given to a centre and its overall rating (the average assessment adjusted to reflect the instrumental factors). If a centre has a
higher average assessment than the GFC 7 rating this indicates that
respondents’ perceptions of a centre are more favourable than the quantitative data-based measures alone would suggest. Table 14 shows the 20 centres with the highest difference between average assessment and GFCI rating:
It is notable that six of the top ten centres by this measure are Asian. This would help explain the strong performance of Asia in GFC 7. However, it should be stressed that in the case of Beijing, Shanghai and Shenzhen, a large number of favourable assessments came from other Asian centres rather than from a ‘worldwide’ financial services community. Three of the top 11 centres by this measure are offshore centres – although similarly, a sizeable proportion of their assessments come from other offshore centres.
Table 14
Top 20 Centres Assessments & Ratings
City Average Weighted* GFC 7 Rating Difference Assessment
Shenzhen 733 670 63
Shanghai 723 668 55
Hong Kong 786 739 47
Isle of Man 661 618 43
New York 812 775 37
Singapore 769 733 36
Beijing 684 651 33
London 807 775 32
Jersey 674 643 31
Seoul 645 615 30
Guernsey 660 632 28
Zurich 700 677 23
Tokyo 714 692 22
Chicago 698 678 20
Sydney 690 670 20
Toronto 686 667 19
Frankfurt 675 660 15
San Francisco 665 651 14
Geneva 683 671 12
Boston 664 652 12
* weighted by how recently they were given to be directly comparable with the GFCI
This edition of GFC has adopted a new approach to investigating the
competitiveness of different centres, combining the well-established ratings system with a new set of profiles that look at how well connected different centres are, and the breadth and depth of the financial services that they provide. This has enabled a more sophisticated discussion of the underpinnings of competitiveness for different types of centres, particularly important in a global financial environment that continues to be extremely volatile.
Overall, of the 75 centres rated in GFC 7, 71 centres have received higher scores and only four have decreased since the last report. GFCI 6 demonstrated that whilst the financial crisis had created uncertainty and a significant reduction in confidence, the assessments had begun to recover. GFC 7 demonstrates a more robust return of confidence.
For the first time in the GFCI, London and New York are equal first, both with 775 points on a scale of 1 to 1,000. In GFCI 6, London was 16 points ahead but experienced a fall of 15 points in the current ratings. This shift is also reflected by changes in position in the sub-indices, with New York leading the field amongst the Banking and Government &
Regulatory respondents, and London dropping to third in the ratings from the Insurance respondents. New York has also overtaken London in three of the sub-indices of areas of competitiveness: People, Business Environment and Infrastructure.
London and New York still lead the ratings, although the gap between them and the third placed centre, Hong Kong, continues to diminish, from 81 points a year ago and 45 points six months ago to just 36 points now. With Singapore, in fourth place by a mere six points, these four centres continue to show stable long term competitiveness as world-leading in the rankings.
The profiles approach used in this report offers another way to classify centres, with centres being assigned to a profile on the basis of their connectivity, and depth and breadth of financial services based there. Here, eight centres are considered to be global leaders: London, New York, Hong Kong and Singapore, as in the ratings, and also Chicago, Zurich, Toronto and Frankfurt. This approach also allows a more sophisticated look at both leading and emerging centres than possible from the ratings alone. Tokyo, for example, (fifth overall) showing a strong performance in terms of its services but with the potential to benefit from improving its connections globally, and emerging centres such as Shanghai, Beijing, Dubai and Moscow showing that they have the connectivity to succeed but lack the necessary specific sectoral strengths to fulfill their potential as yet. A notable story in GFCI 6 was the rise of the Asian centres, with all of them showing a marked increase in scores. This strong performance has continued in GFC 7, with all centres apart from Shenzhen showing a further increase in scores. Particularly notable are the rise of Tokyo into fifth place and the substantial points increases for Beijing and Seoul. Whilst Shenzhen has fallen by 25 points, it remains in the top ten, in 9th place, although lacking the connectivity that puts Beijing and Shanghai in the ‘global’ set of profiles.
The GFCI questionnaire asks respondents which financial centres they believe are suffering most as a result of the current financial crisis: the responses indicate that New York, London and Dubai are perceived to have been impacted on the most, with 110, 89 and 51 mentions respectively.
The main concerns voiced about New York were with regard to the potential for new regulatory arrangements to be damaging to competitiveness. London’s greatest
challenges were likewise perceived to be the fear of a regulatory backlash and the levels of corporate and personal taxation that may drive high earners abroad. The loss of skilled personnel to the industry is a concern of respondents in all the leading centres and the most commonly
identified risks posed by the financial crisis in general are a regulatory ‘kneejerk’ reaction, followed by credit risk and then a more general recession.
Clearly the Business Environment is viewed as the key area of
competitiveness - it is mentioned in responses more often than People and Infrastructure combined. This is a reflection of the regulatory reaction to the financial crisis but also reflects concerns over taxation. One of the themes that emerges from the
respondents is the need for predictability and stability of regulation.
The GFCI has previously highlighted the need for centres to be connected and co-operative; this is more important than ever in times of great uncertainty and financial instability. The new profiles approach adopted in this edition reflects the importance of this, and allows for new dimensions of competitiveness to be considered as part of the global financial infrastructure.
Respondent’s Details
Table 15
Respondents by Industry Sector
Sector Number and % of Responses
Banking 502 29.7%
Asset Management 292 17.3%
Insurance 311 18.4%
Professional Services 186 11.0%
Regulatory & Government 85 5.0%
Other 314 18.6%
TOTAL 1,690 100.0%
Table 16
Respondents by Size of Organisation
Number of Employees Worldwide Number and % of Responses
Fewer than 100 436 25.8%
100 to 500 229 13.6%
500 to 1,000 127 7.5%
1,000 to 2,000 96 5.7%
2,000 to 5,000 166 9.8%
More than 5,000 534 31.6%
Unspecified 102 6.0%
TOTAL 1,690 100.0%
Table 17
Respondents by Location
Location Total Number and % of Responses Number and % of New Responses
Europe 521 31% 78 15%
North America 133 8% 24 5%
Asia 578 34% 226 45%
Offshore 449 27% 178 35%
Multiple or Other 9 1% 1 0%
Table 18 shows how closely instrumental factor rankings correlate with the GFC 7 rankings for the top 20 instrumental factors:
Table 18
Top 20 Instrumental Factors by correlation with GFCI 7
Instrumental Factor R2with GFCI 7
Lifestyle Assets 0.685
Mastercard Centres of Commerce Index 0.595
World Competitiveness Scoreboard 0.526
Global Competitiveness Index 0.480
Intellectual Capital 0.442
RPI (% change on year ago) 0.393
Credit Ratings 0.379
City Brands Index 0.371
Capital Access Index 0.360
Quality of Roads 0.351
Banking Industry Country Risk Assessments 0.350
Global Cities Index 0.346
JLL Direct Real Estate Transaction Volumes 0.342
Business Environment 0.316
Capitalisation of Stock Exchanges 0.315
The Access Opportunities Index - Business 0.307
The World’s Most Innovative Countries 0.306
Economic Freedom of the World 0.282
Number of International Fairs and Exhibitions 0.277
Airport Satisfaction 0.261
It is interesting to see that the broader measures of competitiveness seem to act as good indicators for financial centre competitiveness. The ten most highly correlated instrumental factors are all broad measures of competitiveness rather than being specific to financial services.
This indicates that cities that are successful at most things are likely to be very
competitive financial centres. A full list of instrumental factors is shown opposite, with 1meaning that the factor has been
Table 19
Instrumental Factors
Instrumental Factor Source Website
People
Intellectual Capital Price Waterhouse Coopers http://www.pwc.com/extweb/pwcpublications.nsf Graduates in Social Science
Business and Law World Bank www.worldbank.org/education Gross Tertiary Education Ratio World Bank www.worldbank.org/education
Visa Restrictions Index Henley & Partners http://www.henleyglobal.com/citizenship/visa-restrictions/
1Human Development Index UN Development Programme http://hdr.undp.org Quality of Living Survey Mercer HR www.mercerhr.com
Personal Safety Index Mercer HR www.mercerhr.com
International Crime Victims Survey UN Office of Drugs and Crime http://rechten.uvt.nl/icvs/news.htm#The_2009_ICVS Lifestyle Assets Price Waterhouse Cooper http://www.pwc.com/extweb/pwcpublications.nsf World’s Top Tourism Destinations Euromonitor Archive www.euromonitor.org
Number of World Heritage Sites World Economic Forum http://www.weforum.org/en/initiatives/ gcp/TravelandTourismReport Average Days with Precipitation
per Year Sperling’s BestPlaces www.bestplaces.net
Business environment
1Business Environment EIU www.economist.com/markets/rankings
1Ease of Doing Business Index The World Bank www.doingbusiness.org/economyrankings
1Operational Risk Rating EIU
Global Services Location Index AT Kearney www.atkearney.com
Opacity Index Milken Institute www.milkeninstitute.org/publications
1Corruption Perceptions Index Transparency International www.transparency.org/publications
1Wage Comparison Index UBS www.ubs.com
Corporate Tax Rates Price Waterhouse Coopers n/a Employee Effective Tax Rates Price Waterhouse Coopers n/a
Personal Tax Rates OECD www.oecd.org
1Total Tax Receipts (as % of GDP) OECD http://oberon.sourceoecd.org
1Bilateral Tax Information
Exchange Agreements OECD http://www.oecd.org
Index of Economic Freedom Heritage Foundation www.heritage.org/index/countries.cfm
1Economic Freedom of the World Fraser Institute www.freetheworld.com/release.html
1Banking Industry Country
Risk Assessments Standard & Poor http://www2.standardandpoors.com Political Risk Index Exclusive Analysis Ltd http://www.exclusive-analysis.com/