Immigrant Entrepreneurs and
Small Business Owners, and their
Access to Financial Capital
by
Robert W. Fairlie, Ph.D.
Economic Consulting
Santa Cruz, CA 95060
for
Under contract no.
SBAHQ-10-R-0009
Release Date:
May 2012
The statements, findings, conclusions, and recommendations found in this study are those of the authors and do not necessarily reflect the views of the Office of Advocacy, the United
Table of Contents
Executive Summary ……….………. ii
1. Introduction ……….……….. 1
2. The State of Immigrant Business Ownership in the United States ….………... 4
New Estimates of Immigrant Business Performance ……….………..…. 8
Exports ……….…………..…. 12
3. Financial Capital ……….………... 14
Previous Research on Capital and Business Performance ………14
Capital Use among Immigrant-owned Businesses ……….. 16
Industry Composition ……….. 18
Types of Financing ……….…. 21
4. Home Ownership and Entrepreneurship ………. 23
Recent Trends and the Great Recession ………..… 31
5. Conclusions ………. 37
References ………... 41
Executive Summary
Immigrant business owners make important contributions to the U.S. economy. Although recent research documents these contributions of immigrant entrepreneurs to the U.S. economy less attention has been drawn to the advantages and disadvantages that immigrant entrepreneurs face in creating and maintaining successful businesses. A better understanding of the constraints faced by immigrant entrepreneurs may shed light on whether there is untapped potential for this group and whether their contributions to the U.S. economy can be even greater. One area in which knowledge is especially lacking is access to and use of financial capital among immigrant entrepreneurs. The main reason for the lack of research on access to financial capital among immigrant entrepreneurs is data availability.
For the first time in a decade and a half the U.S. Census Bureau collected information on immigrant business owners in the 2007 Survey of Business Owners. Specially commissioned tabulations from these data as well as the most up-to-date data on business ownership patterns from the 2010 Current Population Survey are used to conduct a comprehensive analysis of access to financial capital among businesses owned by immigrants. The key findings from this analysis of immigrant-owned businesses are:
1. The business ownership rate is higher for immigrants than non-immigrants -- 10.5 percent of the immigrant work force owns a business compared with 9.3 percent of the non-immigrant (i.e. U.S.-born) work force.
2. Business formation rates are even higher among immigrants than the non-immigrant. The business formation rate per month among immigrants is 0.62 percent (or 620 out of 100,000). This monthly rate of business formation is much higher than the non-immigrant rate of 0.28 percent (or 280 of 100,000).
3. Immigrant-owned firms have $435,000 in average annual sales and receipts, which is roughly 70 percent of the level of non-immigrant owned firms at $609,000. Examining the full distribution of sales reveals that 11.4 percent of
immigrant firms have sales of $500,000 or more, which is similar to the percentage of non-immigrant firms at this level.
4. Immigrant-owned businesses are slightly more likely to hire employees than are non-immigrant owned businesses, however, they tend to hire fewer employees on average. Among immigrant owned businesses that hire employees these firms hire an average of 8.0 employees with an average payroll of $253,000. Employer firms owned by non-immigrants hire an average of 11.9 employees with an average payroll of $429,000.
5. Hispanic immigrant owned businesses have an average sales level of $257,000 compared with $465,000 for Asian immigrant owned businesses. Asian
immigrant owned firms are more likely to hire employees than Hispanic
immigrant owned firms (36 percent compared with 20 percent), but have roughly similar levels of employment and payroll conditioning among employer firms. 6. Immigrant owned businesses are more likely to export their goods and services
than are non-immigrant owned businesses. Among immigrant firms, 7.1 percent export compared with only 4.4 percent of non-immigrant firms, and immigrant firms are more likely to have high shares of exports.
7. Immigrant owned businesses start with higher levels of startup capital than non-immigrant owned businesses. Nearly 20 percent of non-immigrant owned firms started with $50,000 or more in financial capital compared with 15.9 percent of non-immigrant owned firms. Hispanic non-immigrant firms have lower levels of startup capital than the immigrant total and Asian immigrant firms have higher levels of startup capital.
8. Industry concentrations do not differ substantially between immigrant-owned businesses and non-immigrant owned businesses. Although startup capital requirements differ substantially across industries, the lack of differences in industry concentrations between immigrant and non-immigrant businesses
indicates that these differences do not contribute to differences in levels of startup capital.
9. The most common source of startup capital for immigrant-owned businesses is personal or family savings with roughly two-thirds of businesses reporting this source of startup capital. Other common sources of startup capital used by
immigrant firms are credit cards, bank loans, personal or family assets, and home equity loans. The sources of startup capital used by immigrant firms do not differ substantially from those used by non-immigrant firms.
10.The most commonly reported source of capital used to finance expansions among immigrant owned businesses is personal and family savings followed by credit cards and business profits and assets. These sources are similar to those used by non-immigrant owned businesses.
11.For all individuals, home ownership is an important determinant of business formation because home equity can be invested directly in the business or used as collateral to obtain business loans. Home owners are found to be roughly 10 percent more likely to start businesses than are non-home owners even after controlling for other factors such as education, family income, and initial employment status.
12.The latest available data on home ownership patterns indicates that immigrants have substantially lower rates of home ownership than the non-immigrant. Among immigrants 52.1 percent own a home compared with 70.8 percent of non-immigrants. Given low rates of home ownership, business formation among immigrants could be even higher if they had rates of home ownership more similar to the non-immigrant.
13.Business formation among immigrants follows the same general time-series pattern as the national rate – rising in recessions and declining in strong economic growth periods. But, in the Great Recession there appears to be an even greater response of starting businesses among immigrants than among non-immigrants, which may be due to fewer labor market opportunities.
14.The impact of home ownership on business formation weakened considerably in the Great Recession lessening the impact of the advantage of higher home ownership rates among non-immigrants on business formation.
Immigrant-owned businesses contribute greatly to the U.S. economy. Immigrants have high business formation rates, and many of the businesses they create are very successful, hire employees, and export goods and services to other countries. Insuring sufficient access to financial capital is important for the continued contribution of immigrant-owned businesses to economic growth, job creation, innovation and exports.
1. Introduction
Immigrant business owners make important contributions to the U.S. economy. Immigrant entrepreneurs start 17 percent of all new businesses in the United States and represent 13 percent of all business owners (Fairlie 2008). Of total business income in the United States, 12 percent is generated by immigrant business owners. Immigrants are found to contribute even more to specific sectors and regions of the U.S. economy
(Fairlie 2008). In particular, much recent attention has been drawn to the contributions of immigrant entrepreneurs to the technology and engineering sectors of the economy. Twenty-five percent of engineering and technology companies started in the past decade were founded by immigrants (Wadwha, et al. 2007). These firms had $52 billion in sales and hired 450,000 workers in 2005 in the United States. Previous research also indicates that immigrant entrepreneurs have made important contributions to high-tech areas such as Silicon Valley (Saxenian 1999, 2000). Engineers from China and India run roughly one quarter of all technology businesses started in Silicon Valley. Immigration is also found to increase innovation measured as patents and even have positive spillovers in innovation for others (Hunt and Gauthier-Loiselle 2010, Kerr and Lincoln 2010).
Although recent research documents the contributions of immigrant entrepreneurs to the U.S. economy less attention has been drawn to the advantages and disadvantages that immigrant entrepreneurs face in creating and maintaining successful businesses. A better understanding of the constraints faced by immigrant entrepreneurs may shed light on whether there is untapped potential for this group and whether their contributions to the U.S. economy can be even greater. Furthermore, identifying potential barriers to
financial capital access for any group of small business owners is extremely important for avoiding losses in economic productivity.
One area in which knowledge is especially lacking is access to and use of financial capital among immigrant entrepreneurs. Anecdotal evidence suggests that immigrant entrepreneurs rely heavily on informal sources to finance their businesses instead of banks or other institutions, but there is little direct evidence from nationally representative datasets carefully documenting these patterns. An exception is provided by Census data suggesting that there may be significant leveraging of personal wealth by immigrant entrepreneurs. Estimates from the 1992 Characteristics of Business Owners (CBO) indicate that Asian-immigrant businesses have substantially higher levels of startup capital than non-Latino white owned businesses, but comparisons of overall personal wealth indicate similar levels between non-Latino whites and Asians (Fairlie and Robb 2008). The use of rotating credit associations among some immigrant groups has been argued to be important in financing immigrant businesses, but perhaps an equal number of studies suggest that they play only a minor role (see Light, Kwuon, and Zhong 1990, Yoon 1991, Bates 1997 for example).
The main reason for the lack of research on access to financial capital among immigrant entrepreneurs is data availability. One of the major sources of data for examining the use of and barriers to obtaining financial capital in the previous literature is the Survey of Small Business Finances (SSBF). The SSBF, however, does not include information on immigrant status. Datasets with large enough sample sizes and
information on immigrant status typically do not provide information on financial capital. This study uses a newly available dataset that includes information on both immigrant
status and on the sources and levels of financial capital use -- the 2007 Survey of
Business Owners (SBO). For the first time since 1992, the U.S. Census Bureau collected information on whether business owners are immigrants and the amount of startup capital used by the business as part of its main business owner data collection effort. These data, as well as data from the 1996-2010 Current Population Surveys (CPS), are used to
conduct a comprehensive analysis of access to financial capital among immigrant
entrepreneurs using the most-recently available data on immigration, business formation, and financial capital.
In contrast to the lack of research on access to financial capital among immigrant entrepreneurs, a very large literature examines the impact of financial capital on small business formation and performance more broadly. The literature indicates that access to financial capital is one of the most important determinants of small business creation and success.1 Additionally, many previous studies have explored the barriers that
disadvantaged minorities face in obtaining access to capital for their businesses. These studies find that access to capital, wealth inequality, and lending discrimination represent substantial barriers to minority business success.2
Building on the findings from this literature, the study examines several key questions regarding access to financial capital among small businesses owned by immigrants. First, what do the latest estimates show regarding business ownership,
1
Earlier studies include Evans and Jovanovic (1989), Evans and Leighton (1989), and Meyer (1990). See also Holtz-Eakin, Joulfaian, and Rosen (1994), Lindh and Ohlsson (1996), Black, de Meza and Jeffreys (1996), Blanchflower and Oswald (1998), Dunn and Holtz-Eakin (2000), Fairlie (1999), Johansson (2000), Taylor (2001), Holtz-Eakin and Rosen (2004), and Fairlie and Krashinsky (2008).
2
See Bates (1997), Cavalluzzo, Cavalluzzo, and Wolken (2002), Cavalluzzo and Wolken (2005), Blanchard, Yinger and Zhao (2004), Blanchflower, Levine, and Zimmerman (2003), Bostic and Lampani (1999), Mitchell and Pearce (2004), Fairlie and Robb (2008), Fairlie and Woodruff (2009), and Lofstrom and Wang (2008).
creation and performance among immigrants? Are immigrant businesses more successful than non-immigrant (i.e. Non-immigrant) businesses or are they less successful on
average? Second, do immigrant entrepreneurs have access to less or more startup capital than non-immigrant entrepreneurs? Are these levels of startup capital related to the industry concentrations of businesses? Third, what are the sources of financial capital used by immigrant business owners? Do these sources differ from those used by non-immigrant business owners, especially from informal sources compared with bank loans and other more formal sources?
The single largest asset held by most households is equity in their home which can be invested directly into business starts or used as collateral to obtain business loans. A fourth key question examined by this study is whether immigrants and non-immigrants differ in rates of home ownership and whether these differences have any impact on differences in rates of business formation. The effects of the recession starting in December 2007 on immigrant entrepreneurship and home ownership are also explored. The U.S. Economy lost more than 8 million jobs in this recession, and the rate of businesses filing for bankruptcies in the United States increased by more than 150 percent from the rate in mid-2007 (U.S. Courts 2010). Have home ownership rates and business formation rates been affected by the so-called "Great Recession?" Immigrant entrepreneurs may have been hit especially hard by the current financial crisis and recession because they face barriers to entry, growth and survival even in more favorable economic conditions.
2. The State of Immigrant Business Ownership in the United States
This section lays out the facts about business ownership and performance among immigrants. New estimates of immigrant patterns of business ownership rates are created from the most recently available microdata. The goal is to paint a detailed picture of the state of immigrant business in the United States based on estimates from the most widely used and respected sources of government data. Estimates of business ownership and outcomes from these sources that are presented here are generated from special
tabulations of confidential data, public-release microdata, and published sources from the U.S. Census Bureau and Bureau of Labor Statistics.
To examine current levels and trends in business ownership patterns by immigrant status, I use microdata from 2010 Current Population Survey (CPS).3 The CPS provides the most up-to-date estimates of the rate of business ownership in the United States. Table 1 displays estimates of self-employed business ownership rates in 2010 for immigrants and non-immigrants. The self-employed business ownership rate is the ratio of the number of self-employed business owners to the total number of workers.
Business ownership in the CPS captures ownership of all types of businesses including incorporated, unincorporated, employer and non-employer businesses. The estimates indicate that business ownership rates are higher for immigrants than non-immigrants. Indeed, 10.5 percent of the immigrant work force owns a business, compared with 9.3 percent of the non-immigrant work force. This finding is consistent with the previous literature that documents higher business ownership rates among immigrants (see Schuetze and Antecol, 2006 for example). The difference in business ownership rates of
3
1.2 percentage points implies that immigrants are more than 10 percent more likely to own a business than are non-immigrants.
The business ownership rate captures the stock of business owners in the
economy at a given point in time, but does not capture the dynamics of business creation. It is useful to examine business formation among immigrants because it captures the startup potential of this group. New businesses are often associated with economic growth, innovation, and the creation of jobs. To investigate, the rate of business
formation for immigrants is estimated and compared to non-immigrants. For the analysis of business formation, panel data are needed. The matched CPS microdata, offering both panel data and very large sample sizes, constitute the largest dataset in which business formation by immigrants can be examined.
Table 2 displays estimates of business formation rates for 2010. Immigrants are found to create businesses at a faster rate than the non-immigrants. The business formation rate per month among immigrants is 0.62 percent; that is, of 100,000
non-Table 1: Business Ownership Rates by Immigrant Status Current Population Survey (2010)
Percent of
Workforce Sample Size Total 9.5% 636,401 Immigrant 10.5% 90,086 Non-Immigrant 9.3% 546,315 Notes: (1) The sample consists of individuals ages 20-64 who work 15 or more hours per usual week. (2) All estimates are calculated using sample weights provided by the CPS.
business-owning immigrants, 620 start a business each month. This rate of business formation is much higher than the non-immigrant rate of 0.28 percent, or 280 of 100,000 U.S.-born non-business owners per month. Although higher rates of business ownership have been documented extensively in the previous literature, the finding of substantially higher immigrant-owned business formation rates is a relatively new and important finding. Combined with the previous finding of slightly higher business ownership rates among immigrants relative to nonimmigrants, it indicates that immigrants move into and out of business ownership at a much higher rate than non-immigrants.4
Percent of Non-Business
Owners Sample Size Total 0.34% 593,271 Immigrant 0.62% 82,640 Non-Immigrant 0.28% 510,631
Table 2: Business Formation Rates by Immigrant Status Current Population Survey (2010)
Notes: (1) The sample consists of individuals ages 20-64 who do not own a business in the first survey month. (2) The business formation rate is the percent of non business owners that start a business in the following month with 15 or more hours worked. (3) All observations with allocated labor force status, class of worker, and hours worked variables are excluded. (2) All estimates are calculated using sample weights provided by the CPS.
4
Conditional on two groups having similar business ownership rates, the only way that one group can have a higher business entry rate is if it also has a higher business exit rate (see Fairlie, 2006, and Fairlie and Robb, 2008, for more discussion).
NEW ESTIMATES OF IMMIGRANT BUSINESS PERFORMANCE
The performance of businesses started by immigrants is examined next. Estimates of business outcomes are taken from the newly released 2007 Survey of Business Owners (SBO). The SBO is considered the most up-to-date, comprehensive dataset on minority businesses. The Data Appendix includes a more detailed discussion of these data.
For the first time since the 1992 Characteristics of Business Owners (CBO), the U.S. Census Bureau collected information in 2007 on the immigrant status of business owners in its main database collecting information on the ownership characteristics of U.S. businesses – the Survey of Business Owners. The 2007 SBO includes information on whether the business owner is an immigrant which is determined by whether the owner is foreign-born vs. non-immigrant. Following the convention used by the Census Bureau in reporting business statistics by race, immigrant-owned businesses are defined as those with majority foreign-born ownership (51% or more). Similarly, non-immigrant businesses are defined as those with majority U.S.-born ownership (51% or more). The 2007 SBO also includes information on the sales and employment of the business. Unfortunately, however, more detailed information on business outcomes such as sales and employment information were not released in publicly available reports by foreign-born status. Instead, for this report, I commissioned the U.S. Census Bureau to conduct special runs using the 2007 SBO that provide information on the sales and employment of immigrant-owned businesses.
Table 3 reports estimates from specially commissioned tabulations from the 2007 SBO for the average sales and employment of immigrant and non-immigrant owned businesses. Immigrant owned businesses represent 13.2 percent of all businesses in which
foreign born status of the owners can be determined.5 Immigrant-owned firms have $434,000 in average annual sales and receipts. The average level of sales is roughly 70 percent of the level of non-immigrant owned firms at $610,000.6 Immigrant-owned businesses are slightly more likely to hire any employees than are non-immigrant owned businesses, however, they tend to hire fewer employees on average. Among immigrant owned businesses that hire employees these firms hire an average of 8.0 employees with an average payroll of $253,000. Non-immigrant owned businesses that hire employees hire an average of 11.9 employees with an average payroll of $429,000.
There are interesting differences by race and ethnicity for immigrant-owned businesses. Hispanic immigrant-owned businesses have an average sales level of $257,000 compared with $465,000 for Asian immigrant-owned businesses.7 Asian
5
Firms that are equally foreign and U.S.-born owned represent 1.8 percent of all firms in which the foreign born status of the owners can be determined.
6
Firms that are equally foreign and U.S.-born owned have a similar level of average sales as firms that are majority foreign owned ($421,000). Firms with an indeterminate foreign owned status have lower average sales at $238,000.
7
The major groups comprising the Asian category in the SBO are Asian Indian, Chinese, Filipino, Japanese, Korean and Vietnamese.
Ownership Average Sales
Percent Hiring Employees
Average Number of Employees
Average Payroll
All firms $1,108,464 21.2% 20.5 $840,862
Immigrant (majority foreign-born) $433,592 27.9% 8.0 $252,758
Non-immigrant (majority native-born) $608,703 26.3% 11.9 $428,546
Hispanic immigrant $257,416 19.8% 7.2 $198,404
Asian immigrant $465,296 36.0% 7.0 $200,530
Table 3: Average Sales, Employment and Payroll for Immigrant and Non-Immigrant Owned Firms Special Tabulations from Survey of Business Owners (2007)
Employer Firms
immigrant-owned firms are more likely to hire employees than Hispanic immigrant owned firms (36 percent compared with 20 percent), but have roughly similar levels of employment and payroll conditioning on being an employer firm. On average, businesses owned by Hispanic immigrants are smaller than businesses owned by Asian immigrants.
Average sales levels can be influenced heavily by a few outliers of very successful firms and may be misleading of the more common performance levels of immigrant-owned firms. To address this concern, Table 4 reports estimates for the entire sales distribution for immigrant and non-immigrant firms from specially commissioned tabulations from the U.S. Census Bureau. The sales distributions reveal some interesting differences between immigrant and non-immigrant firms. Immigrant firms are less likely to have very low levels of sales and are more likely to be in the middle of the sales distributions. Immigrant firms are slightly less likely to have sales at the very high end of the distribution defined as $1,000,000 or more, but are slightly more likely to have sales in the $500,000 to $999,999 range than non-immigrant firms. Overall, 11.4 percent of immigrant firms have sales of $500,000 or more, which is similar to the percentage of non-immigrant firms at this level.
Table 4: Sales Distributions for Immigrant and Non-Immigrant Owned Firms Special Tabulations from the Survey of Business Owners (2007)
Non- Hispanic Asian All Firms Immigrant Immigrant Immigrant Immigrant Firms with sales/receipts of less than $5,000 20.6% 13.0% 18.4% 13.5% 11.7% Firms with sales/receipts of $5,000 to $9,999 13.7% 11.5% 11.6% 14.0% 9.8% Firms with sales/receipts of $10,000 to $24,999 18.8% 18.3% 16.4% 22.7% 16.0% Firms with sales/receipts of $25,000 to $49,999 12.1% 13.2% 12.3% 14.0% 11.6% Firms with sales/receipts of $50,000 to $99,999 9.9% 11.8% 11.0% 11.8% 12.4% Firms with sales/receipts of $100,000 to $249,999 10.2% 13.2% 11.8% 11.2% 15.4% Firms with sales/receipts of $250,000 to $499,999 5.5% 7.5% 6.7% 5.5% 9.4% Firms with sales/receipts of $500,000 to $999,999 4.0% 5.4% 5.0% 3.8% 6.6% Firms with sales/receipts of $1,000,000 or more 5.2% 6.0% 6.8% 3.6% 7.1% Note: All firms includes publicly held firms.
Asian immigrant owned businesses tend to have higher levels of sales than immigrant owned businesses overall. They are more likely to be represented in the highest sales categories with 13.7 percent having sales of $500,000 or more, which is higher than for non-immigrant owners at 11.8 percent. Hispanic immigrant businesses have lower sales than the immigrant total and non-immigrants. Among Hispanic immigrant firms, 7.4 percent have sales of $500,000 or more.
Examining the full distribution of employment levels, immigrant firms are less likely to hire employees than are non-immigrant firms, but the distributions do not appear to be very different. Table 5 reports estimates. The underlying trend is that only a small percentage of firms hire large numbers of employees. Among immigrant firms, only 4.6 percent of firms hire 10 or more employees. This level is only slightly lower than the level of 5.8 percent for non-immigrant firms. The average of 11.9 employees per employer firm among non-immigrant businesses is clearly driven by a small percentage of firms hiring a very large number of employees. Most firms, whether they are
immigrant or non-immigrant, do not hire any employees and a very small percentage hire more than a few employees.
Table 5: Employment Distributions for Immigrant and Non-Immigrant Owned Firms Special Tabulations from the Survey of Business Owners (2007)
Non- Hispanic Asian All Firms Immigrant Immigrant Immigrant Immigrant Firms: non-employers 78.8% 72.1% 73.7% 80.2% 64.0% Firms with no employees this year 2.3% 3.0% 2.5% 2.2% 3.7% Firms with 1 to 4 employees 10.6% 15.4% 13.3% 11.0% 20.1% Firms with 5 to 9 employees 3.7% 4.9% 4.8% 3.5% 6.8% Firms with 10 to 19 employees 2.3% 2.6% 3.0% 1.9% 3.2% Firms with 20 to 49 employees 1.4% 1.4% 1.9% 0.8% 1.6% Firms with 50 to 99 employees 0.5% 0.4% 0.6% 0.2% 0.4% Firms with 100 to 499 employees 0.3% 0.2% 0.3% 0.1% 0.2% Firms with 500 employees or more 0.1% 0.0% 0.0% 0.0% 0.0% Note: All firms includes publicly held firms.
EXPORTS
Another potential measure of business success is exports. The ability of firms to export goods and services outside of the United States represents a measure of current success. Furthermore, the ability to expand outside of the U.S. market may also represent a sign of future, long-term success. For the first time, the 2007 SBO included information on both owner’s immigrant status and exports. Specially commissioned tabulations of export levels for immigrant and non-immigrant businesses from the 2007 SBO are reported in Table 6. The reported percentages represent the share of total sales of goods and services consisted of exports outside of the United States.
Immigrant owned businesses are more likely to export than are non-immigrant owned businesses. Among immigrant firms, 7.1 percent export compared with only 4.4 percent of non-immigrant firms. Immigrant firms are also more likely to have very high
Table 6: Exports for Immigrant and Non-Immigrant Owned Firms Special Tabulations from the Survey of Business Owners (2007)
Non- Hispanic Asian
Export Percentage of Total Sales All Firms Immigrant Immigrant Immigrant Immigrant
None 95.0% 92.9% 95.6% 94.0% 92.8%
Less than 1% 1.7% 1.4% 1.7% 1.1% 1.5%
1% to 4% 0.9% 1.0% 0.8% 0.7% 0.9%
5% to 9% 0.5% 0.6% 0.5% 0.4% 0.6%
10% to 19% 0.5% 0.8% 0.5% 0.5% 0.9%
20% to 49% 0.6% 1.0% 0.4% 0.7% 1.1%
50% to 99% 0.5% 1.2% 0.3% 1.2% 1.3%
100% 0.3% 1.0% 0.2% 1.4% 1.0%
Notes: (1) All firms includes publicly held firms. (2) Excludes non-responding firms and owners reporting "don't know" for export level.
levels of exports with 3.2 percent of immigrant firms having exports that represent 20 percent or more of their total sales of goods and services. In comparison, less than 1 percent of non-immigrant firms have exports that represent 20 percent or more of their total sales. Both Hispanic and Asian immigrant businesses have relatively high levels of exports compared with non-immigrant firms. Immigrant-owned firms may have higher levels of exports because of business networks with their home countries, similar languages and cultural ties. Regardless of the underlying cause, higher levels of exports among immigrant-owned firms may help these firms better succeed in the long run. Exports are also important for alleviating the large U.S. trade imbalance with the rest of the world and have been emphasized as a way to create jobs (U.S. Whitehouse 2010).
Overall, immigrant businesses have lower average sales and hire fewer employees than non-immigrant businesses. They are less likely to have very high levels of sales of $1,000,000 or more, but they are more likely to export than are non-immigrant firms. Hispanic immigrant owned firms tend to have lower sales and employment and Asian immigrant owned firms have higher sales and employment. Although immigrant owned businesses are not substantially underperforming non-immigrant owned businesses, there might be some untapped potential among this group of business owners. One potential barrier is access to financial capital. Limited access to financial capital may restrict immigrant business success partly explaining why performance is lower than for businesses owned by the Non-immigrant.
3. Financial Capital
PREVIOUS RESEARCH ON CAPITAL AND BUSINESS PERFORMANCE One of the most important barriers preventing would-be entrepreneurs from starting businesses and small businesses from growing is inadequate access to financial capital. Starting with entry, the importance of personal wealth as a determinant of
entrepreneurship has been the focus of an extensive body of literature. Numerous studies using various methodologies, measures of wealth and country microdata explore the relationship between wealth and entrepreneurship. Most studies find that asset levels (e.g. net worth) measured in one year increase the probability of starting a business by the following year.8 The finding has generally been interpreted as providing evidence that entrepreneurs generally face liquidity constraints.
Although a large body of previous research provides evidence that is consistent with low levels of personal wealth resulting in lower rates of business creation, less research has focused on the related question of whether low levels of personal wealth and liquidity constraints also limit the ability of entrepreneurs to raise startup capital resulting in undercapitalized businesses. The consequence is that these undercapitalized
businesses will likely have lower sales, profits and employment and will be more likely to fail than businesses receiving the optimal amount of capital at startup. Evidence on the link between startup capital and owner's wealth is provided by examining the relationship between business loans and personal commitments, such as using personal assets for collateral for business liabilities and guarantees that make owners personally liable for
8
For example, see Evans and Jovanovic (1989), Evans and Leighton (1989), Meyer (1990), Holtz-Eakin, Joulfaian, and Rosen (1994), Lindh and Ohlsson (1996), Black, de Meza and Jeffreys (1996), Blanchflower and Oswald (1998), Dunn and Holtz-Eakin (2000), Fairlie (1999), Earle and Sakova (2000), Johansson (2000), Taylor (2001), Holtz-Eakin and Rosen (2004), and
business debts. Using data from the SSBF and Survey of Consumer Finances (SCF), Avery, Bostic and Samolyk (1998) find that the majority of all small business loans have personal commitments. The common use of personal commitments to obtain business loans suggests that wealthier entrepreneurs may be able to negotiate better credit terms and obtain larger loans for their new businesses possibly leading to more successful firms.9 Cavalluzzo and Wolken (2005) find that personal wealth, primarily through home ownership, decreases the probability of loan denials among existing business owners. If personal wealth is important for existing business owners in acquiring business loans then it may be even more important for entrepreneurs in acquiring startup loans.
Examining the relationship between startup capital and business performance directly, previous research indicates a strong positive correlation. Firms with higher levels of startup capital are less likely to close, have higher profits and sales, and are more likely to hire employees (Fairlie and Robb 2008). The estimates are large and consistent across outcomes. This positive relationship is consistent with the inability of some entrepreneurs to obtain the optimal level of startup capital because of borrowing constraints. Because these entrepreneurs are constrained in the amount of startup capital that could be used to purchase buildings, equipment, and other investments, their
businesses are less successful than if they could have invested the optimal amount of capital. To be sure, the positive correlation, however, may alternatively be partly due to potentially successful business ventures being more likely to generate startup capital than business ventures that are viewed as being potentially less successful (Fairlie and Robb 2008).
9
Astebro and Berhardt (2003) find a positive relationship between business survival and having a bank loan at startup after controlling for owner and business characteristics.
Further evidence of the negative consequences of limited access to financial capital is provided by previous research focusing on explaining low levels of business formation and performance among minority-owned businesses. Previous studies find that extremely low levels of wealth among blacks and Hispanics contribute to why these groups have low business creation rates (Fairlie 1999, Fairlie and Woodruff 2010, and Lofstrom and Wang 2009). Additionally, previous research indicates that minorities have low levels of startup capital relative to non-minority owned businesses resulting in lower survivor rates, profits, employment and sales than non-minority owned businesses (Bates 1997; Fairlie and Robb 2008, 2010). I now turn to an analysis of capital use among immigrant owned businesses.
CAPITAL USE AMONG IMMIGRANT-OWNED BUSINESSES
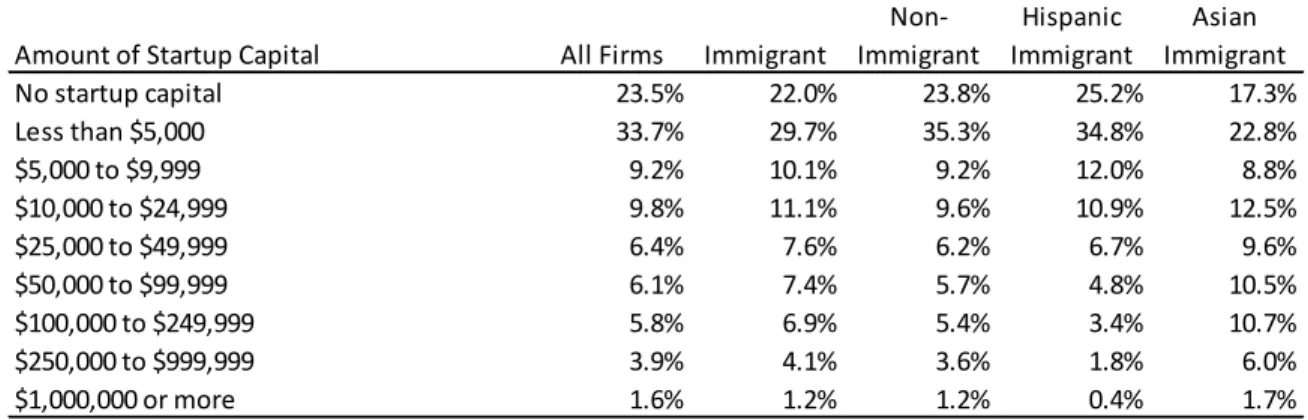
In addition to providing new information on the immigrant status of the business, the 2007 SBO is the first survey since the 1992 CBO to include information on levels of startup capital. Given the importance of access to startup capital for business performance found in the previous literature, this information is extremely valuable for identifying potential barriers to business success. Table 7 reports estimates for the amount of startup capital used by immigrant and non-immigrant owned businesses from specially
commissioned tabulations from the U.S. Census Bureau. Distributions for startup capital levels are reported because categorical responses were included on the questionnaire instead of write-in values. Immigrant firms are less likely to use low levels of startup capital than are non-immigrant firms. Combining the bottom two categories, 51.7 percent of immigrant firms start with less than $5,000 in startup capital compared with 59.1 percent of non-immigrant firms. At the other end of the distribution, immigrant owned
firms are more likely to be represented in the highest startup capital levels. Nearly 20 percent of immigrant owned firms started with $50,000 or more in startup capital
compared with 15.9 percent of non-immigrant owned firms. The distributional estimates make it clear that immigrant owned businesses start with higher levels of startup capital than non-immigrant owned businesses.
Similar to the patterns found for sales and employment, Hispanic immigrant firms have lower levels of startup capital than the immigrant total and Asian immigrant firms have higher levels of startup capital. Among Hispanic immigrant firms, only 10.3 percent have startup capitals of $50,000 or more. Among Asian immigrant firms, 29.0 percent have startup capitals of $50,000 or more. The finding of relatively high levels of startup capital among Asian-owned firms supports previous results indicating high startup capital levels (Fairlie and Robb 2008).
Table 7: Startup Capital Distributions for Immigrant and Non-Immigrant Owned Firms Special Tabulations from the Survey of Business Owners (2007)
Non- Hispanic Amount of Startup Capital All Firms Immigrant Immigrant Immigrant
Asian Immigrant No startup capital
Less than $5,000 $5,000 to $9,999 $10,000 to $24,999 $25,000 to $49,999 $50,000 to $99,999 $100,000 to $249,999 $250,000 to $999,999 $1,000,000 or more
23.5% 33.7% 9.2% 9.8% 6.4% 6.1% 5.8% 3.9% 1.6% 22.0% 29.7% 10.1% 11.1% 7.6% 7.4% 6.9% 4.1% 1.2% 23.8% 35.3% 9.2% 9.6% 6.2% 5.7% 5.4% 3.6% 1.2% 25.2% 34.8% 12.0% 10.9% 6.7% 4.8% 3.4% 1.8% 0.4% 17.3% 22.8% 8.8% 12.5% 9.6% 10.5% 10.7% 6.0% 1.7% Notes: (1) All firms includes publicly held firms. (2) Excludes non-responding firms and owners reporting "don't know" for level of startup capital.
INDUSTRY COMPOSITION
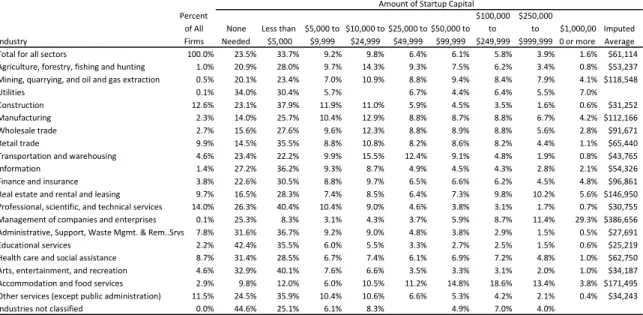
One reason that immigrant and non-immigrant entrepreneurs might differ in the amount of startup capital used is because of their industrial compositions. Immigrant businesses may be more concentrated in industries with high average levels of needed startup capital. Table 8 reports estimates of startup capital by industry for all firms in the United States. These estimates are from published estimates from the 2007 SBO.
Industries vary widely in their levels of startup capital use. To ease the comparison across industries, I impute average startup capital levels from the distribution across reported ranges of startup capital levels and the midpoint of the range of startup capital for each range. For example, I assume that the level of startup capital for all firms in the range of $25,000 to $49,999 is $37,500. This estimate is then multiplied by the share of firms in that startup capital range (e.g. 6.4 percent of the total). The imputed average startup capital level for each industry is the sum of these products. Although this is only an approximation and may suffer from several potential biases it provides a rough estimate of average levels of startup capital by industry. At the least, it provides an index of startup capital that can more easily be compared across a large number of industries. The imputed average level of startup capital is $61,114 for the U.S. total.
Industry
Table 8: Startup Capital by Industry for All U.S. Firms Published Estimates from the Survey of Business Owners (2007)
Amount of Startup Capital Percent
of All None Less than $5,000 to $10,000 to $25,000 to $50,000 to Firms Needed $5,000 $9,999 $24,999 $49,999 $99,999
$100,000 to $249,999 $250,000 to $999,999 $1,000,00 0 or more
Imputed Average Total for all sectors
Agriculture, forestry, fishing and hunting Mining, quarrying, and oil and gas extraction Utilities
Construction Manufacturing Wholesale trade Retail trade
Transportation and warehousing Information
Finance and insurance Real estate and rental and leasing Professional, scientific, and technical services Management of companies and enterprises Administrative, Support, Waste Mgmt. & Rem..Srvs Educational services
Health care and social assistance Arts, entertainment, and recreation Accommodation and food services Other services (except public administration) Industries not classified
100.0% 1.0% 0.5% 0.1% 12.6% 2.3% 2.7% 9.9% 4.6% 1.4% 3.8% 9.7% 14.0% 0.1% 7.8% 2.2% 8.7% 4.6% 2.9% 11.5% 0.0% 23.5% 20.9% 20.1% 34.0% 23.1% 14.0% 15.6% 14.5% 23.4% 27.2% 22.6% 16.5% 26.3% 25.3% 31.6% 42.4% 31.4% 32.9% 9.8% 24.5% 44.6% 33.7% 28.0% 23.4% 30.4% 37.9% 25.7% 27.6% 35.5% 22.2% 36.2% 30.5% 28.3% 40.4% 8.3% 36.7% 35.5% 28.5% 40.1% 12.0% 35.9% 25.1% 9.2% 9.7% 7.0% 5.7% 11.9% 10.4% 9.6% 8.8% 9.9% 9.3% 8.8% 7.4% 10.4% 3.1% 9.2% 6.0% 6.7% 7.6% 6.0% 10.4% 6.1% 9.8% 14.3% 10.9% 11.0% 12.9% 12.3% 10.8% 15.5% 8.7% 9.7% 8.5% 9.0% 4.3% 9.0% 5.5% 7.4% 6.6% 10.5% 10.6% 8.3% 6.4% 9.3% 8.8% 6.7% 5.9% 8.8% 8.8% 8.2% 12.4% 4.9% 6.5% 6.4% 4.6% 3.7% 4.8% 3.3% 6.1% 3.5% 11.2% 6.6% 6.1% 7.5% 9.4% 4.4% 4.5% 8.7% 8.9% 8.6% 9.1% 4.5% 6.6% 7.3% 3.8% 5.9% 3.8% 2.7% 6.9% 3.3% 14.8% 5.3% 4.9% 5.8% 6.2% 8.4% 6.4% 3.5% 8.8% 8.8% 8.2% 4.8% 4.3% 6.2% 9.8% 3.1% 8.7% 2.9% 2.5% 7.2% 3.1% 18.6% 4.2% 7.0% 3.9% 3.4% 7.9% 5.5% 1.6% 6.7% 5.6% 4.4% 1.9% 2.8% 4.5% 10.2% 1.7% 11.4% 1.5% 1.5% 4.8% 2.0% 13.4% 2.1% 4.0% 1.6% 0.8% 4.1% 7.0% 0.6% 4.2% 2.8% 1.1% 0.8% 2.1% 4.8% 5.6% 0.7% 29.3% 0.5% 0.6% 1.0% 1.0% 3.8% 0.4% $61,114 $53,237 $118,548 $31,252 $112,166 $91,671 $65,440 $43,765 $54,326 $96,861 $146,950 $30,755 $386,656 $27,691 $25,219 $62,750 $34,187 $171,495 $34,243 Notes: (1) Includes all U.S. firms which include publicly held firms. (2) The imputed average for each industry is calculated
multiplied by the midpoint of each range of startup capital values. See text for more details.
from the startup capital distribution
Using the imputed averages, industries differ greatly in their startup capital levels. Among industries that have a reasonably-sized share of the total industry distribution, Accommodation and food services, Real estate and rental and leasing, and Manufacturing have high levels of startup capital. Professional, scientific, and technical services,
Construction, and Other services (except public administration) are large industries that have relatively low levels of average startup capital.
The overrepresentation of immigrant firms in certain industries may explain startup capital differences between immigrant-owned businesses and non-immigrant owned businesses. To investigate this question, Table 9 reports industry distributions for immigrant and non-immigrant owned businesses. There are some differences in industry concentrations between immigrant and non-immigrant firms, but the differences are not large. The largest differences are that immigrant businesses are more concentrated in Accommodation and food services than non-immigrant businesses (7.3 percent compared
with 2.7 percent), and less concentrated in Construction (8.7 percent compared with 12.1 percent) and Real estate and rental and leasing (10.0 percent compared with 13.4
percent).
Table 9: Industry Distribution and Imputed Average Startup Capital for Immigrant and Non-Immigrant Firms Published Estimtes from the 2007 Survey of Business Owners
Industry Distribution Imputed Average Industry Immigrant Non-Immigrant Startup Capital Total for all sectors 100.0% 100.0% $61,114 Agriculture, forestry, fishing and hunting 0.3% 1.0% $53,237 Mining, quarrying, and oil and gas extraction 0.1% 0.7% $118,548
Utilities 0.0% 0.1%
Construction 8.7% 12.1% $31,252
Manufacturing 2.5% 3.2% $112,166
Wholesale trade 4.2% 3.2% $91,671
Retail trade 11.3% 10.5% $65,440
Transportation and warehousing 5.7% 3.2% $43,765
Information 1.2% 1.4% $54,326
Finance and insurance 2.7% 4.5% $96,861 Real estate and rental and leasing 10.0% 13.4% $146,950 Professional, scientific, and technical services 13.7% 15.8% $30,755 Management of companies and enterprises 0.1% 0.1% $386,656 Administrative and Support and Waste Mang & Remediation Srvs 6.9% 6.2% $27,691 Educational services 1.6% 1.9% $25,219 Health care and social assistance 9.2% 6.8% $62,750 Arts, entertainment, and recreation 2.7% 4.3% $34,187 Accommodation and food services 7.3% 2.7% $171,495 Other services (except public administration) 11.8% 9.1% $34,243 Industries not classified 0.0% 0.0%
Imputed avrg. startup capital based on industry distribution $67,704 $65,866
Notes: (1) Imputed average startup capital by industry is taken from Table 8. Estimates are based on a sample of all firms and are not limited to only immigrant and non-immigrant firms. (2) See text for more details on calculation of imputed average startup capital based on industry distribution.
The slight differences in industry distributions do not appear to contribute
substantially to differences in levels of startup capital. At the bottom of Table 9, imputed values for average startup capital based on industry distributions are reported for
immigrant and non-immigrant owned firms. The industry distribution of immigrant-owned businesses results in a predicted average startup capital level of $67,704. This is only slightly higher than the average startup capital predicted by the non-immigrant owned business industry distribution of $65,866. With the caveats in mind that these are imputed averages and that real levels may differ, these results suggest that industry differences are not large enough to contribute substantially to differences in startup capital levels between immigrant and non-immigrant owned businesses.
TYPES OF FINANCING
Do immigrant businesses differ in the types of financing they use from non-immigrant businesses? The 2007 SBO includes information on sources of capital used to start or acquire the business and sources of capital to finance expansion or capital
improvements for the business. Table 10 reports sources of startup capital for immigrant and non-immigrant owned businesses from specially-commissioned tabulations from the 2007 SBO. The reported totals are not restricted to sum to 100 percent because business owners were instructed to “mark all that apply” among a list of potential sources of startup capital. The most common source of startup capital for both immigrant firms and non-immigrant firms is from personal or family savings. Roughly two-thirds of both immigrant and non-immigrant owned firms report this source of startup capital. The second most common source of startup capital used by immigrant businesses is personal or business credit cards (11.1 percent). Another common source of startup capital is a business loan from a bank or financial institution, but immigrant businesses are slightly less likely to use this source than are non-immigrant businesses (8.3 percent compared
with 11.2 percent). Immigrant business owners also commonly use personal and family assets (other than savings) and home equity loans to finance business starts. Interestingly, only a small share of immigrant-owned businesses report receiving business loans or investments from family and friends.
Table 10: Sources of Startup Capital for Immigrant and Non-Immigrant Owned Firms Special Tabulations from the Survey of Business Owners (2007)
Non- Hispanic
Amount of Startup Capital All Firms Immigrant Immigrant Immigrant
Asian Immigrant None needed
Personal/family savings of owner(s)
Personal/family assets other than savings of owner(s) Personal/family home equity loan
Personal/business credit card(s)
Business loan from federal, state, or local government
Government-guaranteed business loan fr bank or financial institution Business loan from a bank or financial institution
Business loan/investment from family/friends Investment by venture capitalist(s)
Grants
Other source(s) of capital
21.7% 62.8% 8.1% 5.8% 10.8% 0.7% 0.7% 11.1% 2.7% 0.4% 0.4% 2.4% 20.5% 65.9% 6.4% 6.9% 11.1% 0.6% 0.6% 8.3% 3.2% 0.3% 0.2% 2.0% 22.1% 63.3% 8.3% 5.6% 11.0% 0.7% 0.7% 11.2% 2.6% 0.3% 0.2% 1.9% 23.6% 61.9% 5.4% 6.6% 10.8% 0.4% 0.3% 5.7% 2.2% 0.3% S 1.7% 16.2% 68.8% 7.8% 8.8% 11.5% 0.8% 0.9% 11.1% 4.7% 0.3% 0.2% 2.2% Notes: (1) All firms includes publicly held
source of startup capital.
firms. (2) Excludes non-responding firms and owners reporting "don't know" for
Consistent with higher levels of startup capital, Asian immigrant owned firms tend to use all sources of startup capital more often than the immigrant total. Hispanic immigrant firms, in contrast, tend to use less of the reported sources of startup capital. Asian immigrant firms are similarly likely to rely on business loans from banks or financial institutions for financing startups as are non-immigrant firms.
The main finding from these results is that immigrant and non-immigrant business owners rely on similar sources of startup capital to start their businesses. Immigrant owned firms rely heavily on personal and family savings to fund startup activities. They also rely heavily on credit cards, bank loans, personal and family assets, and home equity
loans. These are also the most common sources of financing by non-immigrant owned businesses in the United States.
In terms of sources of capital used to finance expansions reported in Table 11, immigrant owned businesses report personal and family savings as the most common source (36.1 percent). Immigrant owned businesses also commonly rely on personal and business credit cards and business profits and assets to finance expansions of their businesses. The reported totals for sources of capital used for expansion do not differ substantially between immigrant and non-immigrant owned businesses.
Table 11: Sources of Expansion Capital for Immigrant and Non-Immigrant Owned Firms Special Tabulations from the Survey of Business Owners (2007)
Non- Hispanic
Sources of Expansion Capital All Firms Immigrant Immigrant Immigrant
Asian Immigrant Personal/family savings of owner(s)
Personal/family assets other than savings of owner(s) Personal/family home equity loan
Personal/business credit card(s)
Business loan from federal, state, or local government
Government-guaranteed business loan fr bank or financial institution Business loan from a bank or financial institution
Business loan/investment from family/friends Investment by venture capitalist(s)
Business profits and/or assets Grants
Other source(s) of capital Did not have access to capital
Did not expand or make capital improvement(s)
31.7% 4.5% 5.0% 13.3% 0.5% 0.4% 9.5% 1.1% 0.2% 11.2% 0.4% 1.1% 1.6% 49.0% 36.1% 4.2% 6.0% 13.1% 0.5% 0.4% 7.1% 1.7% 0.2% 8.5% 0.2% 1.0% 2.2% 45.9% 31.6% 4.6% 4.9% 13.6% 0.5% 0.3% 9.7% 1.0% 0.1% 11.4% 0.2% 0.8% 1.5% 49.8% 33.7% 3.7% 5.7% 12.6% 0.5% 0.3% 5.6% 1.2% 0.2% 7.0% 0.2% 0.8% 2.8% 47.8% 39.4% 4.9% 7.1% 13.1% 0.7% 0.5% 8.3% 2.5% 0.2% 8.9% 0.3% 1.0% 2.1% 41.8% Notes: (1) All firms includes publicly held firms. (2) Excludes non-responding firms and owners reporting "don't know" for source of expansion capital.
4. Home Ownership and Entrepreneurship
The single largest asset held by most households is their home. More than two-thirds of American families are home owners with a median home equity of $59,000 (U.S. Census Bureau 2008). Home equity represents 60 percent of all wealth. Home
equity as well as other forms of personal wealth is important for starting businesses because it can be invested directly in the business or used as collateral to obtain business loans. Indeed, previous research indicates that home ownership and equity are found to be associated with entrepreneurship and obtaining business loans using Finish data (Johansson 2000), U.K. data (Black, de Meza, and Jeffreys 1996), and U.S. data (Fairlie 2011; Cavalluzzo and Wolken 2005). Although the SBO does not collect information on the use of home equity as collateral for loans, it does indicate that home equity loans are one of the most common sources of startup capital (see Table 10). This section examines the question of whether immigrants and non-immigrants differ in rates of home
ownership and whether these differences have any impact on differences in rates of business formation.
The question of whether the Great Recession affected home ownership and entrepreneurship among immigrants is also examined. Sparking the recession was the housing crisis -- housing prices plummeted since reaching their peak in mid 2007. The national housing price index experienced the largest decline on record (Federal Housing Finance Agency 2009). Home foreclosures also rose rapidly over the past few years. In the one period for May 2010, there were 323,000 foreclosure filings, representing an alarming 1 out every 400 housing units in the United States (Realtytrac 2010).
Table 12 reports home ownership rates for 2010 for immigrants and the Non-immigrant from the CPS. These are the latest data available on Non-immigrant home ownership rates. Immigrant rates of home ownership are much lower than the Non-immigrant home ownership rate. Among Non-immigrants 52.1 percent own a home compared with 70.8 percent of Non-immigrant.
What impact do these differences have on business formation patterns? To investigate this question the relationship between home ownership and entrepreneurship among all individuals is first examined. Using matched CPS data on business formation for 2010, I examine the determinants of business formation. The business formation or entrepreneurship rate measures the percentage of the adult, non-business owner
population that starts a business each month. It captures all new business owners, including those who own incorporated or unincorporated business, and those who are employers or non-employers.
The following logit regression for the probability of entrepreneurship is estimated: (5.1) Prob(yit=1) = F(α + γ1Hit+ β'Xit+ λt),
where yit equals 1 if the individual starts a business by the second or subsequent survey
month in the two-month pair and 0 otherwise, Hit is whether the individual owns his or
her home, Xitincludes individual characteristics, λt are month fixed effects to control for
seasonal variation, and F is the cumulative distribution function for the logistic
distribution. The individual characteristics include gender, race/ethnicity, nativity, age,
Table 12: Home Ownership Rates by Immigrant Status Current Population Survey (2010)
Home Owners Sample Size Total 67.8% 967,917 Immigrant 52.1% 137,635 Non-Immigrant 70.8% 830,282 Notes: (1) The sample consists of individuals ages 20-64. (2) All estimates are calculated using sample weights provided by the CPS.
education, family income, marital status, region, urban status, and initial employment status. The parameter of interest is γ1, which captures the relationship between whether
an individual owns a home and entrepreneurship. All specifications are estimated with logit regressions using CPS sample weights. Marginal effects and their standard errors are reported.10 Marginal effects estimates are similar from probit and linear probability models, and are thus not reported.
Table 13 reports estimates of (5.1). The base specification includes controls for individual characteristics. The estimates indicate that women are less likely to become entrepreneurs. African-Americans, Hispanics, and Asians are also less likely to start businesses, all else equal.11 Entrepreneurship increases with age and married people are more likely to start businesses.
10
The reported marginal effect provides an estimate of the effect of a 1-unit increase in the independent variable on the self-employment entry probability. It equals the sample average of
) 1
/( ˆ
ˆ β
β i
i X
X
e
e + .
11
Table 13
Regressions for Probability of Entrepreneurship Current Population Survey (2010)
Explanatory Variables (1) (2)
Female Black Hispanic Native American Asian Immigrant Age (00s) Age squared Married Previously married High School graduate Some college
College graduate Graduate school
Family income: $25,000 to $50,000
Family income: $50,000 to $75,000
Family income: $75,000 or more -0.00224 (0.00015) -0.00149 (0.00027) 0.00032 (0.00024) -0.00185 (0.00093) -0.00118 (0.00036) 0.00216 (0.00022) 0.03707 (0.00468) -0.04035 (0.00537) 0.00072 (0.00021) 0.00001 (0.00027) -0.00049 (0.00023) -0.00010 (0.00024) 0.00053 (0.00027) 0.00030 (0.00033) -0.00069 (0.00020) -0.00084 (0.00024) -0.00050 (0.00023) -0.00192 (0.00016) -0.00131 (0.00027) 0.00032 (0.00024) -0.00187 (0.00093) -0.00096 (0.00036) 0.00213 (0.00022) 0.03530 (0.00472) -0.03783 (0.00542) 0.00066 (0.00021) -0.00005 (0.00027) -0.00043 (0.00023) 0.00004 (0.00024) 0.00070 (0.00027) 0.00059 (0.00034) -0.00070 (0.00020) -0.00084 (0.00024) -0.00052 (0.00023) (continued)
Table 13 (Continued)
Explanatory Variables (1) (2)
Unemployed
Not in the labor force Non central city Non MSA
Central city status not identified South
Midwest West
Home owner Industry controls
Mean of dependent variable Sample size 0.00659 (0.00019) 0.00392 (0.00018) -0.00016 (0.00018) 0.00029 (0.00024) -0.00028 (0.00025) -0.00022 (0.00026) 0.00077 (0.00022) 0.00061 (0.00023) 0.00034 (0.00018) No 0.00324 593,271 0.00624 (0.00020) 0.00606 (0.00123) -0.00015 (0.00018) 0.00048 (0.00025) -0.00019 (0.00025) -0.00013 (0.00026) 0.00072 (0.00022) 0.00058 (0.00023) 0.00038 (0.00018) Yes 0.00324 593,271
Notes: (1) The sample consists of individuals (ages 20-64) who do not own a business in the initial survey month of the two-month pair. (2) Marginal effects and their standard errors are reported. (3) Additional controls include month dummies.
The relationship between entrepreneurship and education is not linear.
Entrepreneurship rates are lower for high school graduates than for high school dropouts (the left out category), but entrepreneurship rates are similar between those with some college and high school graduates. College graduates have higher rates of
entrepreneurship and those with graduate degrees have the highest rates of
entrepreneurship. Thus, there is a U-shaped relationship between entrepreneurship and education.12 Business formation rates tend to decline with total family income, and entrepreneurship rates are higher among the unemployed and those not in the labor force.
Turning to results for the two main variables of interest to this study, the logit estimates indicate that home owners are more likely to start businesses than non-home owners. The coefficient is large, positive and statistically significant. Home owners have a 0.034 percentage point higher rate of entrepreneurship than non-home owners, which is more than 10 percent of the mean rate of entrepreneurship. In other words, home owners are roughly 10 percent more likely to start businesses than are non-home owners, all else equal. In the presence of liquidity constraints, the ability of owners to borrow against the value of their homes may make it easier to finance new business ventures. It is unlikely that the home ownership variable is simply picking up current or permanent income effects because the regressions control for family income, education, and unemployment.
The logit regressions also indicate that immigrants have higher entrepreneurship rates than the non-immigrants even after controlling for education, family income, region, initial employment status, home ownership and other characteristics. Immigrants have entrepreneurship rates that are 0.22 percentage points higher than non-immigrant rates.
12
See van der Sluis, van Praag and Vijverberg (2005) and van Praag (2005) for reviews of the evidence on the relationship between education and entrepreneurship.
The raw difference in entrepreneurship rates was 0.28 percentage points as reported in Table 2. The difference in these findings suggests that controlling for demographic factors and home ownership explains part, but only part, of why immigrants have higher entrepreneurship rates than the Non-immigrant.
Specification 2 of Table 13 reports logit regression estimates that include industry controls. Industries differ in their propensity for individuals to start businesses and the industrial composition may be related to education, home ownership, immigrant status and other characteristics. Construction has the highest rate of business creation followed by Professional Services. The lowest rate of entrepreneurship is found in Manufacturing. The addition of industry controls, however, has little effect on the results for the
immigrant variable. It declines slightly from 0.00216 to 0.00213. The home ownership coefficient increases slightly to 0.38 percentage points. Industry controls are not included in the main specification because of endogeneity concerns. The main issue is that the choice of industry and the choice of starting a business may be simultaneously
determined. Workers are not constrained to starting businesses in their current industry and may choose different industries depending on the goals of their businesses. But, these results provide a useful robustness check of the main results and indicate that the results are not sensitive to industry differences.
Given that home ownership has a positive effect on entrepreneurship rates it is useful to conduct a simple “back-of-the-envelope” calculation of how much low rates of home ownership restrict the business formation rate of immigrants. Home owners have a 0.00034 higher rate of entrepreneurship than non-home owners and the home ownership rate is 0.30 lower among immigrants (see Table 12). The product of these two estimates
indicates that immigrant entrepreneurship rates would be 0.00011 higher if immigrants had home ownership rates that were at the same level as the Non-immigrant. In other words, the high rate of business formation among immigrants could be even higher if they had higher rates of home ownership, which might provide better access to financial capital.
RECENT TRENDS AND THE GREAT RECESSION
Trends in entrepreneurship and home ownership over the Great Recession are examined next. Figure 1 displays entrepreneurship rates for immigrants and non-immigrants from 1996 to 2010.13 I focus on the period starting in 1996 because it
captures the start of the strong economic growth period of the 1990s reasonably well and because of data limitations in matching the CPS in immediately preceding years.14 The period from the beginning of 1996 to the end of 2010 captures two downturns and two growth periods. The NBER officially dates the peak of the strong economic growth period of the late 1990s as March 2001 and the subsequent contraction period as ending in November 2001. The next peak of the business cycle was December 2007 and the official end of the Great Recession was June 2009, although unemployment remained very high throughout 2009 and 2010 (NBER 2010, U.S. Bureau of Labor Statistics 2011).
13
See Fairlie (2011) for recent trends in entrepreneurship rates for several demographic groups and all states.
14
The NBER dates the trough of the early 1990s business cycle as occurring in March 1991, but an examination of the national unemployment rate reveals that unemployment reached its peak in mid 1992 and real GDP growth was not consistently high until the third quarter of 1995 (it was very low in the first two quarters of 1995). It is not possible to extend the sample period
backwards a couple years because it is not possible to create entrepreneurship data for 1994 and 1995. In these years, the Bureau of Labor Statistics re-randomized the identification codes making it impossible to match individuals over time. However, 1996 is the first year in which the unemployment rate was consistently declining and real GDP growth was consistently high.
The national entrepreneurship rate generally followed a countercyclical pattern, rising when unemployment rates were high and declining when unemployment rates were low. A positive relationship between unemployment and business formation has been found in the previous literature and is due to layoffs and slack labor markets creating increased levels of “necessity” entrepreneurship (Parker 2009 and Fairlie 2011).
Although the motivation might differ for starting the business in this case, many of these businesses may eventually be very successful. For example, a recent study by Stangler (2009) finds that the majority of Fortune 500 companies were started during recessions or bear markets. In 2010, an average of 0.34 percent of the adult population, or 340 out of
0.0% 0.1% 0.2% 0.3% 0.4% 0.5% 0.6% 0.7%
1996 1997 1998 1999 2000 2001 2002 2003 2004 2005 2006 2007 2008 2009 2010
Figure 1
Entrepreneurship Rates by Immigrant Status (1996-2010)
similar in 2009, but increased from 2008 when it was 0.32 percent. It rose from prior to the Great Recession in 2006 when it was 0.29 percent. The recent increase is the largest over the fifteen-year sample period.
The immigrant entrepreneurship rate follows the same general time-series pattern as the national rate – rising in recessions and declining in strong economic growth periods. The main difference displayed in the figure is that entrepreneurship rates are consistently higher for immigrants than for the non-immigrant over the entire time period. The immigrant rate is roughly 0.05 to 0.10 percentage points higher than the non-immigrant rate from 1996 to 2006. But, starting in 2007 in the Great Recession the immigrant rate becomes substantially higher than the non-immigrant rate. It rises to being 0.19 percentage points higher in 2007 then to 0.33 percentage points higher by 2010. Because of limited job opportunities in the Great Recession there appears to be an even greater response of starting businesses among immigrants than among non-immigrants, which may have to do with lower-skilled workers having more difficulty in finding jobs.
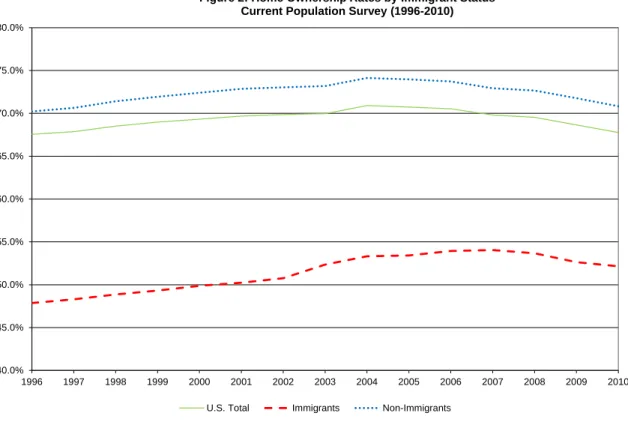
How did immigrant and non-immigrant home ownership rates respond to the Great Recession? Figure 2 displays home ownership rates for immigrants and non-immigrants from 1996 to 2010. For both groups home ownership rates rose in the late 1990s and early 2000s, but declined in the Great Recession. In the Great Recession, many individuals were forced to either sell or foreclose on their homes because they could not make their housing payments, which negatively impacted national home ownership rates (Realtytrac 2010). The decline in home ownership rates was not steep for immigrants though as the rate of home ownership dropped from 55 percent in 2007 to 53 percent in 2010.
Did the importance of home ownership for business creation change over the recession? To examine this question I estimate logit regressions using the full sample period from 1996 to 2010. Table 14 reports estimates. Specification 1 reports estimates of logit regressions including home ownership. Similar to the results using only 2010 data there is a positive coefficient on home ownership. The main difference is that the home ownership coefficient is smaller using the full sample period. The coefficient estimate now indicates that home owners are 0.019 percentage points more likely to start businesses than are non-home owners, all else equal.
40.0% 45.0% 50.0% 55.0% 60.0% 65.0% 70.0% 75.0% 80.0%
1996 1997 1998 1999 2000 2001 2002 2003 2004 2005 2006 2007 2008 2009 2010
Figure 2: Home Ownership Rates by Immigrant Status Current Population Survey (1996-2010)
Table 14
Regressions for Probability of Entrepreneurship Current Population Survey (1996-2010)
Explanatory Variables (1) (2)
Female Black Hispanic Native American Asian Immigrant Age (00s) Age squared Married Previously married High School graduate Some college
College graduate Graduate school
Family income: missing Family income: $25,000 to
$50,000
Family income: $50,000 to $75,000
Family income: $75,000 or
-0.00217 (0.00004) -0.00129 (0.00007) -0.00027 (0.00007) -0.00048 (0.00019) -0.00132 (0.00010) 0.00115 (0.00006) 0.03495 (0.00118) -0.04136 (0.00137) 0.00090 (0.00006) 0.00058 (0.00007) 0.00023 (0.00006) 0.00045 (0.00006) 0.00090 (0.00007) 0.00099 (0.00009) 0.00059 (0.00006) -0.00003 (0.00006) -0.00033 (0.00007) 0.00000 (0.00007) -0.00217 (0.00004) -0.00129 (0.00007) -0.00027 (0.00007) -0.00048 (0.00019) -0.00132 (0.00010) 0.00115 (0.00006) 0.03492 (0.00118) -0.04133 (0.00137) 0.00090 (0.00006) 0.00058 (0.00007) 0.00023 (0.00006) 0.00045 (0.00006) 0.00090 (0.00007) 0.00099 (0.00009) 0.00059 (0.00006) -0.00004 (0.00006) -0.00033 (0.00007) 0.00000 (0.00007)
Table 14 (Continued)
Explanatory Variables (1) (2)
Unemployed
Not in the labor force Non central city Non MSA
Central city status not identified South
Midwest West
Home owner
Home owner in non-ressionary months Home owner in 2001 recession
Home owner in 2007-09 recession
Industry controls
Mean of dependent variable Sample size 0.00736 (0.00005) 0.00488 (0.00005) -0.00017 (0.00005) 0.00019 (0.00006) -0.00036 (0.00006) 0.00019 (0.00006) 0.00073 (0.00006) 0.00094 (0.00006) 0.00019 (0.00005) No 0.00300 8,514,616 0.00736 (0.00005) 0.00488 (0.00005) -0.00017 (0.00005) 0.00019 (0.00006) -0.00036 (0.00006) 0.00019 (0.00006) 0.00073 (0.00006) 0.00094 (0.00006) 0.00023 (0.00005) 0.00032 (0.00016) -0.00009 (0.00010) Yes 0.00300 8,514,616
Notes: (1) The sample consists of individuals (ages 20-64) who do not own a business in the initial survey month of the two-month pair. (2) Marginal effects and their standard errors are reported. (3) Additional controls include month and year dummies.