Supporting Organisations
GeSI and member companies: Bell Canada, British Telecommunications Plc, Cisco Systems, Deutsche Telekom AG, Ericsson, France Telecom, Hewlett-Packard, Intel, Microsoft, Nokia, Nokia Siemens Networks, Sun Microsystems, T-Mobile, Telefónica S.A., Telenor, Verizon, Vodafone Plc. Additional support: Dell, LG.
Steering Committee Deutsche Telekom AG
Luis Neves, Chair of GeSI
The Climate Group
Emily Farnworth Chair of Steering Committee
British Telecommunications Plc
Chris Tuppen
Cisco Systems
Juan Carlos Castilla-Rubio
Intel
Robert Wright
LG
Alexander Grossmann
Nokia Siemens Networks
Juha-Erkki Mantyniemi
T-Mobile
Allison Murray
Vodafone Plc
Joaquim Croca
Project Director
Molly Webb, The Climate Group
Independent Analysis
McKinsey & Company
Acknowledgements
The report was developed independently on behalf of GeSI. Particular thanks to the members of the Steering Commitee and the editorial team, who helped develop and sustain the project. The analysis contained in this report would not have been possible without contributions from McKinsey, Jason Adcock and Anna da Costa, co-editing by Chris Tuppen and Juan Carlos Castilla-Rubio and editorial support from Flemmich Webb and Karen Anderton. Special thanks for the participation of individuals in the sponsoring companies (listed above) who were involved throughout the analysis. We are grateful to the experts we consulted for general guidance and to develop our regional case studies (Appendix 5) and also to the many others not listed who have supported along the way.
Support for the report
This rigorous assessment underlines that the world can realise a green economy and make the transition to a low carbon economy. It also underlines the crucial importance of the international community reaching a deal on a new climate agreement at the climate convention meeting in Copenhagen in 2009. This partnership between GeSI (convened under UNEP) and The Climate Group, with analytical support from McKinsey, gives us yet another platform for action and yet another compelling reason for reasoned optimism. Achim Steiner, UN Under-Secretary General and Executive Director, UN Environment Programme (UNEP)
Nowhere is ICT’s vast potential more apparent than India where it is driving opportunity and development and transforming our economy and society. This important report makes clear the exciting opportunity that exists for industry to significantly contribute to climate change abatement, as well as expand into new markets.
Nandan Nilekani, Co-Chairman, Infosys Technologies Limited
The ICT industry has a very significant role to play in reducing greenhouse gas emissions, especially in a rapidly developing country such as China. Future development in China should not follow the wrong path taken by developed countries. Many industries can make use of modern ICT technology to move into higher efficiency low carbon markets. If we are to better use ICT technology to move away from existing energy-intensive work habits and lifestyles, we need government policy innovations, incentives for companies and the active participation of consumers. Tang Min, Deputy Secretary-General, China Development Research Foundation
This report gives a clear picture of the key role that the ICT industry plays in addressing climate change globally and facilitating efficient and low carbon development. The role of ICT not only includes emission reduction and energy savings in the ICT sector itself, but also benefits from the adoption of ICT technologies to influence and transform the way our society works and the way people behave. By using our huge network and over 400 million customers, China Mobile is doing its best to promote this transformation and to realise real sustainable development for human beings and the environment.Wang Jianzhou, Chief Executive, China Mobile Communications Corporation
Unlocking the universal potential of clean technology in the information systems sector is a critical step toward a low carbon future. Silicon Valley innovators and the growing support of clean tech investors in California place the state in a unique position to lead the effort to combat global warming. Linda Adams, Secretary, California Environmental Protection Agency
Contents
06
Forewords
09
Report summary
Chapter 1:
12
The time for change
Chapter 2:
17
Taking direct action
Chapter 3:
29
The enabling effect
29
Dematerialisation
32
SMART motor systems
36
SMART logistics
40
SMART buildings
45
SMART grids
Chapter 4:
53
The SMART 2020 transformation
Appendices
63
1:
Scope, process and methodology
65
2:
The direct impact assumptions
66
3:
The enabling effect assumptions
75
4:
Company commitments
79
5:
Experts consulted and/or interviewed
Forewords
A force for change
The most recent results presented by climate scientists are alarming. The accumulation of greenhouse gases (GHG) in the atmosphere is growing faster than originally predicted. Scientists, economists and policy makers are calling for emissions targets of at least 20% below 1990 levels in 2020.
It is our responsibility to estimate the GHG emissions from the information and communications technology (ICT) industries and to develop opportunities for ICT to contribute to a more efficient economy.
“SMART 2020 – Enabling the low carbon economy in the information age” presents the case for a future-oriented ICT industry to respond quickly to the challenge of global warming.
We now have evidence demonstrating that the ICT industry is a key player in creating a low carbon society and could do a lot more to help push the world in this direction by 2020.
The ICT sector’s own emissions are expected to increase, in a business as usual (BAU) scenario, from 0.53 billion tonnes (Gt) carbon dioxide equivalent (CO2e) in 2002 to 1.43 GtCO2e
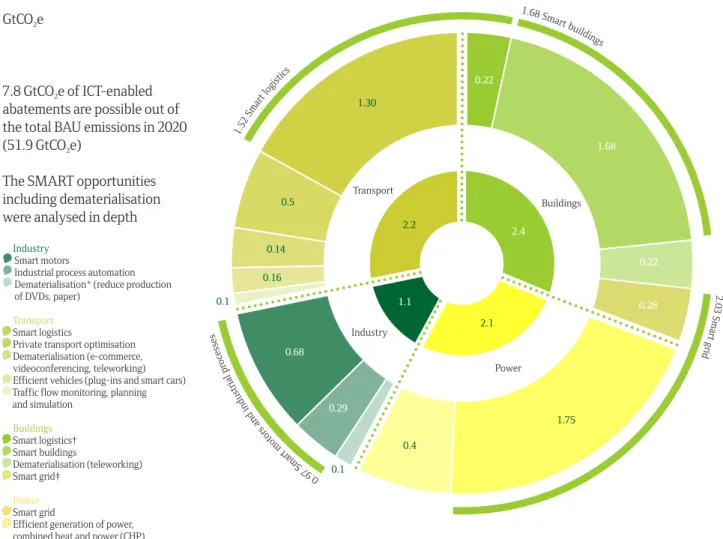
in 2020. But specific ICT opportunities identified in this report can lead to emission reductions five times the size of the sector’s own footprint, up to 7.8 GtCO2e, or 15% of total BAU emissions
by 2020.
This report has identified many opportunities for the ICT industry, to replace goods and services with virtual equivalents and to provide technology to enable energy efficiency. The ICT sector must act quickly to demonstrate what is possible, get clear messages from policy makers about targets and continue to innovate radically to reduce emissions. The publication of this report is not an end but a beginning and GeSI is committed to continue to work across the industry as a force for change. In particular GeSI will:
1. Develop an agreed ICT industry-wide methodology for the carbon footprinting of ICT products and services
2. Put more emphasis on climate change issues in our supply chain work so we influence the end-to-end manufacturing process for electronic equipment
3. Ensure that energy and climate change matters are fully considered by the organisations that set the technical standards for our industry 4. Work with organisations in the key opportunity
areas – travel/transport, buildings, grids and industry systems – to help turn potential CO2
reductions into reality. This will include a strong emphasis on the significant opportunities offered by dematerialisation
5. Work with public policy makers to ensure that the right regulatory and fiscal frameworks are in place to move us all in the right direction. We will do this by involving appropriate partners drawn from the business and NGO worlds. In particular we aim to continue our successful partnership with The Climate Group. We will also continue to work collaboratively with the International Telecommunication Union (ITU) and the World Business Council for Sustainable Development (WBCSD).
In conclusion
The ICT sector has both a profitable opportunity and a critical role to play with other sectors to design and deploy solutions needed to create a low carbon society. I urge you to review this report and focus your efforts on improving energy efficiencies wherever possible, to collaborate with us in steering regulations to be more productive and to move boldly forward with technologies to improve our global climate. Acting now will be good for business, good for the economy and good for the world.
Luis Neves Chair, GeSI
About GeSI
GeSI (www.gesi.org) is an international strategic partnership of ICT companies and industry associations committed to creating and promoting technologies and practices that foster economic, environmental and social sustainability and drive economic growth and productivity. Formed in 2001, GeSI fosters global and open cooperation, informs the public of its members’ voluntary actions to improve their sustainability performance and promotes technologies that foster sustainable development. It partners with the UNEP and the ITU. These partners help shape our global vision regarding the evolution of the telecommunications sector and how we can best meet the challenges of sustainable development.
About The Climate Group
The Climate Group is an independent, not-for-profit organisation that works internationally with government and business leaders to advance climate change solutions and accelerate a low carbon economy. Its coalition of proactive leaders – from government, business and civil society – has demonstrated that emissions reductions, essential to stop climate change, can be achieved while boosting profitability and competitiveness. More companies, states, regions and cities around the world are realising there are significant economic as well as environmental advantages from taking decisive action now. The Climate Group was founded in 2004 and has offices in the UK, USA, China, India and Australia. A European office is planned for 2008.
The SMART solution
Putting a man on the moon was one of the greatest technological challenges of the 20th century. In the 21st century we face an even greater test – tackling climate change. In contrast to the space race, the solutions required today must encompass us all. This is not just about one man walking on the moon, but about 7 or 8 billion people, the population of 2020, living low carbon lifestyles in harmony with our climate.
How can a mission of this size be achieved? This report illustrates for the first time the scale of the opportunity for ICT to drive efficiency across the economy and deliver emission savings of 15% – 7.8 GtCO2e – of global
BAU emissions in 2020.
Recently, Lord Stern revised his targets for safe levels of GHG emissions reductions to 2 tonnes per capita by 2050 (20 GtCO2e). The
ICT-enabled solutions in this report would make possible savings of 1 tonne per capita in 2020, a significant step in the right direction.
When we started the analysis, we expected to find that ICT could make our lives ‘greener’ by making them more virtual – online shopping, teleworking and remote communication all altering our behaviour. Although this is one important aspect of the ICT solution, the first and most significant role for ICT is enabling efficiency.
Consumers and businesses can’t manage what they can’t measure. ICT provides the solutions that enable us to ‘see’ our energy and emissions in real time and could provide the means for optimising systems and processes to make them more efficient. Efficiency may not sound as inspirational as a space race but, in the short term, achieving efficiency savings equal to 15% of global emissions is a radical proposition. The breadth of solutions will span motor systems, logistics and transport, buildings and electricity grids – across all key economies in the world.
Mature economies will be able to upgrade and optimise entrenched systems and infrastructures. Developing countries could ‘leapfrog’ inefficient mechanisms and integrate state-of-the-art solutions into their evolving societies.
Companies that implement the solutions will capture part of the potential global savings of ¤600 billion ($946.5 billion), once again showing that tackling climate change is not only good for the climate but good for the economy.
Given the unpredictable nature of technological innovation, there is always uncertainty in estimating future impacts and this report has identified a number of hurdles that must be overcome if the large savings highlighted are to be realised. Furthermore, the ICT sector will have to focus on reducing its direct footprint as the demand for its products and services grows. But this is the first time that the potential of ICT to reduce emissions has been put on the same plane as other climate change solutions, such as carbon capture and storage (CCS).
This sends a clear message to industry leaders and policy makers around the world that, through collaboration, ICT solutions can unlock emissions reductions on a dramatic scale.
To get things moving forward, this report launches our new SMART framework, a guide for developing ICT solutions. Through standards, monitoring and accounting (SMA) tools and rethinking (R) and optimising how we live and work, ICT could be one crucial piece of the overall transformation (T) to a low carbon economy.
The Climate Group, along with GeSI, will be taking the report’s findings to the USA, China, India and Europe to work with decision makers and leading companies to develop a set of scenarios – the vision – focused on how to turn the ideas presented here into a global reality.
Putting a man on the moon was once thought impossible. The next “giant leap for mankind” is within our reach, but only if we act now.
Steve Howard
Report summary
The ICT sector has transformed the way we live, work, learn and play. From mobile phones and micro-computer chips to the internet, ICT has consistently delivered innovative products and services that are now an integral part of everyday life. ICT has systematically increased productivity and supported economic growth across both developed and developing countries. But what impact do pervasive information and
communication technologies have on global warming? Is it a sector that will hinder or help our fight against dangerous climate change?
To answer these questions, this report has quantified the direct emissions from ICT products and services based on expected growth in the sector. It also looked at where ICT could enable significant reductions of emissions in other sectors of the economy and has quantified these in terms of CO2e emission savings and
cost savings.
Aside from emissions associated with deforestation, the largest contribution to man-made GHG emissions comes from power generation and fuel used for transportation. It is therefore not surprising that the biggest role ICTs could play is in helping to improve energy efficiency in power transmission and distribution (T&D), in buildings and factories that demand power and in the use of transportation to deliver goods.
In total, ICTs could deliver
approximately 7.8 GtCO2e of emissions savings
in 2020. This represents 15% of emissions in 2020 based on a BAU estimation. It represents a significant proportion of the reductions below 1990 levels that scientists and economists recommend by 2020 to avoid dangerous climate change1 In economic terms, the ICT-enabled
energy efficiency translates into approximately ¤600 billion ($946.5 billion2) of cost savings.3
It is an opportunity that cannot be overlooked.
Our analysis identifies some of the biggest and most accessible opportunities for ICT to achieve these savings.
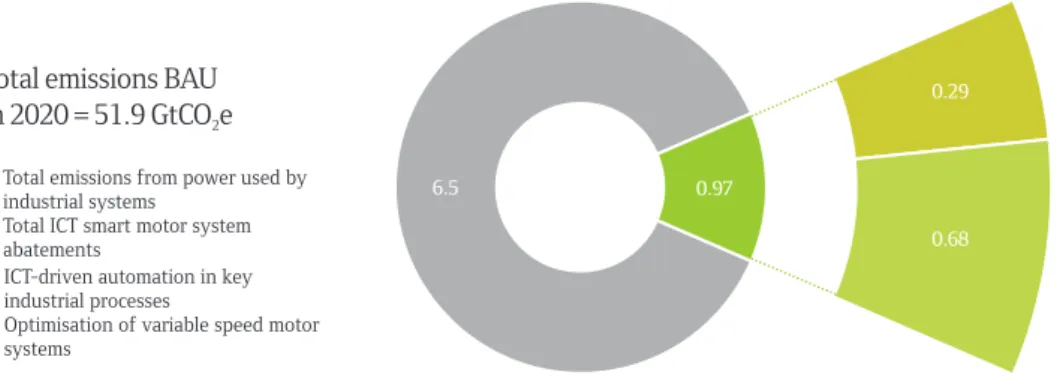
• Smart motor systems: A review of manufacturing in China has identified that without optimisation, 10% of China’s emissions (2% of global emissions) in 2020 will come from China’s motor systems alone and to improve industrial efficiency even by 10% would deliver up to 200 million tonnes (Mt) CO2e savings.
Applied globally, optimised motors and
industrial automation would reduce 0.97 GtCO2e
in 2020, worth ¤68 billion ($107.2 billion).4
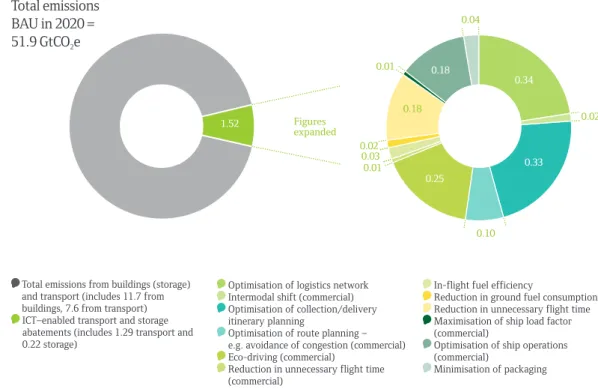
• Smart logistics: Through a host of efficiencies in transport and storage, smart logistics in Europe could deliver fuel, electricity and heating savings of 225 MtCO2e. The global emissions
savings from smart logistics in 2020 would reach 1.52 GtCO2e, with energy savings worth
¤280 billion ($441.7 billion).
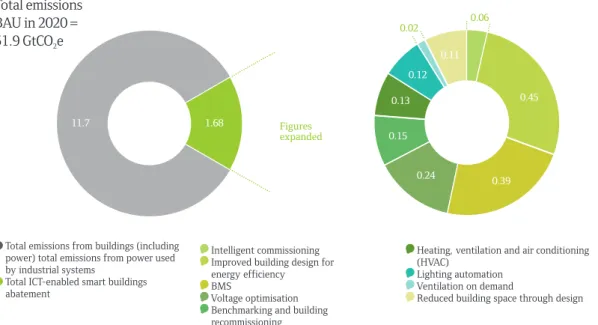
• Smart buildings: A closer look at buildings in North America indicates that better building design, management and automation could save 15% of North America’s buildings emissions. Globally, smart buildings technologies would enable 1.68 GtCO2e of emissions savings, worth
¤216 billion ($340.8 billion).
• Smart grids: Reducing T&D losses in India’s power sector by 30% is possible through better monitoring and management of electricity grids, first with smart meters and then by integrating more advanced ICTs into the so-called energy internet. Smart grid technologies were the largest opportunity found in the study and could globally reduce 2.03 GtCO2e , worth ¤79 billion ($124.6 billion).
1 The Stern Review suggested that developed countries reduce emissions 20-40% below the 1990 levels would be a necessary interim target based on IPCC and Hadley Centre analysis. Source: Stern, N (2008), Key Elements of a Global Deal on Climate Change, London School of Economics and Political Science, http:// www.lse.ac.uk/collections/climateNetwork/ publications/KeyElementsOfAGlobalDeal_ 30Apr08.pdf
2 All currency conversions to US$ based on exchange rate ¤1=$ 1.57757, obtained at http://xe.com on 9th June 2008. 3 Exact figures: ¤553 billion ($872.3 billion) in energy and fuel saved and an additional ¤91 billion ($143.5 billion) in carbon saved, assuming a cost of carbon of ¤20/tonne, for a total of ¤644 billion ($1,015 billion) savings.
4 All value figures here include a cost for carbon of ¤20/tonne. See Appendix 3 for detailed assumptions.
While the sector plans to significantly step up
the energy efficiency of its products and
services, ICT’s largest influence will be by
enabling energy efficiencies in other sectors, an
opportunity that could deliver carbon savings five
times larger than the total emissions from the entire
ICT sector in 2020.
These are not easy wins. There are policy, market and behavioural hurdles that need to be overcome to deliver the savings possible. For example, Chinese factory managers find it difficult to stop producing long enough to implement more efficient industrial processes because they risk losing revenue and competitiveness.
Logistics efficiency is hampered by fragmentation in the market, which makes it difficult to coordinate across the sector to achieve economies of scale. Even with the latest
technologies implemented, buildings are only efficient if managed properly. In India, there is no coordinated national roadmap for smart grid implementation and more needs to be done to build the cross-functional and cross-sectoral capabilities needed to design and implement innovative business and operating models and deliver new technology solutions.
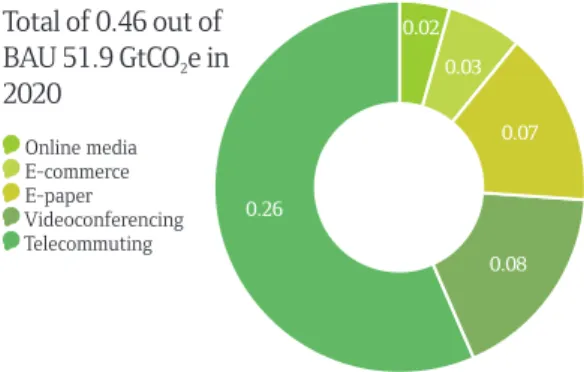
In addition to the savings possible by supporting other sectors to become more energy efficient, there are also potential energy savings from dematerialisation or substitution – replacing high carbon physical products and activities (such as books and meetings) with virtual low carbon equivalents (e-commerce/e-government and advanced videoconferencing). Our study indicates that using technology to dematerialise the way we work and operate across public and private sectors could deliver a reduction of 500 MtCO2e in 2020
– the equivalent of the total ICT footprint in 2002, or just under the emissions of the UK in 2007. However, these solutions would need to be more widely implemented than they are today to realise their full abatement potential.
This is the opportunity the ICT sector has in the fight against climate change. But it does come at a cost. Emissions from the sector are estimated to rise significantly over the coming years – from 0.5 GtCO2e today to 1.4 GtCO2e in 2020 under
BAU growth.5 This growth assumes that the sector
will continue to make the impressive advances in energy efficiency that it has done previously. However, meeting the sheer scale of demand for products and necessary supporting services in emerging markets such as China and India and continuing to deliver the services to increase productivity growth in the developed world will effectively outweigh the adoption of the current wave of efficiency benefits per product or service. There is also the possibility that the speed of introduction and the impact of new ICT technology or the mass adoption of social networking could cut carbon emissions in ways currently impossible to predict.
While the sector plans to significantly step up the energy efficiency of its products and services , ICT’s largest influence will be by enabling energy efficiencies in other sectors, an opportunity that could deliver carbon savings five times larger than the total emissions from the entire ICT sector in 2020.
Getting SMART
The scale of emissions reductions that could be enabled by the smart integration of ICT into new ways of operating, living, working, learning and travelling makes the sector a key player in the fight against climate change, despite its own growing carbon footprint. No other sector can
5 The scope of this analysis includes whole life emissions from PCs and peripherals, data centres, telecoms networks and devices.
supply technology capabilities so integral to energy efficiency across such a range of other sectors or industries.
But with this potential comes responsibility. Emissions reductions in other sectors will not simply present themselves; the ICT sector must demonstrate leadership on climate change and governments must provide the optimum regulatory context. This report outlines the key actions needed.
These actions can be summarised as the SMART transformation. The challenge of climate change presents an opportunity for ICT to first standardise (S) how energy consumption and emissions information can be traced across different processes beyond the ICT sector’s own products and services. It can monitor (M) energy consumption and emissions across the economy in real time, providing the data needed to optimise for energy efficiency. Network tools can be developed that allow accountability (A) for energy consumption and emissions alongside other key business priorities. This information can be used to rethink (R) how we should live, learn, play and work in a low carbon economy, initially by optimising efficiency, but also by providing viable low cost alternatives to high carbon activities. Although isolated efficiency gains do have an impact, ultimately it will be a platform – or a set of technologies and architectures – working coherently together, that will have the greatest impact. It is through this enabling platform that transformation (T) of the economy will occur, when standardisation, monitoring, accounting, optimisation and the business models
that drive low carbon alternatives can be developed and diffused at scale across all sectors of the economy.
The ICT sector can’t act in isolation if it is to seize its opportunity to tackle climate change. It will need the help of governments and other industries. Smart implementation of ICTs will require policy support including standards implementation, secure communication of information within and between sectors and financing for research and pilot projects.
This report demonstrates the potential role the ICT sector could play in mitigating climate change. It is now up to policy makers, industry leaders and the sector itself to make sure this potential is realised. The stakes couldn’t be higher.
The science
As stated in the Intergovernmental Panel on Climate Change’s (IPCC) 2007 Synthesis Report: “Warming of the climate system is unequivocal, as is now evident from observations of increases in global average air and ocean temperatures, widespread melting of snow and ice and rising global average sea level.”6
The global warming debate has now shifted from whether or not man-made climate change is occurring to what atmospheric levels of GHG are “safe” and what can be done to prevent them from exceeding this threshold.
Current BAU scenarios predict that global emissions will rise from 40 GtCO2e
(referred to as both “carbon” and “GHG” emissions in this report) emitted each year in 2002 to nearly 53 GtCO2e annually by 2020.7
Current atmospheric GHG levels stand at 430 parts per million (ppm) and are rising at approximately 2.5ppm every year, leading us beyond levels of 450-500 ppm (roughly twice pre-industrial levels).
The specific figures for what can be considered “safe” are not universally accepted8
and will continue to be debated as new information becomes available. Whichever benchmark is used, the magnitude of cuts required will be challenging.
The economics
Former UK Government and World Bank Chief Economist Lord Stern, author of the Stern Review,9 makes it clear that to ignore
rising carbon emissions that will result in dangerous climate change now will damage economic growth in the future. According to the report, if no action is taken, the overall costs and risks of climate change will be equivalent to losing at least 5% of global gross domestic product (GDP) each year. Not acting now
would incur a wider range of risks and impacts and the estimates of damage could rise to 20% of global GDP or more. In contrast, the costs of action – reducing GHG emissions to avoid the worst impacts of climate change – can be limited to around 1% of global GDP each year.
The review predicts that failure to act today and in the future could cause possibly irreversible economic and social disruption “on a scale similar to those associated with the great wars and the economic depression of the first half of the 20th century”.
Lord Stern has recently joined scientists in outlining the worsening nature of the problem. His report on the economics of climate change should have issued a bleaker warning when it was published 18 months ago, he said recently, “We underestimated the risks... we underestimated the damage associated with the temperature increases... and we underestimated the probabilities of temperature increases.”10
Society currently needs to reduce emissions to about 20 GtCO2e per year by
2050, according to Stern, about two tonnes per person in 2050. Given that the current underlying rate of decrease in carbon intensity, defined as tonnes of carbon dioxide equivalent (tCO2e)/
GDP, is 1% per year and that the world economy continues to grow by 3-4% per year, carbon emissions will continue to grow at 2-3% per year under a BAU scenario. So to reduce emissions by 20 GtCO2e per year, as
recommended by Stern, implies that a dramatic change is needed in production and
consumption profile.11
Both policy makers and industry must initiate the rapid implementation of climate solutions before average global temperatures move beyond a “tipping point” of no return.
01:
The time for change
6 Pachauri, R.K. and A. Reisinger (eds.) (2007) Climate Change 2007: Synthesis Report. Contribution of Working Groups I, II and III to the Fourth Assessment Report of the Intergovernmental Panel on Climate Change, IPCC, Geneva, Switzerland. 7 McKinsey analysis for this report, based on IPCC (2007), Fourth Assessment Report and International Energy Agency (IEA) (2007), World Energy Outlook.
8 Recent analysis suggests that 450ppm may be too high and that we should be aiming to reduce emissions more quickly: King D. and G. Walker (2008), The Hot Topic: How to Tackle Global Warming and Still Keep the Lights On; Hansen J., M. Sato, P. Kharecha, D. Beerling., V. Masson-Delmotte, M. Pagani, M. Raymo, D. Royer and J. Zachos (2008); Target Atmospheric CO2: Where Should Humanity Aim?, http://www. columbia.edu/~jeh1/2008/
TargetCO2_20080331.pdf
9 Stern, N (2006), Executive Summary, Stern Review on the Economics of Climate Change, HM Treasury.
10 Harvey, F and J. Pickard, “Stern takes bleaker view on warming”, Financial Times, 17 April 2008, http://www.ft.com/ cms/s/0/d3e78456-0bde-11dd-9840-0000779fd2ac.html?nclick_check=1 11 Stern, N. (2008), Key Elements of a Global Deal on Climate Change, London School of Economics and Political Science, http:// www.lse.ac.uk/collections/climateNetwork/ publications/KeyElementsOfAGlobalDeal_ 30Apr08.pdf
The political response
Thirty-four countries have signed up to the legally binding Kyoto Protocol, the agreement negotiated via the United Nations Framework Convention on Climate Change (UNFCCC), which sets a target for average global carbon emissions reductions of 5.4% relative to 1990 levels by 2012. Discussions for a post-2012 agreement are currently underway.
Individual regions and countries have also developed their own targets. In 2007, the European Union (EU) announced a 20% emissions reduction target compared to 1990 levels by 2020 and will increase this to 30% if there is an international agreement post-2012.12The UK is
aiming for a reduction of 60% below 1990 levels by 2050, with an interim target of about half that.13Germany is aiming for a 40% cut below
1990 levels by 2020,14 while Norway will become
carbon neutral by 2050. California’s climate change legislation, known as AB 32, commits the state to 80% reductions below 1990 levels by 2050. China’s latest five-year plan (2006-2010) contains 20% energy efficiency improvement targets15 to try to reduce the impact of recent fuel
shortages on its economic growth.
As governments across the world wake up to the urgency of rising temperatures, they are increasingly focusing on how business is responding to both reduce their carbon footprints and to develop and supply the required
innovations for a low carbon world.
What does this mean for business?
Companies must adapt quickly to the political, social, economic and fiscal drive towards a global low carbon economy. Businesses that can turn this challenge into an opportunity, by developing business models to enable adoption of low carbon solutions, will be in a stronger position to mitigate rising carbon emissions and adapt to a world dealing with the impacts of climate change. A radical approach is required that incorporates different ways of thinking, living, working, playing, doing business and developing solutions. Action is no longer an option; it has become an urgent necessity.
What does this mean for the ICT sector?
The terms “the new economy”, “the knowledge economy” and “the information society” all refer to the world’s increasing reliance on ICT to provide services and solutions that ultimately generate
wealth. A number of studies have linked the growth of ICT to global GDP growth and globalisation. One analysis16 suggests that a third
of the economic growth in the Organisation for Economic Cooperation and Development (OECD) countries between 1970 and 1990 was due to access to fixed-line telecoms networks alone, which lowered transaction costs and helped firms to access new markets.
Globally, the ICT sector contributed 16% of GDP growth from 2002 to 2007 and the sector itself has increased its share of GDP worldwide from 5.8 to 7.3%. The ICT sector’s share of the economy is predicted to jump further to 8.7% of GDP growth worldwide from 2007 to 2020.17
In low income countries, an average of 10 more mobile phone users per 100 people was found to stimulate a per capita GDP growth of 0.59%.18 In China, improved communication
has helped increase wealth by driving down commodity prices, coordinating markets and improving business efficiency.19 In Kerala, India,
the introduction of mobile phones contributed on average to an 8% rise in fishermen’s profits and a 4% fall in consumer prices.20
12 EU Spring Summit, Brussels (March 2007).
13 UK Climate Change Bill (April 2008). 14 Germany’s Integrated Energy and Climate Programme (December 2007).
15 China’s 11th Five -Year Economic Plan, www.gov.cn/english/special/115y_index. htm
16 Roeller, Lars H. and L. Waverman (2001), ‘Telecommunications Infrastructure and Economic Growth: A Simultaneous Approach’, American Economic Review, Volume 91, Number 4, pp. 909-23. 17 Analysis includes data from Global Insight (www.globalinsight.com).
18 Waverman, L., M. Meschi and M. Fuss (2005) The Impact of Telecoms on Economic Growth in Developing Countries, Africa: The Impact of Mobile Phones, Vodafone Policy Paper Series 2.
19 Eggleston K., R. Jensen and R. Zeckhauser (2002) ,‘Information and Communication Technologies, Markets and Economic Development’, Discussion Papers Series, 0203, Department of Economics, Tufts University.
20 Jensen R. (2007), ‘The Digital Provide: Information (Technology), Market Performance and Welfare in the South Indian Fisheries sector’, Quarterly Journal of Economics, cited in: Economist, To do with the Price of Fish, 10 May 2007, http:// www.economist.com/finance/displaystory. cfm?story_id=9149142.
21 Member companies of GeSI: Alcatel-Lucent, Bell Canada, British Telecommunications Plc, Cisco Systems, Deutsche Telekom AG, Ericsson, European Telecommunication Network Operators Association (ETNO), France Telecom, Fujitsu Siemens Computers, Hewlett-Packard, Intel, KPN, Motorola, Microsoft, Nokia, Nokia Siemens Networks, Nortel, Sun Microsystems, Telecom Italia, Telefónica SA, US Telecom Association, Verizon, Vodafone Plc.
Associate members: Carbon Disclosure Project (CDP), WWF.
Supporting organisations: ITU, Telecommunication Development Bureau, UNEP Division of Technology, Industry and Economics.
Scope, process and methodology
The study was undertaken by a unique partnership between not-for-profit
organisation The Climate Group and ICT sector group GeSI.21 The supporting analysis was
conducted independently by international management consultants McKinsey & Company. Input was provided by GeSI member companies and the global experts consulted for each of the case studies.
The combined knowledge and experience of this group has enabled us to identify and quantify specific ICT impacts and opportunities, in the context of carbon emission savings and potential economic value. In addition, the analysis drew on additional data from the ICT companies involved in the study. It estimated the likely growth of the ICT sector’s carbon footprint and, more importantly, the carbon emissions savings and business opportunities that are possible when ICT is deployed across the economy. A detailed methodology can be found in Appendix 1.
This demonstrates that the ICT sector continues to play a vital role in the growth of the global economy and international development. As the imperative to develop zero carbon growth solutions becomes stronger, society needs to lower emissions while continuing to serve the needs of people in emerging economies, to develop poverty reduction schemes and enable multiple sectors across the world. What, therefore, are the next steps for ICT? Could it apply its creativity and skills to help reduce carbon emissions by massively enabling efficiency or behaviour change? How big an impact could it have? And how will that affect its carbon footprint?
The SMART way
In order to understand and compare the direct impact of ICT products and services and its enabling role in climate change solutions, the analysis set out to answer three main questions: 1. What is the direct carbon footprint of the
ICT sector?
2. What are the quantifiable emissions reductions that can be enabled through ICT applications in other sectors of the economy?
3. What are the new market opportunities for ICT and other sectors associated with realising these reductions?
Because of growth in demand for its products and services, mainly from emerging economies and the rapid adoption in the developed world, the ICT sector’s own carbon footprint is likely to grow under BAU conditions to 1.4 GtCO2e by 2020,
three times what it was in 2002. Chapter 2 looks at the reasons for this growth and assesses what can be done to reduce it and the hurdles that need to be overcome for the sector to attain maximum efficiency.
In order to approach the second and third questions, it was important to know which sectors are responsible for producing the highest levels of carbon emissions and therefore where ICT might enable reductions. Of the total emissions from human activity in 2002, 24% was from the power sector, 23% from industry, 17% from agriculture and waste management, 14% from land use, 14% from transport and 8% from buildings. Taking another view of the same data – at the point where electricity is consumed and fuel is used – sharpens the focus further. In 2005, manufacturing was 33% of end-use energy consumption, transport was 26% and households 29% (other services and construction made up the final 12%).22
The findings of the analysis are highly illuminating. Because of its pervasiveness, ICT is a key, though often unrecognised enabling infrastructure in the global economy. The sector can enable smart development opportunities for CO2e reductions and participate in the new
sources of value of low or zero carbon solutions markets at the same time as restricting the growth of its own carbon footprint.
Even as the sector tackles its own carbon footprint, the need to mitigate climate change presents opportunities for ICT to deliver low carbon energy efficiency solutions. The sector has a unique ability to make energy consumption and GHG emissions visible through its products and services. Radical transformation of
infrastructure is possible only if it is known where inefficiency occurs throughout the processes and workflows of various sectors in the economy. ICT can provide the data, which can be used to change behaviours, processes, capabilities and systems. Although isolated efficiency gains do have an impact, ultimately it will be a platform – or a set of technologies – working coherently together that will have the greatest impact.
22 IEA (2008), Worldwide Trends in Energy Use and Efficiency: Key Insights from IEA Indicator Analysis, IEA/OECD, Paris.
This report has identified global emissions reductions of 7.8 GtCO2e in 2020, five times its
own footprint (Fig.1).
The ICT sector can enable emission reductions in a number of ways:
• Standardise: ICT can provide information in standard forms on energy consumption and emissions, across sectors
• Monitor: ICT can incorporate monitoring information into the design and control for energy use
• Account: ICT can provide the capabilities and platforms to improve accountability of energy and carbon
• Rethink: ICT can offer innovations that capture energy efficiency opportunities across buildings/homes, transport, power, manufacturing and other infrastructure and provide alternatives to current ways of operating, learning, living, working and travelling
• Transform: ICT can apply smart and integrated approaches to energy management of systems and processes, including benefits from both automation and behaviour change and develop alternatives to high carbon activities, across all sectors of the economy.
In Chapter 3, the report looks at five of the most important “levers” or mitigation opportunities: dematerialisation; smart motor systems in China; smart logistics in Europe; smart buildings in North America; and smart grids in India. It considers the impact of ICT on local and global emissions, where ICT could have the most influence on emissions reductions, current markets, regulatory context and hurdles that need to be overcome if its potential to reduce emissions is to be realised.
In parallel with the ICT reducing its own carbon footprint, governments need to do more to create a fiscal and regulatory
environment that will encourage faster and more widespread adoption of ICT. Crucially, new partnerships between governments and the private sector are required. Chapter 4 develops a framework for understanding the enabling opportunity of ICT solutions.
Fig. 1 ICT impact: The global footprint and the
enabling effect
GtCO2e Emissions
ICT footprint
Selected ICT-enabled abatements
Other abatements†
2002
2020 with abatements Abatements 2020 BAU
40.0 ICT 0.5
51.9 ICT 1.4
* For example, avoided deforestation, wind power or biofuels.
† 21.9 GtCO2e abatements were identified in the McKinsey abatement cost curve and from estimates in this study. Source: Enkvist P., T.
Naucler and J. Rosander (2007), ‘A Cost Curve for Greenhouse Gas Reduction’, The McKinsey Quarterly, Number 1. - 7.8
-14.1*
30†
Five times ICT’s direct footprint
02:
Taking direct action
In 2007, analyst Gartner released the statistic that the ICT sector was responsible for 2% of global carbon emissions23 and this figure has since been
widely cited. The analysis conducted for this report came to similar conclusions. This chapter sets out in some detail how today’s 2% figure was calculated and the assumptions behind the growth in emissions expected in 2020, taking into account likely efficient technology developments that affect the power consumption of products and services, or their expected penetration in the market in 2020. Not all technology developments can be predicted and therefore further possible abatements are discussed, but not calculated. The chapter concludes with a brief section on what more could be done.
In 2007, the total footprint of the ICT sector – including personal computers (PCs) and peripherals, telecoms networks and devices and data centres – was 830 MtCO2e, about 2% of the
estimated total emissions from human activity released that year. Even if the efficient technology
developments outlined in the rest of the chapter are implemented, this figure looks set to grow at 6% each year until 2020. The carbon generated from materials and manufacture is about one quarter of the overall ICT footprint, the rest coming from its use (Fig. 2.1).
Although there is expected growth in mature developed markets, the most significant growth is attributable to increasing demand for ICT in developing countries (Fig. 2.2). Just one in 10 people owns a PC in China today; by 2020, that will rise to seven in 10, comparable to current ownership rates in the US. In just 12 years’ time, one in two Chinese people will own a mobile phone and half of all households will be connected by broadband. It will be a similar story in India. By 2020, almost a third of the global population will own a PC (currently one in 50), 50% will own a mobile phone and one in 20 households will have a broadband
connection.24 Considering that the populations
of China and India are currently 1.3 billion25 and 23 Gartner, Green IT: The New Industry
Shockwave, presentation at Symposium/ ITXPO conference, April 2007.
24 Of course a range of figures are possible, but the report took a BAU scenario with the best information available from companies and public sources. See Appendix 1 for detailed methodology and Appendix 2 for the direct footprint assumptions. 25 CIA (2007): World Factbook website, https://www.cia.gov/library/publications/ the-world-factbook/print/ch.html
Embodied carbon Footprint from use
CAGR†
+6%
Fig. 2.1 The global ICT footprint*
GtCO2e
*ICT includes PCs, telecoms networks and devices, printers and data centres.
†Compounded annual growth rate.
2% of total footprint
0.41
2002
2020 2007
1.43
0.35 1.08
0.83
0.18 0.64
0.53
1.1 billion respectively,26 that consumption
in the Indian economy is expected to quadruple in the next four years and that the middle class in China is expected to grow to over 80% of the population by 2020,27 these are potentially
huge growth areas.
By 2020, when a large fraction of developing countries’ populations (up to 70% in China) will be able to afford ICT devices and will have caught up with developed countries’ ownership levels, they will account for more than 60% of ICT’s carbon emissions (compared to less than half today), driven largely by growth in mobile networks and PCs. But these are not the fastest-growing elements of the footprint. Despite first-generation virtualisation and other efficiency
measures, data centres will grow faster than any other ICT technology, driven by the need for storage, computing and other information technology (IT) services. Though the telecoms footprint continues to grow, it represents a smaller share of the total ICT carbon footprint in 2020 as efficiency measures balance growth and as data centres rise to take a larger share of the total
(Fig. 2.3).
The analysis below took a deeper look at three main areas of the direct footprint: PCs and peripherals, data centres, telecoms networks and devices, outlined below. Appendix 1 provides more information about what was included in the scope of the analysis and Appendix 2 outlines the assumptions behind each in more detail.
26 Ibid.
27 McKinsey Global Institute China Consumer Demand Model, V2.0.
* RoW = Rest of the world. (includes India, Brazil, South Africa, Indonesia and Egypt) † EiT = Economies in transition. (includes Russia and non-OECD Eastern European countries)
% of 1.43 % of 0.83
% of 0.53
CAGR %
Other industrialised countries OECD Europe US and Canada RoW*
China EiT†
9 9 6 3 4 3
Fig. 2.2 The global ICT footprint by geography
% of GtCO2e
2002
2020 2007
17 18 11 13 16 25
27 29 10 7 12 14
23 23 12 10 14 20
Fig. 2.3 The global footprint by subsector
Emissions by geography % of GtCO2e
5 7 5
2002
CAGR % 2020 2007
* Printers were 11% of the total ICT footprint in 2002, 8% in 2007 and will be 12% in 2020.
Telecoms infrastructure and devices
Data centres
PCs, peripherals and printers*
28 14 57 % of 0.53
25 18 57 % of 1.43
28 Printers were included in the overall analysis of the ICT footprint, but are not broken down further in this section. 29 Analysis includes data from Shiffler, G III. (2007), Forecast: PC Installed Base Worldwide, 2003-2011, Gartner.
PCs and peripherals
In the developed world today, PCs (workstations, desktops and laptops) are almost as ubiquitous in people’s homes as televisions (TVs). This is not yet the case in the developing world, but the explosion in the number of internet cafés demonstrates that the demand is there. Growing middle classes in emerging economies, whose newfound wealth will allow them to start buying PCs at developed country rates, will substantially increase the global carbon footprint of these technologies.
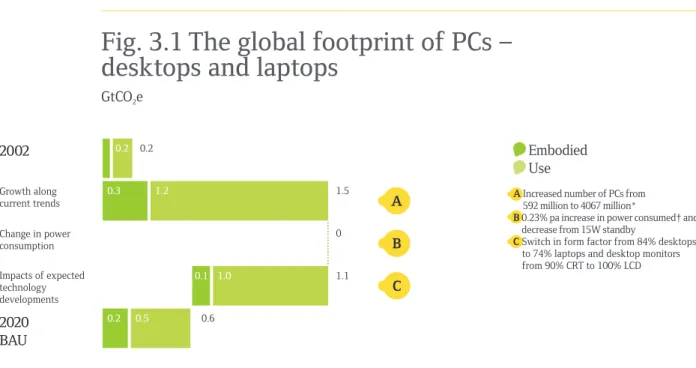
In 2002, the PC and monitors’ combined carbon footprint28 was 200 MtCO
2e
and this is expected to triple by 2020 to 600 MtCO2e – a growth rate of 5% per annum
(pa) (Fig. 3.1).
Calculating the PC footprint in 2020
The number of PCs globally is expected to increase from 592 million in 2002 to more than four billion in 2020. Row A of Fig. 3.1. shows the expected footprint if this growth used today’s PC technology. Since 1986, the power demand for PCs has only increased at 0.23% pa, a low rate considering there has been a 45% pa improvement in computational power. This success has been achieved by the exploitation of multi-core processors and more efficient power supply units. By 2020, further advances in power management
are expected to compensate for the increase in PC computing demand, represented by Row B, so that overall power consumption is not expected to grow.
However, two major technology developments are expected by 2020. First, the desktop PCs that dominate today’s market (84%) will be largely replaced by laptops if adoption materialises as forecasted – by 2020, 74% of all PCs in use will be laptops. Second, all cathode ray tube (CRT) screens will be replaced by low energy alternatives, such as liquid crystal display (LCD) screens, by 2020. These two factors explain the reduction in carbon footprint in Row C.
Taking Rows A, B and C together shows that the 2020 footprint will rise to three times the emissions in 2002.29
By 2020, laptops will have overtaken desktops as the main source of emissions
(Fig. 3.2) and will make up the largest portion (22%) of the global ICT carbon footprint. Desktops with LCD monitors will represent 20% of the total ICT footprint in 2020, an increase of 16% since 2002.
Reducing PC emissions further
To reduce the total carbon emissions of PCs predicted for 2020 to below 2002 levels would require a 95% efficiency improvement in the overall impact from PCs. This cannot only be
Fig. 3.1 The global footprint of PCs –
desktops and laptops
GtCO2e
Embodied Use
A Increased number of PCs from 592 million to 4067 million*
B 0.23% pa increase in power consumed† and decrease from 15W standby
C Switch in form factor from 84% desktops to 74% laptops and desktop monitors from 90% CRT to 100% LCD 2002
2020 BAU Growth along current trends
Impacts of expected technology developments Change in power consumption
* Based on Gartner estimates until 2011 and trend extrapolation to 2020. † Based on McManus, T. (2002), Moore’s Law and PC Power, presentation
to Tulane Engineering Forum. 0.2
0.2
0 1.5
1.2 0.3
1.1
0.1 1.0
0.6
Fig. 3.2 Composition of the PC footprint
MtCO2e
2002
100% = 247 MtCO2e
Laptops (6 MtCO2e)
Desktops with LCD monitors (16 MtCO2e)
Desktops with CRT monitors (226 MtCO2e)
Desktops with CRT monitors represented 44% of the total ICT footprint (91% of 49%). Desktops with LCD monitors and laptops represented 4% of the total ICT footprint (8% of 49%).
2020
100% = 643 MtCO2e
Desktops with CRT monitors (0 MtCO2e)
Laptops (333 MtCO2e)
Desktops with LCD monitors (309 MtCO2e)
Laptops will represent 22% of the total ICT footprint (52% of 42%).
Desktops with LCD monitors will represent 20% of the total ICT footprint (48% of 42%).
48% 52%
Fig. 4.1 The global data centre footprint
MtCO2e
2002
2020 BAU Growth along current trends Power consumption
Embodied Use
A Increased number of servers and their necessary power and cooling from 18 million to 122 million*
B No increase in power consumption due to new generation technologies across server classes†
C Savings from expected adoption of measures (27% efficiency due to virtualisation and 18% due to smart cooling and broad operating temperature envelope)
*Based on IDC estimates until 2011 and trend extrapolation to 2020, excluding virtualisation. †Power consumption per server kept constant over time.
76
259
349 0 166 Impacts of expected
technology developments
91%
2%
achieved by a combination of increased energy efficiency and longer product life alone, but will necessitate changes comparable in scale to that enabled by the shift from desktops to laptops.
There could also be breakthrough technologies around the corner that would transform how PCs use energy. Examples include solid state hard drives, which could reduce energy consumption by up to 50%, choleristic LCD screens that reduce monitor energy consumption by up to 80% and direct methanol fuel cells that can deliver 20% savings for power supplies.
Other areas of research such as quantum and optical computing could also have a substantial impact. These have not been factored into the carbon emission calculations because their impact within the timeframe is uncertain.
Data centres
In the “information age” there is a vast amount of data that is stored and instantly made available upon request. Users of these data range from companies complying with the recent Sarbanes– Oxley accounting data legislation to consumers watching YouTube videos, to the processing and storage capabilities required for climate change modelling. This has led to a vast increase in the number of data centres – buildings that house a
collection of servers, storage devices, network equipment, power supplies, fans and other cooling equipment – which provide information at our fingertips, supplying business, government, academia and consumers around the world.
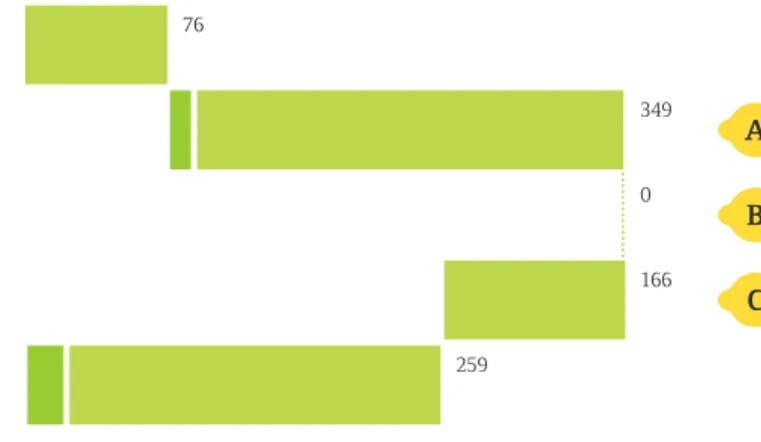
In 2002, the global data centre
footprint, including equipment use and embodied carbon, was 76 MtCO2e and this is expected to
more than triple by 2020 to 259 MtCO2e – making
it the fastest-growing contributor to the ICT sector’s carbon footprint, at 7% pa in relative terms (Fig. 4.1).
Calculating the data centre footprint in 2020
If growth continues in line with demand, the world will be using 122 million servers in 2020, up from 18 million today. In addition to this 9% pa increase in server numbers, there will be a shift from high-end servers (mainframes) to volume servers,30 the least expensive kind of server that
can handle much of the computational needs of businesses. Row A of Fig. 4.1 shows the increase in footprint that would be expected by simply scaling up today’s data centre technology without the application of virtualisation technologies in data centres.
Power consumption differs by server type but, like PCs, no increase in overall
30 This category includes blade servers. 31 Assessments based on data made available by GeSI companies for the purposes of this report.
32 The net zero increase shown in Row B is due to the adoption of volume servers that incorporate technologies such as multi-core/multi-threading microprocessors with more sophisticated power-state sensing and management. Additionally, the rapid adoption of newer processor micro-architectures has refreshed the installed base of servers with a more power-efficient silicon transistor technology.
33 IDC analysis predicts 83 million servers will be needed in 2020 if virtualisation effects are included.
Fig. 4.2 Composition of data centre footprint
Global data centre emissions %
2002
100% = 76 MtCO2e
Volume servers (27 MtCO2e)
Cooling systems (24 MtCO2e)
Power systems (13 MtCO2e)
Mid-range servers (5 MtCO2e)
Storage systems (4 MtCO2e)
High-end servers (2 MtCO2e)
Volume servers represented 5% of the total ICT footprint (36% of 14%).
Data centre cooling systems represented 4% of the total ICT footprint (32% of 14%).
2020
100% = 259 MtCO2e
Volume servers (136 MtCO2e)
Cooling systems (70 MtCO2e) Power systems
(62 MtCO2e)
Storage systems (18 MtCO2e)
High-end servers (5 MtCO2e)
Mid-range servers (2 MtCO2e)
Volume servers will represent 9% of the total ICT footprint (52% of 18%). Data centre cooling systems will represent 4% of the total ICT footprint (21% of 18%).
52% 18% 21% 7% 1% 1% 17% 36% 32% 6% 5% 3%
consumption is expected in the coming years, in spite of increased processing demand.31
This is due mainly to new technologies in all types of servers32 and explains the net zero
change in Row B.
A major trend driving down the overall growth in the footprint of data centres (Row C) is virtualisation – pooling assets such as computing and storage where utilisation is low, so they can be used across the enterprise and beyond. Virtualisation represents a radical rethinking of how to deliver the services of data centres, pooling resources that are underutilised and could reduce emissions by 27% – equivalent to 111 MtCO2e.33 Technologies are also available to
detect where within the data centre temperatures are running high and to direct cooling to those areas thus delivering a 12% reduction in cooling costs. By 2020, the analysis predicted that these measures could achieve an approximate 18% reduction (55 MtCO2e) in consumption.
Only about half of the energy used by data centres powers the servers and storage; the rest is needed to run back-up, uninterruptible power supplies (5%) and cooling systems (45%).34
There are a number of ways to reduce this energy overhead, some of which are expected to be adopted by 2020. The simplest way is to turn
down the air conditioning. Similarly, in climates where the outside temperature allows, simply directing external air into the data centre can save cooling costs for much of the year. By allowing the temperature of the data centre to fluctuate along a broader operating temperature range, a 24% reduction in energy consumption from cooling is possible. Distributing low voltage direct current (DC) into the data centre would eliminate the need for mechanical back-up, uninterruptible power supply units.
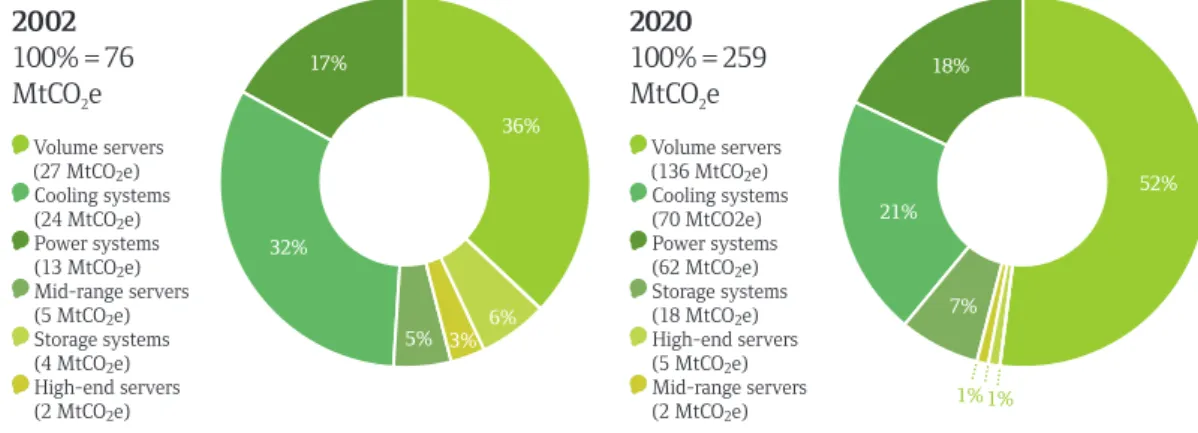
By 2020, the net footprint for data centres is predicted to be 259 MtCO2e. At this
point, volume servers will represent more than 50% of the data centre footprint (174 MtCO2e)
and cooling systems for data centres alone will amount to 4% of the total ICT footprint (Fig. 4.2).
Reducing data centre emissions further
Additional emission reductions not included in the current 2020 BAU scenario are possible. Complete adoption of the cooling technologies noted above would result in additional savings of 65 MtCO2e in 2020.
Higher adoption rates of virtualisation architectures and low energy cooling would help achieve step changes in efficiency. Current utilisation rates of servers, storage and other
34 Estimates based on Koomey, J.G. (2007), Estimated Total Power Consumption by Servers in the U.S. and the World, http://enterprise.amd.com/Downloads/ svrpwrusecompletefinal.pdf.
35 Uptime Institute and McKinsey & Company (2008), Revolutionizing Data Center Efficiency—Key Analyses, http:// uptimeinstitute.org/content/view/168/57
Fig. 5 Global telecoms footprint
(devices and infrastructure)
Global telecoms emissions %
2002
100% = 151 MtCO2e
Mobile (66 MtCO2e)
Fixed narrowband (64 MtCO2e)
Telecom devices (18 MtCO2e)
Fixed broadband (4 MtCO2e)
Mobile phones represented 3% of the total ICT footprint (11% of 30%).
Fixed broadband represented 1% of the total ICT footprint (3% of 30%).
2020
100% = 349 MtCO2e
Mobile (179 MtCO2e)
Fixed narrowband (70 MtCO2e)
Telecom devices (51 MtCO2e)
Fixed broadband (49 MtCO2e)
Mobile phones will represent 1% of the total ICT footprint (6% of 25%)
Mobile networks will represent 13% of the total ICT footprint (51% of 25%) Fixed broadband will represent 4% of the total ICT footprint (14% of 25%)
91% 12%
42% 43%
3%
15%
20%
51%
36 Green Grid data centre efficiency metrics such as power usage effectiveness (PUE) and data centre infrastructure efficiency (DCiE) can help operators improve efficiency and reduce costs, http://www. thegreengrid.org/
37 Cable accounts providing broadband but not cable TV.
38 Mobile analysis includes both voice and data. It includes a range of existing technologies, GSM, CDMA, EDGE, 3G, etc.
assets in the data centre worldwide are low (6% average server utilisation, 56% facility utilisation) and vary dramatically depending on the installation.35 If, for example, a 20%
reduction below 2002 emission levels were to be achieved, this would entail an increase in efficiency of 86% globally. Though it may be possible to achieve 86% efficiency in one data centre by more efficient virtualisation architectures and changing the data centre location to reduce cooling needs, adoption of best practice has its challenges. And, although the cost of energy is high, companies are not often organised so that the person paying for the IT equipment is also paying for the energy consumption of that equipment.
However there is a significant consolidation trend that may help in dealing with the existing or legacy data centre impact. Also, organisational attitudes are changing as costs of operating a data centre surpass the initial investment in equipment and as the data centre operation becomes a larger share of a company’s overall energy costs. Companies now have a number of options for computing services, which shift costs from the enterprise to an external provider that can potentially deliver these capabilities with economies of scale and at higher energy efficiency. The “software as a service” business model allows companies to access key enterprise applications such as customer relationship management databases or collaboration tools via a web browser, with no need to host their own data centre facilities. Companies can also pay to use server space on demand to build their own applications and websites, the way one would pay monthly for electricity or water, known as “utility
computing”. These are both simple examples of what is more generally called “cloud computing”, centralised and highly scalable services that could lead to further capacity to virtualise or consolidate resources with breakthrough gains in energy efficiency.
Predicting the pace and intensity of these virtualisation trends is difficult, but the industry is well aware of the huge efficiency opportunity. Initiatives such as the Green Grid, a global consortium dedicated to data centre efficiency and information service delivery, working towards new operating standards and best practices, has attracted support from the industry.36
Telecoms infrastructure and devices
Increased mobile phone and internet use over the past few years has driven a parallel increase in telecoms infrastructure. Fixed-line,
narrowband and voice accounts are expected to remain fairly constant overall, but the number of broadband accounts – operated by both telecoms and cable operators37 – will more than
double 2007-2020 and mobile accounts38 will
almost double during the same period. From 2002, the growth in telecoms emissions has grown from 150 MtCO2e in 2002 to 300 MtCO2e
in 2007 and is expected to reach 350 MtCO2e
in 2020.
The relative share of telecoms devices remains fairly constant, but the mobile network will come to dominate the overall telecoms footprint by 2020 (Fig. 5).
Telecoms devices
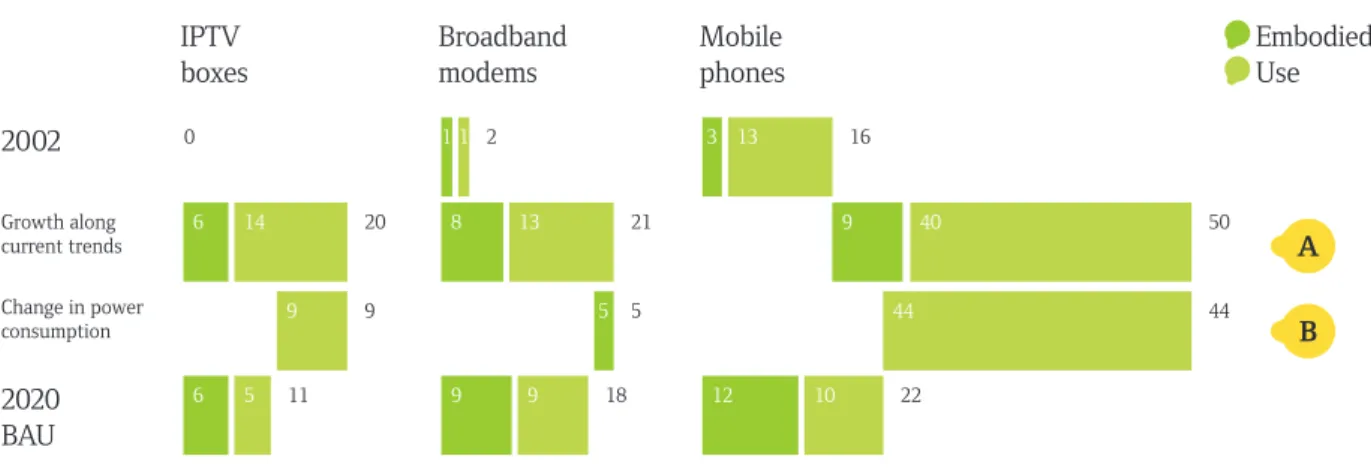
The use of mobile phones, chargers, internet protocol TV (IPTV) boxes and home broadband routers is set to increase over the next 12 years, due in the most part to growth in China and India, where the middle classes will catch up with the current telecoms penetration of developed countries. The telecoms devices global footprint was 18 MtCO2e in 2002 and is expected to
increase almost threefold to 51 MtCO2e by 2020,39
driven mainly by rises in the use of broadband modems/routers and IPTV boxes, which will expand from a small user base (Fig. 6).
Calculating the telecoms devices’ footprint in 2020
In 2002, there were 1.1 billion mobile accounts. This is set to increase to 4.8 billion in 2020 and is the largest source of global telecom footprint emissions. Increased access to broadband will also have an impact – the number of routers will grow from 67 million in 2002 to 898 million in 2020. Increasingly, broadband is also accessed over IPTV boxes. Although none of these was sold in 2002, if current trends continue 385 million may be in use by 2020.40 The total impact of these increases
is set out in Row A of Fig. 6.
The majority of emissions from mobile devices come from standby mode, the power (sometimes known as phantom power) used by chargers that are plugged in but not in use.
Unlike PCs and data centres, the overall consumption of telecoms devices is set to decrease over the 2020 timeframe because “smart chargers”
(those that turn off when a device is not
connected) and 1W (or lower) standby standards are rapidly becoming commonplace. The footprint of mobile phones therefore increases 4%, given that a sharp decrease in charger consumption offsets the growth in number of accounts. Broadband routers and IPTV boxes increase their footprint comparatively more thanks to higher penetration from a small base today (Row B).
Mobile phones will contribute a smaller share of the telecoms devices’ footprint in 2020, if predicted power consumption reductions from smart chargers and standby modes materialise.
Reducing telecoms devices’ emissions further
The footprint of telecoms devices can be reduced further if devices produce fewer emissions in manufacturing, or if less – and greener –
electricity is used by the device during its lifetime. Attractive offers that allow service upgrades without trading the phone in are already increasing the life of the mobile device itself. Some companies have announced that they will experiment with more custom ordering of phones, so that only the requested features are built into the physical device, lowering the carbon emissions that are due to manufacturing.
Telecoms infrastructure
As the demand for telecoms devices grows so, inevitably, will the need for the infrastructure that supports it. This growth is due not only to increases in the number of broadband and mobile accounts in emerging economies, but is also to the sharing of videos and games and other peer-to-peer content exchange.
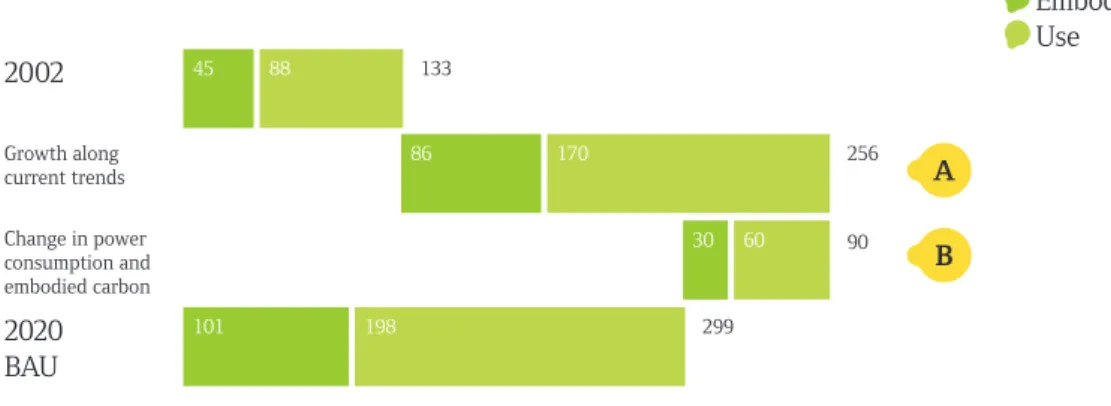
The telecoms infrastructure footprint, including ongoing energy use and carbon embodied in the infrastructure, was 133 MtCO2e
in 2002. This is expected to more than double to 299 MtCO2e by 2020, a growth rate of 5% pa41
(Fig. 7).
Calculating the telecoms infrastructure footprint in 2020
A key contributor to carbon emissions in 2020 will be mobile networks, driven largely by the increase in base stations and mobile switching centres. However, emissions from networks cannot be calculated based on the hardware used in the network alone, nor were data available from each provider on specifically how much energy their networks consumed. Therefore, the analysis used the reported energy consumption of eight telecoms providers and the increased number of mobile, fixed and broadband accounts – from 2.3 billion in 2002 to 7 billion in 2020 –
39 Analysis included data from; Schaefer C., C. Weber and A. Voss (2003), ‘Energy usage of mobile telephone services in Germany’, Energy, Volume 28, Issue 5, pp 411-420; Bertoldi, Paulo (2007), European Code of Conduct for Broadband Equipment, European Commission DG JRC, http:// www.itu.int/dms_pub/itu-t/oth/09/05/ T09050000010004PDFE.pdf
40 Figures based on Yankee Group and IDC estimates and McKinsey trend extrapolation. Embodied carbon from manufacturing and distribution estimated from manufacturer studies for mobile phones and from laptop comparisons for other devices.
Embodied Use
Fig. 6 The global telecoms devices footprint
MtCO2e
2002 IPTV boxes Broadband modems Mobile phones 9 40 44 Growth along current trends 2020 BAU 44 50 Change in power
consumption
0 1 1 2
5 16 22 13 10 3 20 9 11 14 9 5 6 21 5 13 8 18 9 9 6 12
A Increased number of mobiles 1.1 billion to 4.8 billion, routers from 67 million to 898 million and IPTV boxes from 0 to 385 million