Anatase TiO
2Single Crystals Exposed with High-Reactive {111}
Facets Toward Efficient H
2Evolution
Hua Xu,†,‡,§ Pakpoom Reunchan,‡,‖ Shuxin Ouyang,*,‡ Hua Tong,⊥
Naoto Umezawa,‡,⊥,#
Tetsuya Kako,†,‡,§ and Jinhua Ye*,†,‡,§,⊥
†
Graduate School of Chemical Science and Engineering, Hokkaido University, Sapporo 060-0814, Japan ‡
Environmental Remediation Materials Unit and §International Center for Materials Nanoarchitectonics (WPI-MANA), National Institute for Materials Science (NIMS), 1-1 Namiki, Tsukuba 305-0044, Japan
‖
Department of Physics, Faculty of Science, Kasetsart University, Bangkok 10900, Thailand
⊥
TU-NIMS Joint Research Center, School of Materials Science and Engineering, Tianjin University, 92 Weijin Road, Nankai District, Tianjin 300072, P.R. China
#
PRESTO, Japan Science and Technology Agency (JST), 4-1-8 Honcho Kawaguchi, Saitama 332-0012, Japan
Supporting Information
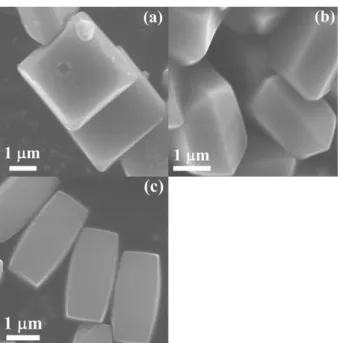
Figure S2. The SEM images of the TiO2 samples. (a) T001, (b) T101, and (c) T010.
The average percentages of {001}, {101}, and {010} facets were calculated to be (40% {001}, 60% {101}, 0% {010}), (24% {001}, 76% {101}, 0% {010}), and (14% {001}, 33% {101}, 53% {010}) for T001, T101, and T010, respectively.[1]
Figure S3. The XRD patterns of the TiO2 precursors (a) TCN, (b) TF, (c) T111, and the
related samples after calcination (d) TCN, (e) TF, (f) T111, respectively.
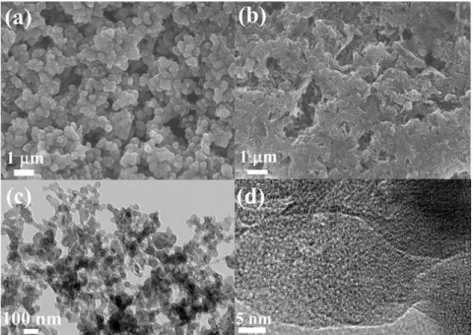
Figure S4. The SEM images of TCN (a) and TF (b), as well as the TEM images of
the precursor of T111 (c, d).
In order to verify the effects of the stabilizers of both F- and ammonia, two control experiments in the absence of F- or ammonia were conducted. The synthetic procedure was similar to that of T111, but with different starting reagents. In the first
As shown in Figure S3, the XRD patterns are indexed to be weak-crystalline rutile TiO2 and TiOF2 (JCPDS No. 77-132) for the TiO2 precursors synthesized without F
-or ammonia, respectively (Figure S3). After the heating treatment at 500 oC for 2 h, the XRD patterns of the two samples (TCN and TF) are all indexed to anatase TiO2
(JCPDS No. 71-1167) but different in crystallinity. The morphology of the two TiO2
samples is observed by the SEM images (Figure S4). For the Cl-instead-F TiO2 (TCN),
there are some sphere-like aggregates consisted of small nanoparticles (Figure S4a), while only some irregular aggregates of nanoparticles can be observed for the TiO2
prepared without ammonia (TF) as shown in Figure S4b. No square-plates can be detected in the two TiO2 samples (TCN and TF). Moreover, to elucidate the formation
process of the {111} facet exposed TiO2, the precursor of the {111} exposed TiO2 is
collected. The precursor (TFN) existed in the form of (NH4)2(TiF4O) (JCPDS No.
82-1330) (Figure S3) with the morphology of irregular nanoparticles connected with each other (Figure S4c), and the connection interface can be further observed clearly by the high magnified TEM image (Figure S4d). Although we could not understand the exact growth mechanism, we would like to propose that both F anions and ammonia together played the important role to adsorb on the crystal facet of TiO2
during the first crystallization process to form Ammonium Titanium Oxide Fluoride (NH4)2(TiF4O), then after a calcination process, left the TiO2 plates with exposed {111}
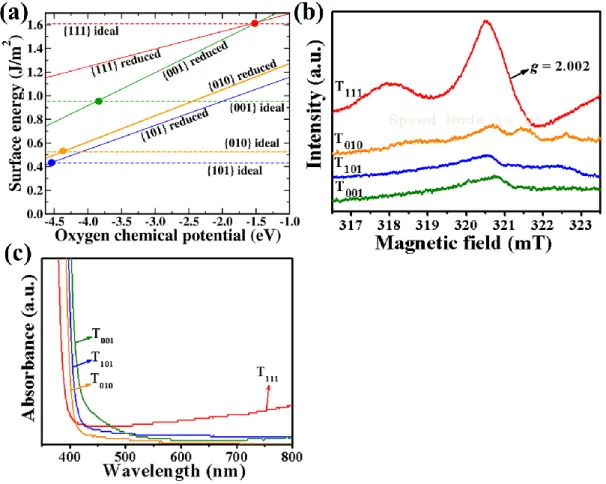
Figure S5. (a) Surface energies of reduced and ideal surfaces of {111}, {001}, {010}, and {101} facets. (b) EPR spectra of the TiO2 samples (T111, T001, T010, and T101). (c)
UV-visible absorption spectra of the TiO2 samples (T111, T001, T010, and T101) in the
enlarge range of 350-800 nm.
As shown in Figure S5c, the UV-visible absorption spectra were enlarged in order to observe the differences among the four TiO2 samples in the range of 500-800 nm
more clearly.Compared with the other three TiO2 samples (T010, T101, and T001), T111
exhibits stronger absorption beyond 500 nm up to the infrared range, which is resulted from the existence of oxygen vacancy. Because the concentration of oxygen vacancy is low, we can only observe a slight slope.
Figure S6. (a) EPR spectra of T111 (treated in the air atmosphere) in comparison with
that of TO2 (T111 treated in the O2 atmosphere). (b) Comparison of XRD patterns
between T111 and TO2. (c) UV-visible absorption spectra of the TiO2 samples (T111 and
TO2). (d) Comparison of photocatalytic activities between T111 and TO2 under
UV-visible light irradiation ( > 300 nm).
As shown in Figure S6b, the slightly better crystallinity of TO2 is resulted from the
oxygen-rich heat-treatment environment than that of T111.
As shown inset of Figure S6c, the slightly higher absorption in the range of 500-800 nm for T111 is ascribed to the small amounts of oxygen vacancy existed on
the T111 surface.
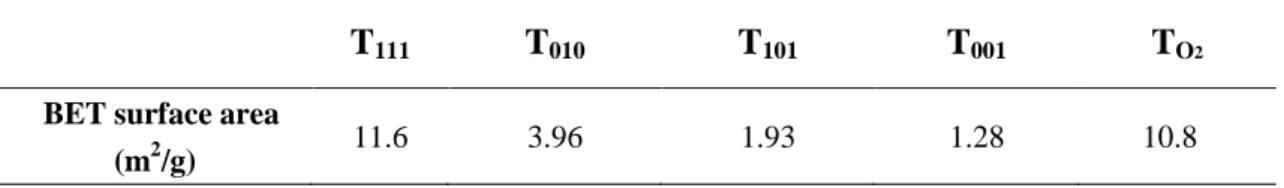
Table S1. BET surface areas of the prepared TiO2 samples.
T111 T010 T101 T001 TO2
BET surface area