Commodity currencies: Australian dollar
The Dukascopy Bank research department continues its research on commodity currencies. In the first issue we have established that the relationship between CAD/AUD and commodities is rather strong, yet inverse. That is, the AUD strengthens against the CAD as commodity prices go up, and weakens when they go down. This allows us to expect the AUD exchange rates to be more closely linked with commodity price changes. Therefore we make the Australian dollar the subject of our current research.
Considering the conclusions we made about the Canadian dollar, we have chosen to concentrate on three main questions: 1. How strong is the link between the Australian dollar and commodities?
2. How does the relationship change over time? 3. What is the relationship now?
Methodology
As before, we use a rolling correlation to study the relationship and apply the method to asset returns.
As Australia is one of the largest commodity exporters with a diversified structure of exports, we use the same indices to represent commodity sectors. Namely, S&P GSEN (Energy), S&P GSIN (Industrial Metals), S&P GSAG (Agriculture), and S&P GSPM (Precious Metals). The currency pairs chosen for analysis are AUD/USD, AUD/EUR, AUD/JPY, AUD/CAD, AUD/CHF, and AUD/NZD. More detailed information can be found in the appendix.
Correlation is a measure of how similar the performances of two datasets are. It is
ex-pressed by a correlation coefficient that can vary from -1 to 1, with -1 being a perfectly
op-posite movement and 1 – a perfectly unidirectional. Commonly absolute values of 0.3 and
below are considered insignificant.
Findings
First finding:
the strength of the relationship with commodities differs among separate AUD currency pairs.In this respect the pairs can be divided into two groups (see Figure 2). Similarly to the CAD grouping, AUD/USD and AUD/JPY form the first, but AUD/EUR and AUD/GHF – the second. Pairs of the first group are strongly correlated (50% of correlation values for 2000-2011 are above 0.7) and have close high results with commodities.
AUD/EUR and AUD/CHF are also highly correlated pairs (in 2000-2011 the average correlation is 0.9) and frequently show significant correlation with commodities. Such results are much better than the below-0.3 values for the CAD’s respective pairs, proving that the Australian dollar is more impacted by commodities than the Loonie.
Correlations for the pairs with the Australian dollar against other commodity currencies are not as definite as they were with the CAD. AUD/CAD could be classified as the second group by the values of correlation with commodities, although it has stably higher correlations with pairs of the first group than with those of the second. With that we do not place it in any of the named groups. As far as AUD/NZD is concerned, the economy of New Zealand is greatly dependent on Australia’s economy, and the New Zealand dollar is highly correlated with Australian dollar, so the pair shows weak results and stands by itself.
We must point out that the averaged AUD returns give rather high, significant values. This indicated that there is a strong link between the Australian dollar and diverse commodities. Moreover, this close relationship becomes even more apparent if compared with CAD’s negligible results.
Second finding:The relationship between the Australian dollar exchange rates and commodity sectors is not stable over time.
In fact, the changes can be major enough to raise the correlation above the significance level and make it drop again in a year’s time. As can be seen from Figure 2, the structure of the alterations tends to vary in different commodity sectors, but is alike for currency pairs. With that we can apply the already used method to examine the changeability of the relationship - trace it relative to commodity performance.
It is notable that Industrial Metals is the only commodity sector that shows a significant correlation with currency pairs in the first half of the 2000s. In periods after 2008, however, all sectors give similar results. This can be also traced in changes of correlation between commodities themselves (see appendix). It appears that, when the movements of commodities are uncoordinated, Industrial Metals is the sector best linked with the currency pairs. Additionally, when a correlation between commodities becomes more significant, the currency linkage results for the Industrial Metals are among the highest. This makes the relationship between the AUD currency pairs and the Industrial Metals’ sector the most solid. We will now explore its changeability using the link with AUD/USD as an example.
The division of the time interval from 2000 to 2011 for Industrial Metals is slightly different than periods for the Energy that were used in previous research. Here we have :
1.a calm period with no directional change ( 2000 – 2002) 2.a period of smooth growth ( 2003 – mid 2006)
3.a highly volatile period with no directional change (late 2006 – mid 2008) 4.a sharp downfall (late 2008)
5.a rapid recovery period (2009 – 2011) These are also the periods used in Figure 2.
2003 – mid-2006: the commodity sector and currency pair start the period uncoordinated, bringing correlation down to its lowest values 0.06-0.1. The link strengthens by 2004, when not only the direction, but peaks and drops of the assets match perfectly. Correlation then rapidly passes the signifi-cance barrier and remains at a high level of 0.6 in late 2004 – early 2005. In March 2005 AUD reaches its maximal strength against USD and does not experience any serious changes until the end of the period. Industrial Metals, on the contrary, continue on an even sharper climb, gaining 92% of the March price in a year. During this time correlation gradually declines, facing the end of the period slightly below significance level.
2000 – 2002: The period is marked by calm movement, with equally scaled changes in both assets. Correlation is low in the beginning and reaches the significance level of 0.3 only by late 2001. It is around this time when the assets approach their period’s minima, the Industrial Metals sector drop-ping 27% and AUD/USD losing 26% over the base value. Thereafter an almost unidirectional movement of the commodity price is accompanied by the currency pair’s slow rise. Correlation is above its average value up until the end of 2002, closing the period on a maximal level of 0.55.
Late 2006 – mid-2008: The currency pair moves on a mild upward trend throughout the period, with a 24% gain in two years. In turn, the period’s open and close prices for the commodity are almost the same. The asset advances in sharp movements, reaching its highest price levels for the whole 2000-2011 time interval, but does not show any long-term trends. Despite such different movement directivity, the peaks of the asset prices are well coordinated, keeping the relationship strong. Correlation varies from 0.51 to 0.61, with the most common value as high as 0.58.
Late 2008: This period is remarkable for a steep downtrend in both assets. The landslide fall brings the commodity to the price level of mid-2004 and the currency exchange rate even lower, briefly making the AUD even weaker against the USD than in 2000. Altogether, the commodity sector lost 58% of its price during the period, while the currency rate fell 29%. This common slump results in a high correlation of 0.5. This is, however, lower than the previous period’s minimum, as small fluctuations in prices seem to be unmatched.
2009-2011: 2009 starts a recovery trend with the sharpest long-term slope for both assets. This general upward movement can be more accurately divided into two long rises and two fast falls, all four of which match fully for the commodity sector and the currency pair. Correlation for the period gives the best results, with the average value on the same level as previous maxima. The period ends with a month of 0.77 correlation, the highest for 2000-2011, indicating the strongest relationship so far.
It must be said that throughout the 2000-2011 time interval the correlation for AUD/USD – Industrial Metals was generally higher than the one for the Canadian dollar’s best combination, CAD/USD – Energy.
Third finding: currently the link between the Australian dollar and commodity sectors is notably strong, with correlations at their historic highs.
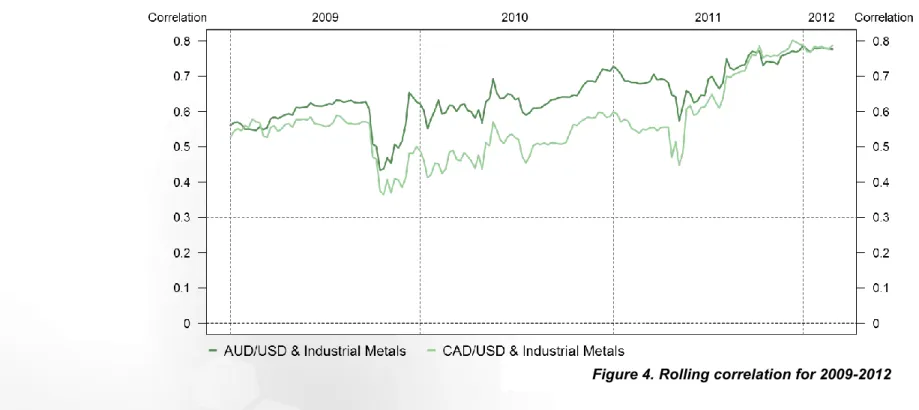
By the beginning of 2012 the AUD/USD - Industrial Metals correlation has reached its best value of 0.78. Correlations of AUD/JPY - Industrial Metals are also on a high level – around 0.72. The values for Energy are a bit worse, but also have an upward trend. In January the AUD/JPY - Energy correlation was 0.59, and it grew to 0.67 by March, while the AUD/USD - Energy correlation increased from 0.68 to 0.71. Such high values describe the relationship as strong positive and show that the assets are moving in the same direction.
Correlations of the second currency pair group are not as high, but the values in 2012 are still greater than average ones of 2009 – 2011. By March 2012 AUD/EUR caught up with AUD/CHF, the group’s leader up until 2011. AUD/EUR correlation has reached the level of 0.51 with the Energy sector and 0.53 with Industrial Metals. Meanwhile, AUD/CHF – Energy is at 0.56, but AUD/CHF – Industrial Metals at 0.4. AUD/CAD remains in-between, with 0.56 and 0.63 correlations with the Energy and the Industrial Metals’ sectors respectively.
The AUD/NZD latest correlation levels are close to zero. With that there is still no evidence of a relationship between this pair and prices on commodities. Figure 4. Rolling correlation for 2009-2012
Conclusion
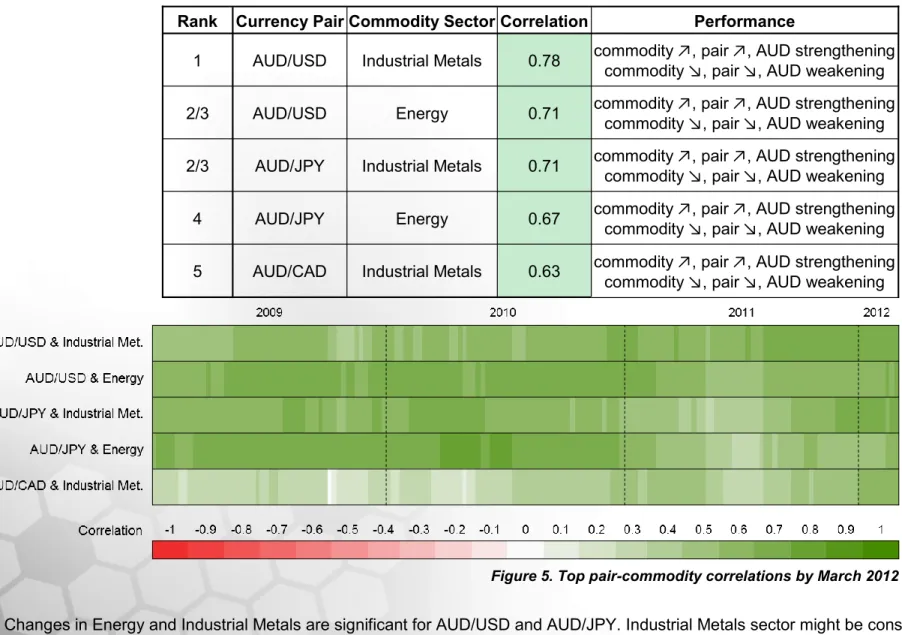
At the moment there are five currency pair – commodity combinations that have a stably strong relationship since 2011:
Rank Currency Pair Commodity Sector Correlation Performance
1 AUD/USD Industrial Metals 0.78 commodity ↗, pair ↗, AUD strengthening
commodity ↘, pair ↘, AUD weakening
2/3 AUD/USD Energy 0.71 commodity ↗, pair ↗, AUD strengthening
commodity ↘, pair ↘, AUD weakening
2/3 AUD/JPY Industrial Metals 0.71 commodity ↗, pair ↗, AUD strengthening
commodity ↘, pair ↘, AUD weakening
4 AUD/JPY Energy 0.67 commodity ↗, pair ↗, AUD strengthening
commodity ↘, pair ↘, AUD weakening 5 AUD/CAD Industrial Metals 0.63 commodity ↗, pair ↗, AUD strengthening
commodity ↘, pair ↘, AUD weakening
Figure 5. Top pair-commodity correlations by March 2012
Changes in Energy and Industrial Metals are significant for AUD/USD and AUD/JPY. Industrial Metals sector might be considered in trading AUD/ CAD. However, the relationship is changeable, and traders should follow global market tendencies to estimate the link.
Appendix
Spot sub-indices of Standard & Poor’s Global Industry Classification Standard:
1. S&P GSEN (Energy) – Crude Oil, Brent Crude, Unleaded Gasoline, Heating Oil, Gas Oil, Natural Gas 2. S&P GSIN (Industrial Metals) – Aluminum, Copper, Lead, Nickel, Zinc
3. S&P GSAG (Agriculture) – Wheat, Kansas Wheat, Corn, Soybeans, Cotton, Sugar, Coffee, Cocoa, Biofuel 4. S&P GSPM (Precious Metals) - Gold, Silver
Dukascopy Group Home Page Market News & Research Daily Forex Overview Fundamental Analysis Technical Analysis Press Review Market News Market Research Expert Commentary
Dukascopy Bank Sentiment Index Trade Pattern Ideas
Global Stock Market Review Commodity Overview
Additional sources:
Dukascopy TV
Daily Pivot Point Levels Economic Calendar Daily Highs/Lows SWFX Sentiment Index Movers & Shakers FX Forex Calculators Currency Converter Currency Index CoT Charts
Social networks:
Technical Analysis Fundamental Analysis Expert Commentary
Dukascopy Bank Sentiment Index Market Research Press Review
Trade Pattern Ideas Commodity Overview
Global Stock Market Review
Disclaimer
Everything in this article, including opinions and figures, is provided for informational purposes only and may not be interpreted as financial advice or solicitation of products. Dukascopy group assume no responsibility for the completeness or the accuracy of any data contained in this article. Financial figures indicated in this article have not been verified by the Dukascopy group. Views, opinions and analyses are those of the author of the article, and are not endorsed by the Dukascopy group.
Dukascopy group waive any and all warranties, express or implied, regarding, but without limitation to, warranties of the merchantability or the fitness for a particular purpose, with respect to all information in this article. Dukascopy group shall under no circumstances be responsible for any direct, indirect, consequential, contingent or any other damages sustained in connection with the use of this article.