Benchmark Report: 2006
Research Report No. 24-07
Office of Institutional Research, Planning, and Assessment
Northern Virginia Community College
NORTHERN VIRGINIA COMMUNITY COLLEGE
OFFICE OF INSTITUTIONAL RESEARCH, PLANNING, AND ASSESSMENT
The purpose of the Office of Institutional Research, Planning, and Assessment is to
conduct analytical studies and provide information in support of institutional planning,
policy formulation and decision making. In addition, the office provides leadership and
support in research related activities to members of the NOVA community engaged in
planning and evaluating the institution’s success in accomplishing its mission.
4001 Wakefield Chapel Road
Annandale, VA 22003-3796
(703) 323-3129
Introduction
This report presents data from the Integrated Postsecondary Education Data System (IPEDS)
1on selected indicators related to student access and success that include enrollment, retention,
and graduation rates. Data for Northern Virginia Community College (NOVA) are compared
with that of a group of comparison institutions determined by IPEDS. The characteristics used
to select comparison institutions include public, two-year, degree-granting institutions in the
southeast of the country with similar enrollment. A complete listing of the comparison
institutions is shown on page 6.
IPEDS publishes this benchmark report annually so that institutions can identify and review
institutional trends and determine how their indicators compare to those of other institutions with
similar characteristics. The data in this report were provided by institutions to IPEDS during the
2005-06 survey year
21
IPEDS is a division of the U.S. Department of Education, National Center for Education Statistics.
.
2
Each year, IPEDS surveys most postsecondary institutions annually and collects data on a variety of
areas including institutional characteristics, completions, enrollment, human resources, finance, student
IPEDS DATA FEEDBACK REPORT
Figure 1. Unduplicated 12-month headcount, total FTE enrollment (academic year 2004–05), and full- and part-time fall enrollment (Fall 2005)
NOTE: For details on calculating full-time equivalent (FTE) enrollment, see “Calculating FTE” in the Methodological Notes at the end of this report. Total headcount, FTE, and full- and part-time fall enrollment include both undergraduate and postbaccalaureate students, when applicable. N is the number of institutions in the comparison group.
SOURCE: U.S. Department of Education, National Center for Education Statistics, Integrated Postsecondary Education Data System (IPEDS): Spring 2006.
Figure 2. Percent of all students enrolled, by race/ethnicity, and percent women: Fall 2005
NOTE: Median values for the comparison may not add to 100 percent. See "Use of Median Values for Comparison Group" for how median values are determined. N is the number of institutions in the comparison group.
SOURCE: U.S. Department of Education, National Center for Education Statistics, Integrated Postsecondary Education Data System (IPEDS): Spring 2006.
Figure 3. Academic year tuition and required fees for full-time, first-time degree/certificate-seeking undergraduates: 2003– 04—2005–06
NOTE: The tuition and required fees shown here are the lowest reported from the categories of in-district, in-state and out-of-state. N is the number of institutions in the comparison group.
SOURCE: U.S. Department of Education, National Center for Education Statistics, Integrated Postsecondary Education Data System (IPEDS): Fall 2005.
Figure 4. Percent of full-time, first-time, degree/certificate-seeking undergraduate students receiving financial aid, by type of aid: 2004–05
NOTE: For details on how students are counted for financial aid reporting, see “Cohort Determination for Reporting Student Financial Aid and Graduation Rates” in the Methodological Notes at the end of this report. N is the number of institutions in the comparison group.
SOURCE: U.S. Department of Education, National Center for Education Statistics, Integrated Postsecondary Education Data System (IPEDS): Spring 2006.
Northern Virginia Community College
IPEDS DATA FEEDBACK REPORT
Figure 5. Types and average amounts of financial aid received by full-time, first-time, degree/certificate-seeking
undergraduates: 2004–05
NOTE: Average grant (or loan) values were calculated by dividing the total grants (or loans) awarded by the total number of recipients in each institution. N is the number of institutions in the comparison group.
SOURCE: U.S. Department of Education, National Center for Education Statistics, Integrated Postsecondary Education Data System (IPEDS): Spring 2006.
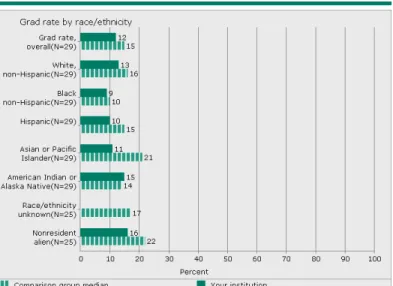
Figure 6. Graduation rates of full-time, first-time degree/certificate-seeking undergraduates within 150% of normal time to program completion, by race/ethnicity: 2002 cohort
NOTE: The graduation rates are the Student Right-to-Know (SRK) rates. For more information see the Methodological Notes at the end of the report. N is the number of institutions in the comparison group.
SOURCE: U.S. Department of Education, National Center for Education Statistics, Integrated Postsecondary Education Data System (IPEDS): Spring 2005
Figure 7. Graduation rate cohort as a percent of all undergraduates (Fall 2005); graduation rate and transfer-out rate (2002 cohort); and retention rates (Fall 2005)
NOTE: Graduation rate cohort includes all full-time, first-time degree/certificate-seeking undergraduate students. Entering class includes all students coming to the institution for the first time. Only institutions with a mission to prepare students to transfer are required to report transfers out. Graduation and transfer-out rates are the Student Right-to-Know rates. 4-year schools report retention rates for students seeking a bachelor's degree. For more information, see the Methodological Notes. N is the number of institutions in the comparison group.
SOURCE: U.S. Department of Education, National Center for Education Statistics, Integrated Postsecondary Education Data System (IPEDS): Spring 2006.
Figure 8. Number of degrees or certificates awarded, by level: Academic year 2004-05
NOTE: N is the number of institutions in the comparison group.
SOURCE: U.S. Department of Education, National Center for Education Statistics, Integrated Postsecondary Education Data System (IPEDS): Fall 2005.
IPEDS DATA FEEDBACK REPORT
Figure 9. Percent distribution of core revenues, by source: Fiscal year 2005
NOTE: The comparison group median is based on those members of the comparison group that report finance data using the same accounting standards as the focus institution. For a detailed definition of core revenues, see the Methodological Notes. N is the number of institutions in the comparison group. SOURCE: U.S. Department of Education, National Center for Education Statistics, Integrated Postsecondary Education Data System (IPEDS): Spring 2006.
Figure 10. Core expenses per FTE enrollment, by function: Fiscal year 2005
NOTE: The comparison group median is based on those members of the comparison group that report finance data using the same accounting standards as the focus institution. Expenses per full-time equivalent (FTE) enrollment, particularly instruction, may be inflated because finance data includes all core expenses while FTE reflects credit activity only. For details on calculating FTE enrollment and a detailed definition of core expenses, see the Methodological Notes. N is the number of institutions in the comparison group.
SOURCE: U.S. Department of Education, National Center for Education Statistics, Integrated Postsecondary Education Data System (IPEDS): Spring 2006.
Figure 11. Full-time equivalent staff by assigned position: Fall 2005
NOTE: Graduate assistants are not included in this figure. N is the number of institutions in the comparison group.
SOURCE: U.S. Department of Education, National Center for Education Statistics, Integrated Postsecondary Education Data System (IPEDS): Winter 2005–06.
Figure 12. Average salaries of full-time instructional staff equated to 9-month contracts, by academic rank: Academic year 2005–06
NOTE: Average full-time instructional staff salaries for 11/12-month contracts were adjusted to 9-month average salaries by multiplying the 11/12-month salary by .8182. Salaries based on less than 9-month contracts are not included. Medical school staff salaries are not included. N is the number of institutions in the comparison group. Not enough values in the comparison group to calculate a median.
SOURCE: U.S. Department of Education, National Center for Education Statistics, Integrated Postsecondary Education Data System (IPEDS): Winter 2005–06.
Northern Virginia Community College
IPEDS DATA FEEDBACK REPORT
COMPARISON GROUP
Using some of your institution's characteristics, a group of comparison institutions was selected for you. The
characteristics include public, 2-year, degree-granting, in the Southeast region of the country, and enrollment of a similar size. This comparison group includes the following 29 institutions:
Brevard Community College (Cocoa, FL) Broward Community College (Fort Lauderdale, FL) Central Piedmont Community College (Charlotte, NC) Daytona Beach Community College (Daytona Beach, FL) Delgado Community College (New Orleans, LA) Edison College (Fort Myers, FL)
Fayetteville Technical Community College (Fayetteville, NC) Florida Community College at Jacksonville (Jacksonville, FL) Georgia Perimeter College (Decatur, GA)
Greenville Technical College (Greenville, SC)
Guilford Technical Community College (Jamestown, NC) Hillsborough Community College (Tampa, FL) Hinds Community College (Raymond, MS) Indian River Community College (Fort Pierce, FL) J Sargeant Reynolds Community College (Richmond, VA) Jefferson Community College (Louisville, KY)
Lexington Community College (Lexington, KY) Midlands Technical College (West Columbia, SC) Mississippi Gulf Coast Community College (Perkinston, MS) Palm Beach Community College (Lake Worth, FL) Pensacola Junior College (Pensacola, FL) Santa Fe Community College (Gainesville, FL) Seminole Community College (Sanford, FL)
Southwest Tennessee Community College (Memphis, TN) Tallahassee Community College (Tallahassee, FL) Tidewater Community College (Norfolk, VA) Trident Technical College (Charleston, SC) Valencia Community College (Orlando, FL) Wake Technical Community College (Raleigh, NC)
IPEDS DATA FEEDBACK REPORT
METHODOLOGICAL NOTES
Overview
The statistics and indicators in this report are based on data supplied by institutions to IPEDS during the 2005–06 survey year. Once the data submissions were locked by the institution’s keyholder (and others), they were reviewed by the Help Desk and migrated to the IPEDS Peer Analysis System. Response rates for 2005–06 exceeded 99 percent for most surveys. Detailed
response tables are included in the appendices to the IPEDS E.D. TABs. See http://nces.ed.gov/ipeds under "publications."
Comparison Groups
Comparison group data are included to provide a context for interpreting your institution’s statistics. If your institution did not define a Custom Comparison Group for this report by June 30, 2006, NCES selected a comparison group for you based on the institutional characteristics detailed immediately above the listing of the comparison group institutions. (If the Carnegie Classification of Institutions of Higher Education was used as an institutional characteristic in the definition of a comparison group, the 2000 version was used.) The comparison group used in this report may not reflect your institution’s peer group or you may wish to compare your institution to multiple groups of institutions. The Executive Peer Tool (ExPT) (see
http://nces.ed.gov/ipedspas/expt) can be used to produce the figures in this report for different groups of institutions. Use of Median Values for Comparison Group
The value for the focus institution is compared to the median value for the comparison group for each statistic included in the figure. If more than one statistic is presented in a figure, the median values are determined separately for each indicator or statistic. Where percent distributions are presented, median values may not add to 100 percent. Through the ExPT, users have access to all of the data used to create the figures included in this report.
Missing Statistics
If a statistic is not reported for your institution, the omission indicates that one of the following conditions exists: (1) the value of that statistic is not relevant to your institution and the data were not collected; or (2) the data required to compute the statistic for your institution were reported combined with data from another institution.
Use of Imputed Data
All IPEDS data are subject to imputation for nonresponse—both total (institutional) nonresponse and partial (item) nonresponse. Imputed values are included for both your institution and any institutions in your comparison group. For example, if an institution in your comparison group did not complete the Enrollment component, NCES imputed the data for that institution AND the imputed data were used in determining the median values for each comparison group statistic.
Data Perturbation and Confidentiality
Four laws cover protection of the confidentiality of individually identifiable information collected by NCES—the Privacy Act of
1974, as amended; the E-Government Act of 2002; the Education Sciences Reform Act of 2002; and the USA Patriot Act of 2001. Under law, public use data collected and distributed by NCES may be used only for statistical purposes. Any effort to determine the identity of any reported case is prohibited by law. In order to preserve individuals’ confidentiality, data in the Graduation Rates and Student Financial Aid components, and the Salaries and Fall Staff sections of the Human Resources component of IPEDS are perturbed. Only perturbed data are available in the Peer Analysis System and the ExPT; the perturbed data were used in creating this report.
Descriptions of Statistics Used in the Figures Calculating FTE Enrollment
The full-time equivalent (FTE) enrollment used in this report is the sum of the institutions’ FTE undergraduate enrollment and FTE graduate enrollment (as calculated from or reported on the 2005 Enrollment component) plus the estimated FTE of
first-professional students. Undergraduate and graduate FTE are estimated using 12-month instructional activity (credit and/or contact hours). First-professional FTE is estimated by calculating the ratio of full-time to part-time first-professional students from the fall counts (Part A) and applying this ratio to the 12-month unduplicated headcount of first-professional students. The estimated number of full-time students is added to one-third of the estimated number of part-time students. See “Calculation of FTE Students (using instructional activity)” in the IPEDS Glossary at http://nces.ed.gov/ipeds/glossary/.
Calculating FTE for Staff
The full-time equivalent (FTE) of staff is calculated by summing the total number of full-time staff from the Employees by Assigned Position (EAP) section of the Human Resources component and adding one-third of the total number of part-time staff.
Cohort Determination for Reporting Student Financial Aid and Graduation Rates
Student cohorts for reporting Student Financial Aid and Graduation Rates data are based on the reporting type of the institution. For institutions that report based on an academic year (those operating on standard academic terms), student counts and cohorts are based on fall term data. Student counts and cohorts for program reporters (those that do not operate on standard academic terms) are based on unduplicated counts of students enrolled during a full 12-month period.
Core Expenses
Core expenses for public institutions (using the Governmental Accounting Standards Board (GASB) standards) include expenses for instruction, research, public service, academic support, student services, institutional support, operation and maintenance of plant, depreciation, scholarships and fellowships, other expenses, and nonoperating expenses. Core expenses for private, not-for-profit and public institutions reporting under the Financial Accounting Standards Board (FASB) standards include expenses for instruction, research, public service, academic support, student services, institutional support, net grant aid to students, and other expenses. For both FASB and GASB institutions, core expenses exclude expenses