Australian Journal of Basic and Applied Sciences, 10(9) May 2016, Pages: 89-97
AUSTRALIAN JOURNAL OF BASIC AND
APPLIED SCIENCES
ISSN:1991-8178 EISSN: 2309-8414 Journal home page: www.ajbasweb.com
Open Access Journal
Published BY AENSI Publication
© 2016 AENSI Publisher All rights reserved
This work is licensed under the Creative Commons Attribution International License (CC BY).
http://creativecommons.org/licenses/by/4.0/
To Cite This Article: Jamile Coleti and Andréa Leda Ramos de Oliveira., Development of a spatial equilibrium model for intermodal transport: the case of Brazilian ethanol. Aust. J. Basic & Appl. Sci., 10(9): 89-97, 2016
Development of a spatial equilibrium model for intermodal transport: the
case of Brazilian ethanol
1
Jamile Coleti and 2Andréa Leda Ramos de Oliveira
1University of Campinas, Institute of Economics, Campinas. Brazil.
2University of Campinas, School of Agricultural Engineering, Campinas. Brazil.
Address For Correspondence:
Jamile Coleti, University of Campinas, Institute of Economics, Campinas. Brazil.
A R T I C L E I N F O A B S T R A C T Article history:
Received 3 March 2016; accepted 2 May 2016; published 26 May 2016
Keywords:
biofuel, logistics, agricultural economics.
Background: The search for renewable sources of energy has been increasing the global demand for ethanol. Brazil is the second largest ethanol producer in the world. The increase in oil prices, the strong demand for clean and renewable sources of energy, and the intense commercialization of flex-fuel cars have created a very favorable scenario for biofuel production, including ethanol. Furthermore, ethanol has environmental advantages, as its combustion generates less carbon dioxide than gasoline. However, the growing demand for ethanol requires substantial investments in storage/tankage units at strategic locations and a transport structure that is compatible with the growing production and consumption of this fuel. In Brazil, ethanol is produced in the plants and transferred to collection centers for storage. Sometimes, the product could be directly transferred to the distribution base. This process is mostly carried out by road transport mode. However, currently, the country faces the risk of a logistics blackout as well as challenges regarding storage and transportation capacity, that end up affecting product competitiveness compared to major global players. Objective: The purpose of this study is to analyze ethanol transportation alternatives in the face of current logistics conditions in Brazil. We propose a partial equilibrium model in the form of a Mixed Complementarity Problem (MCP) applied to ethanol. Two scenarios are examined: the first concerns a base scenario comprising road and multimodal transport with the currently charged freight and the second involves an estimated 15% decrease in railroad freight. Results: Scenario 2 shows relatively favorable trading volumes when compared with the base scenario. We also highlight that multimodality assumptions in scenario 2 resulted in competitiveness gains in the international market, this because 100% of the routes destined for the foreign market are multimodal routes. Conclusion: Transport systems that prioritize multimodality imply transportation cost reductions and improve the efficacy of the logistics system.
INTRODUCTION
The Brazilian agribusiness expansion has been characterized by increasingly integrated production chains and intensive use of capital in the various segments that comprise them. According to Oliveira (2011), agriculture is still characterized by a substantial share in the GDP, increased trade surplus as well as significant contribution in controlling inflation. Brazilian agro-industrial systems are highly developed. However, despite the growth, the sector has been facing new challenges, such as the domestic logistics system shortages.
Therefore, the purpose of this study is to analyze transport alternatives for different ethanol routes in the face of the current logistics conditions in Brazil, by assessing the implications of transport infrastructure limitations in the enhancement of ethanol competitiveness in national and international markets.
logistics directed toward the guidance of new transport projects capable of increasing the sector’s competitiveness.
Brazil is the world's second largest ethanol producer. According to BRASIL (2014), in 2015–2016, the harvest in Brazil is estimated as 29.2 million m³, behind only the United States that produced approximately 50.4 million m³ (Renewable Fuels Association, 2014). Compared to other renewable resources, sugarcane’s ethanol yield demonstrates its competitiveness. While Brazilian sugarcane produces 6.5 m3 of ethanol per hectare planted, the yield of corn ethanol in the United States is 4.2 m3 per hectare planted (Salles-Filho, 2015).
The increase in oil prices, the strong demand for clean and renewable sources of energy, and the intense commercialization of flex-fuel cars have created a very favorable scenario for biofuel production. Ethanol also has environmental advantages, as its combustion generates less carbon dioxide than gasoline.
Another relevant factor to be discussed is the participation of foreign capital in the sector. In the recent years, a pronounced process of mergers and acquisitions has affected the sugar-alcohol industry. According to Moraes et al. (2013), these strategies have significantly changed the structure of this market, creating large domestic and international groups seeking increase of efficacy and competitiveness—through economies of scale, scope, and synergies between companies. This has created the need for more efficient trading structures and investments in the development of new products and technologies.
The sugar and ethanol production in Brazil is concentrated in the South-central region (90%), while the North-east region is responsible for producing about 10% of the total raw materials produced in the country.
According to Petean et al. (2011), as ethanol production is an agro-industrial activity, it is directly influenced by sugarcane planting and harvest timing, the months from December to March being the intercrop period and the remaining months the harvest period.
With respect to exports, Brazil holds the leading position. According to SECEX (2014) estimates, 1.39 million m³ of ethanol were exported in 2014. Regarding Brazilian ethanol buyers, the United States is in fact the largest Brazilian ethanol buyer, followed by South Korea and the Netherlands.
The sector is growing rapidly, supported by the growth of the domestic market, global demand expansion, and decrease of worldwide stocks that have made the prices more attractive to producers.
According to Kisperska-Moron and Krzyzaniak (2009), the costs associated with transport are often more than one-fourth of the overall logistics costs. Transport managers usually are responsible for taking decisions regarding whether to use their own transport or external transport, and the choice of the optimal route of transporting cargo (Grabara et al., 2014).
In this regard, the growing demand for ethanol requires substantial investments in storage/tankage units at strategic locations and a transport structure that is compatible with the growing production and consumption of this fuel.
Currently, the country operates the following modes of transport: road, railroad, waterway, pipeline, and air. Furthermore, agricultural commodities are primarily transported by road.
According to Catala et al. (2013), in many supply chains, logistics related to the distribution of goods in a timely manner between the different system nodes is essential.
The road transport is the predominant mode of cargo transport in Brazil, practically covering all areas of the national territory. It is responsible for over 60% of the Brazilian transport system. This mode is usually indicated for shorter distances. However, in reality, owing to its high availability, agricultural cargos end up traveling long distances using the road transport mode.
The large number of producing units and their proximity with distribution centers justifies the prevalence of the road mode for ethanol transportation, which is more competitive in short routes and for low cargo volumes.
According to Milanez et al. (2010), plants are usually located in agricultural regions that face difficulty in having access to major transport routes and, owing to their production value, investment in other transport modes is unfeasible.
The possibility of “door-to-door” delivery is an advantage, where direct delivery from plants to fuel retailers takes place; in some cases, agreements for direct transportation from the plant to fuel stations are possible.
The railroad mode, according to Ballou (2004), is characterized by a high fixed cost, despite having a higher cargo transport capacity, generating economies of scale. Moreover, since this mode is slower, its use is recommended for solid bulks, large quantities, and longer distances of travel with reasonable terms. Table 1 indicates the progress of railroad usage for ethanol transport in the last 3 years.
Table 1: Progress of railroad share in ethanol transportation for 2011–2013 (%)
Railroad 2011 2012 2013
Share of fuels in railroad transportation 2.79 2.26 2.14
Share of ethanol in fuel transportation 22.8 25.9 27.3
Share of ethanol in railroad transportation 0.64 0.58 0.58
91 Jamile Coleti and Andréa Leda Ramos de Oliveira, 2016
Australian Journal of Basic and Applied Sciences, X(X) May 2016, Pages: x-x
Some advantages of the use of railroad transport for ethanol are reduction of product cost––increasing competitiveness in the foreign market; reduction of traffic congestions of trucks in port routes; and environmental improvement from reduction of carbon gas emissions (Janotti et al., 2012).
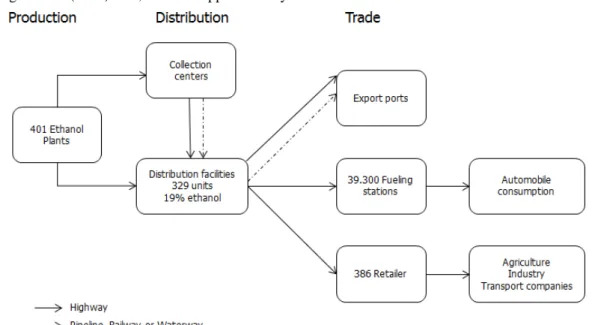
Ethanol production begins from one of the producing units. Then, the product is transported to collection centers for storage. Sometimes, the product could be directly transported to the distribution base. This process is mostly carried out by road transport mode.
Oliveira (2015) states that after the receipt at the collecting center, ethanol is transported to the distribution bases and, subsequently, transported from the bases to the domestic market or ports. Products destined to the domestic market (fuel stations or retail reseller) are usually delivered by road.
Figure 1 shows the dynamics of ethanol transportation from plants/distilleries to the final destination. According to ANP (2012) data, there are approximately 329 fuel distribution bases in Brazil.
Source: Adapted from Oliveira, 2015.
Fig. 1: Ethanol transportation dynamics
An alternative transport mode is the use of a single transport load unit, like a container, over multiple transport modes, which is called intermodal transport. The investment in new tranship terminals can facilitate inland ship-rail-road combinations and save thousands of truck kilometers in congestion-sensitive areas, thus reducing the environmental impact. However, the disadvantage of intermodal transport is that it requires higher coordination levels than single mode transport, creating a need for adaptation in the form of management of the logistics system (Dekker et al., 2012).
The private sector, logistics segment main stakeholder, has been investing to improve the transportation network. One example is Odebrecht TransPort––in partnership with Petrobras, Camargo Corrêa, Cosan Açúcar e Álcool, Copersucar, and Uniduto Logística––that is developing a project for the construction of a multimodal logistics system comprised of a polyduct network of approximately 1,900 km integrated to Tietê-Paraná Waterway. The system intends to allow the long distance storage of clear fuels, focused on ethanol––a business estimated in R$ 6 billion. The system aims to integrate ducts and waterways to railroad, road and marine modes––critical for the export process.
This integration between different transportation modes will cover several key ethanol producing Brazilian states. Expected transportation capacity is 21 billion liters per year and transportation cost-cutting target is 20% (ODEBRECHT, 2011). This evidences the need for investments in the sector as an attempt to ensure competitiveness through the free market.
According Behrends and Flodén (2012) intermodal transports comes along with severe challenges like (i) to coordinate the activities of the involved parties, (ii) the possibility of delivery door to door, in less time, and (iii) additional cost of drayage transports and transshipment operations that may outweigh the economies of scale.
Higgins et al. (2007) show the importance of new logistics projects, since they can reduce delays in deliveries and optimize the logistics system.
Brazil has made its way toward the incorporation of an intermodal transport system seeking to obtain advantages such as cost reduction, shorter transit time, and reduction of cargo risks. Recent infrastructure projects are moving toward the financing of intermodal projects in the state of São Paulo, the main polo producer and exporter. Moreover, various initiatives promote the use of the waterway and pipeline as transport alternatives.
The remainder of this paper is organized as follows. Section 2 describes the methodology used. Section 3 shows the main results obtained with the MCP implementation and the impacts of the scenarios proposed. Finally, Section 4 discusses the main findings and contributions of the research.
MATERIALS AND METHODS
Samuelson (1952) was a pioneer in showing the possibility of solving spatial equilibrium problems between different markets through mathematical programming. He proposed the problem of two spatially separated markets in a non-normative economy on a mathematical maximization program. This problem was formulated with the purpose of maximizing under all excess demand curves minus the area of all excess supply curves, minus total transportation costs, resulting in a competitive spatial equilibrium solution, i.e., based on the resulting intersection areas of the curves of these three variables.
Takayama and Judge (1971) used supply and demand functions to obtain spatial and atemporal dimensions for price, production, utilization factor, and consumption determined by means of a quadratic programming chart. Based on Samuelson’s assumption, a suitable algorithm was developed to solve spatial equilibrium conditions involving commodities traded between different regions.
According to Alvim (2003), different theoretical approaches have been used to measure supply-demand interactions, with emphasis on general and partial equilibrium models.
Oliveira (2011) defends that general equilibrium models require information that sometimes is not available. Therefore, simplifying assumptions have to be adopted compromising the results achieved. In a partial equilibrium model, the direct impacts of any trade policy over a given market are analyzed.
Ethanol being an agricultural commodity, its trade passes from the origin to the destination and is subject to elasticity effects. Thus, partial or spatial equilibrium models are most suitable approaches for this study (Brown and Drynan, 1986).
In the case of the sugarcane industry, Satolo and Caixeta-Filho (2010) assess the impact of new plants and distilleries that began operations during the 2010–11 harvest over the distribution of hydrous ethanol in the Central-west region. The authors used the spatial price equilibrium model to analyze the impact. The main finding of the research indicated that trade in the region should prioritize the destination for the state of São Paulo, a major player in the ethanol market.
To forecast the effects of adopting a new transport policy for Brazilian ethanol trade, this study developed a partial equilibrium model formulated as a Mixed Complementarity Problem (MCP) for ethanol transportation, as proposed by Oliveira (2011).
Description of model data:
Initially, ethanol transportation routes to be analyzed were defined based on ethanol supply and demand data. The regions were selected according to their relevance for product commercial dynamics. This was possible by examining the behavior of the following variables along 2013: ethanol production, average output, planted area, exports, consumption, and industrial capacity of sugar-alcohol plants.
The regions included in the model were defined based on the relevance of their participation in the variables. The purpose was to characterize ethanol market dynamics in these regions, where, as believed, the highest potential for the sugar-alcohol industry is concentrated.
The Central-south region was selected owing to its relevant share in the sector—it is responsible for over 90% of ethanol production in Brazil. The states comprising the supply regions are São Paulo, Goiás, and Mato Grosso do Sul, of which only the state of São Paulo is responsible for more than 50% of ethanol total production.
Because of its substantial share in the Brazilian ethanol production (about 50%), the state of São Paulo is divided into three macro regions: Macro 1, Macro 2, and Macro 3 regions representing the west, North-east, and the South side of the state, respectively.
The states of Goiás and Mato Grosso do Sul combined produce approximately 22% of the total Brazilian ethanol (UNICA, 2015).
93 Jamile Coleti and Andréa Leda Ramos de Oliveira, 2016
Australian Journal of Basic and Applied Sciences, X(X) May 2016, Pages: x-x
The North-east and South regions and the state of Rio de Janeiro are responsible for consuming a significant part of ethanol surplus produced in the Central-south region, and therefore, are considered as destination regions.
Regarding the international demand, the following countries were selected: the United States, South Korea, the Netherlands, and the Rest of the World. The United States is the world's leading ethanol producer and has the largest imports share of this market. South Korea and the Netherlands, according to export data, are the second and third largest importers of Brazilian ethanol, respectively (BRAZIL, 2014).
The following variables comprise the model: production, consumption, domestic and international trading prices, freights of different transport modes, and price elasticity of supply/demand. The base year of the variables is 2013.
The source of production data is the Brazilian Institute of Geography and Statistics (IBGE). The source of consumption and domestic and international trading prices data is the National Association for Oil, Natural Gas and Biofuels (ANP). Information on price elasticity of supply/demand was extracted from studies carried out by Beiral (2011), Boff (2009), and Luchansky and Monks (2009).
Scenario 1 is the base scenario where road and road-railroad routes’ freights are equal to those currently charged. For Scenario 2, a 15% decrease in railroad transportation freight was proposed, thus changing the transportation dynamics of the routes.
MCP for Brazilian ethanol:
According to Oliveira (2011), MCP consists of a simultaneous equations system (that could be linear or non-linear) that is described as inequalities, whose inputs are the supply and demand functions.
The MCP proposed to analyze the Brazilian ethanol market is presented below: Contents:
i: ethanol supply regions (i = 1,2,3,...,5)
j: ethanol domestic consumption regions (j = 1, 2, 3) k: ethanol international demand regions (k = 1, 2, 3) r: ethanol transportation routes (r = 1, 2,…,18)
Variables: : offer price
: domestic consumption price : international demand price : quantity offered
: domestic consumption
: international demand consumption
…: volume transported
Parameters:
…: transportation cost
: shadow price in supply region i (for ethanol) : shadow price in consumption region j
: shadow price in consumption region k
Observing the equations below, we note that the symbol “ ” implies that at least one of the adjacent inequalities should be satisfied as a strict inequality. Equations (4) and (5) are thus described due to a complementarity formality to satisfy Karush-Kuhn-Tucker conditions. In this case, Scenario 2 proposes a discount in railroad freight fee.
0 ≤ ⊥ + ≤ (1)
0 ≤ ⊥ ≤ (2)
0 ≤ ⊥ ≤ (3)
0 ≤ ⊥ +
≥ ∀, (4)
The freightik and freightij were already added due to the zero profit condition presented in Equations 6 and
7, where a new parameter is incorporated. In Bishop et al. (2001), the fee has implications only for flows destined for the international market, preventing the zero profit condition. In the current proposal, this fee represents the transportation variation cost, so:
(pi+tik).1+freightik≥pk∀i,k (6)
(pi+tij).1+freightij≥pj∀i,j (7)
The MCP developed for ethanol transportation in Brazil was processed through the General Algebraic Modeling System (GAMS) (Brooke et al., 1995) computational program.
Results:
Table 2 shows the ethanol trading flows destined for the domestic market per transportation route. Routes R1, R3, R4, R5, and R6 have an optimum transportation cost, and R1, R3, and R5 are direct road routes, whereas R4 and R6 are road-railroad transportation routes. According to the flow, Scenario 1 transportation destined for the domestic market was concentrated in the use of multimodality, where 46% of the trading volume is transported through the road mode, whereas 54% use multimodality.
Table 2: Scenario 1: Ethanol trading flows destined for the domestic market per transportation route in thousands of m³.
Origin Destination Routes*
R1 R3 R4 R5 R6
Macro 1 South 945.72
Macro 1 Rio de Janeiro 53.20
Macro 2 Rio de Janeiro 148.18
Macro 3 South 810.00
Goiás North-east 822.15
Goiás Rio de Janeiro 845.18
Total 822.15 810.00 945.72 53.20 993.36
*The routes (R1, R3, and R5) are road routes and paired routes (R4 and R6) are multimodal routes. Source: Research data (2015)
Next, Table 3 shows the routes destined for the international market.
Table 3: Scenario 1: Ethanol trading flows destined for the international market per transportation route in thousands of m³.
Origin Destination Routes*
R8 R9 R11 R13
Macro 1 The United States 406.90
Macro 2 The Netherlands 169.11
Macro 2 South Korea 371.45
Macro 2 Rest of the World 53.99
Mato Grosso do Sul The United States 1,697.66
Total 2,104.56 169.11 371.45 53.99
*The routes (R9, R11, and R13) are road routes, whereas the paired route (R8) is a multimodal route Source: Research data (2015)
Regarding the volumes destined for the international market in Scenario 1, we note that only 22% are transported by direct road mode, whereas 78% are more competitive using multimodal transport.
In this scenario, maximum trading volumes are transported using multimodality (64%), whereas direct road mode is responsible for 46% of the transported volume.
Next we analyze Scenario 2, where freightik and freightij fees were added representing a discount in the
order of 15% in railroad freight amounts so as to analyze how much a discount would affect the choice for multimodality. Table 4 shows ethanol trading flows destined for the domestic market per transportation route.
Table 4: Scenario 2: Ethanol trading flows destined for the domestic market per transportation route in thousands of m³.
Origin Destination Routes*
R1 R4 R6
Macro 1 South 781.14
Macro 2 South 166.05
Macro 2 Rio de Janeiro 199.95
Macro 3 South 809.94
Goiás North-east 819.83
Goiás Rio de Janeiro 849.03
Total 819.83 1,757.13 1,048.98
95 Jamile Coleti and Andréa Leda Ramos de Oliveira, 2016
Australian Journal of Basic and Applied Sciences, X(X) May 2016, Pages: x-x
Regarding the volumes transported destined for the international market in Scenario 2, 23% are transported via direct road mode, whereas 77% are more competitive using multimodal transport.
We note that in Scenario 2, regarding domestic market routes, for flows destined for the North-east region the optimum transportation is still by road (100%) and is originated from the state of Goiás. However, for routes destined for the South region and the state of Rio de Janeiro, the optimum result is an enhance use of multimodal routes.
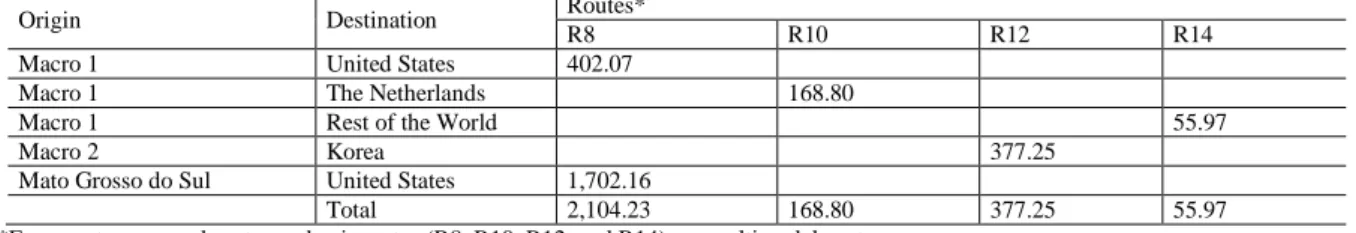
Next, Table 5 shows Scenario 2 results for the international market.
Table 5: Scenario 2: Ethanol trading flows destined for the international market per transportation route in thousands of m³.
Origin Destination Routes*
R8 R10 R12 R14
Macro 1 United States 402.07
Macro 1 The Netherlands 168.80
Macro 1 Rest of the World 55.97
Macro 2 Korea 377.25
Mato Grosso do Sul United States 1,702.16
Total 2,104.23 168.80 377.25 55.97
*Even routes are road routes and pair routes (R8, R10, R12, and R14) are multimodal routes. Source: Research data (2015)
Regarding routes destined for the international market, for all optimum routes the model has found multimodality as the most suitable transport mode option. Therefore, the following are the competitive routes: R8, R10, R12, and R14. If we compare with Scenario 1, we observe a disproportion regarding the distribution of transport modes, because in Scenario 2, transportation destined for the international market was completely (100%) concentrated on multimodality.
In this scenario, only 13% of the trading volume is transported via direct road, different from the previous one, where 36% used highways as the main transportation mode.
For Scenario 1, the results point out a higher use of multimodality (64%) when compared with the use of direct road transportation (36%) for ethanol handling. However, note that this is the base scenario, where fee amounts are equivalent to the current charges, without discounts.
When a 15% discount is applied to railroad freight fees (Scenario 2), multimodality becomes more competitive than the use of direct road mode. Scenario 2 points out that by adding taxik and taxij, only 13% of
the ethanol routes are transported via road mode and 87% of routes opt for multimodality as the most efficient option. Note that in Scenario 2, a major change in the means of transportation occurs in routes destined for exports. In Scenario 1, approximately 78% of the trading volume destined for the international market was transported using multimodality. However, when the 15% discount on railroad fee is applied, 100% of the trading volume destined for exports is more efficient via multimodality, and transportation for Santos Port via direct road mode is less competitive.
The major difference observed in the two scenarios between adopting multimodality or using only the road mode can be seen in the transportation destined for Santos Port, where in Scenario 2, 100% of the routes indicate that multimodality is more competitive for this destination.
Discussion:
The global demand for ethanol is increasing owing to a wider search for renewable sources of fuel. Hence, logistics should be adjusted to obtain a competitive edge that reflects on the overall cost of the product.
This study attempted to analyze transportation alternatives for different ethanol routes in the face of current logistics conditions in Brazil, assessing the implications of transportation infrastructure restraints for enhancing ethanol competitiveness in the domestic and international markets. Additionally, we analyzed ethanol transport alternatives to indicate which is the most efficient manner of transportation for the given routes. A data survey of the ethanol market was carried out to understand the trading dynamics for this product. A review of the transportation methods was also performed to present the features and specifics of ground transportation modes.
One of the limitations of the model is the fact that it disregards the United States ethanol subsidies. Because the proposal intends to analyze, above all, the domestic market flows, American subsidies were not included in the model. Note that Brazilian ethanol could be more competitive if American subsidies were not applied. Therefore, future analysis could indicate the effect of these subsidies over Brazilian ethanol.
Agricultural cargo transportation is an expensive affair because the products have low added value, and thus, the transportation cost has a large share in the total cost of the product, impacting its competitiveness.
In addition to the risk of logistics blackout, the sugar-alcohol industry—in particular, the ethanol sector— has been going through a crisis in recent years. The decrease in production of 2014–2015 harvest is already a reflection of the instabilities suffered by the sector. This calls for the implementation of appropriate public policies so that the sector is able to recover in the upcoming harvests.
An investment agenda is necessary, not only in transportation infrastructure, but also in the entire logistics chain, given the importance and weight of the logistics factor in the total price of agricultural cargo.
Advanced public policies that foster the use of multimodality as a means to obtain competitive edge must be adopted to provide access to multimodality to the main players of the industry.
The research assumption that multimodality is more competitive is correct, since reducing the cost of railroad transportation and implementing a new pipeline system increases the transportation flows.
This study presents an unprecedented application of partial equilibrium model for testing the multimodal transportation of ethanol. Future studies must consider a spatial equilibrium model that focuses solely on the domestic market. Moreover, it would be interesting to investigate a multi-product model by considering a second product, gasoline, which is currently the main competitor of ethanol in Brazil.
The work applied to the case of ethanol is unheard and shows how financial resources can be saved in the transport of ethanol by intermodality. Another great contribution is that this MCP model has never been applied to ethanol, only soybeans and corn, proving to be an innovative study.
REFERENCES
Alvim, A.M., 2003. Os impactos dos novos acordos de livre comércio sobre o mercado de arroz no Brasil: um modelo de alocação espacial e temporal, Ph.D. thesis, Univ. Federal do Rio Grande do Sul, Porto Alegre.
ANP – AGÊNCIA NACIONAL DO PETRÓLEO, GÁS NATURAL E BIOCOMBUSTÍVEIS. 2012.
Anuário Estatístico 2012. Accessed on June 23, 2014, on: http://www.anp.gov.br.
ANTT – AGÊNCIA NACIONAL DE TRANSPORTES TERRESTRES, 2015. Idade média dos veículos
2015. Accessed on January 5, 2015, on:
http://www.antt.gov.br/index.php/content/view/20272/Idade_Media_dos_Veiculos.html.
Ballou, R.H., 2004. Gerenciamento da cadeia de suprimentos/logística empresarial. São Paulo: Atlas. Beiral, P.R.S., 2011. O mercado brasileiro de etanol: concentração e poder de mercado sob a ótica da nova organização industrial empírica, Dissertação de Mestrado, Escola Superior de Agricultura Luiz de Queiroz, Univ. de São Paulo, Piracicaba, SP.
Bishop, P.M., C.F. Nicholson and J.E. Pratt, 2001. Tariff-Rate Quotas: difficult to model or plain simple. Trade Working Papers, East Asian Bureau of Economic Research.
Boff, H.P., 2009. O mercado interno do etanol: Modelo e Estimação do Preço de Equilibrio. (2009)
Seminários de pesquisa, 17032, IE/UFRJ, Rio de Janeiro, RJ, Brasil.
BRASIL., 2014. Ministério da Agricultura, Pecuária e Abastecimento. Companhia Nacional de Abastecimento. CONAB. Projeções do Agronegócio: Brasil 2009-2010 a 2019-2020. Brasília: Mapa/ACS. Accessed on December 12, 2014, on: http://goo.gl/M6YDyq.
Brooke, A., D. Kendrick and A. Meerraus, 1995. GAMS: A User’s Guide. Release 2.25. The Scientific Press.
Brown, C.G. and R.G. Drynan, 1986. Plant location analysis using discrete stochastic programming. Aust J Agr Econ, 30(1): 1-22.
Catala, L.P., G.A. Durand, A.M. Blanco and J.A. Bandoni, 2013. Mathematical model for strategic planning optimization in the pome fruit industry. Agr Syst, 115: 63-71.
Dekker, R., J. Bloemhof and I. Mallidis, 2012. Operations research for green logistics – An overview of aspects, issues, contributions and challenges. Eur J Oper Res, 219(3): 671-679.
Grabara, J., M. Kolcun and S. Kot, 2014. The role of information systems in transport logistics. Int J Edu Res., 2(2): 1-8.
Higgins, A., P. Thorburn, A. Acher and E. Jakku, 2007. Opportunities for value chain research in sugar industries. Agr Syst, 94(3): 611-621.
IBGE – Instituto Brasileiro de Geografia e Estatística. 2013. Definições. Accessed on June 13, 2013, on: http://www.ibge.gov.br.
Janotti, P.R., I.C. Rodrigues, A.M. Rodrigues and M.G. Rebelato, 2012. A logística do açúcar e do etanol entre usinas paulistas e o Porto de Santos: um estudo comparativo entre agentes comerciais. Revista de Administração da UNIMEP, 10(2): 101-126.
Kisperska-Moron, D. and S. Krzyzaniak, 2009. (red.). Logistyka. Poznań: Biblioteka Logistyka.
Luchansky, M.S. and J. Monks, 2009. Supply and demand elasticities for the United States ethanol market. Energ Econ, 31(3): 403-410.
97 Jamile Coleti and Andréa Leda Ramos de Oliveira, 2016
Australian Journal of Basic and Applied Sciences, X(X) May 2016, Pages: x-x
Moraes, M.A.F.D., W.M. Zambianco and P.R. Cintra, 2013. Consolidação do setor sucroalcooleiro: impactos na estrutura de mercado e participação de capital estrangeiro. In Agronegócios: Desafios e Oportunidades da Nova Economia, Eds., DÖRR, A. C., J. C. Guse and L. A. R. Freitas. Curitiba: Appris, pp: 339-361.
ODEBRECHT, 2011. Novas soluções para o transporte de etanol. Accessed on 15 September, 2013, on: http://www.odebrecht.com/sala-imprensa/noticias/noticia-detalhes-255.
Oliveira, A.L.R., 2011. O sistema logístico e os impactos da segregação dos grãos diferenciados: desafios para o agronegócio brasileiro, Tese de Doutorado, Univ. Estadual de Campinas, Campinas, SP.
Oliveira, A.L.R., 2015. Logística de Etanol no Brasil. In Futuros do Bioetanol: O Brasil na Liderança, Eds., Salles-Filho, S. (Org.). Rio de Janeiro: Elsevier, pp: 9-33.
Petean, G.H., R.M. Noriller, L.C. Santos, G. Chaebo and F.T. Sanches, 2011. Etanol Hidratado no estado
de São Paulo: previsão de preços a partir do método de Holt-Winters. SIMPEP.
RFA – RENEWABLE FUELS ASSOCIATION, 2014. Monthly U.S. Fuel Ethanol Production/Demand. Accessed on January 2, 2014, on: http://ethanolrfa.org/pages/monthly-fuel-ethanol-production-demand.
Behrends, S. and J. Flodén, 2012. The effect of transhipment costs on the performance of intermodal line-trains. Logist Res., 4(3-4): 127-136.
Salles-Filho, S., 2015. (Org.). Futuros do Bioetanol: O Brasil na Liderança. Rio de Janeiro: Elsevier. Samuelson, P.A., 1952. Spatial price equilibrium and linear program. Am Econ Rev., 42: 283-303.
Satolo, L.F. and J.V. Caixeta-Filho, 2010. Impacto de novas usinas e destilarias na distribuição de etanol hidratado na região Centro-Oeste: uma aplicação do modelo de equilíbrio espacial de preços. In 48º Congresso da Sociedade Brasileira de Economia, Administração e Sociologia Rural (SOBER), Campo Grande.
SECEX., 2014. Ministério do Desenvolvimento, Indústria e Comércio Exterior. Secretaria de Comércio Exterior – SECEX. Exportação NCM Brasileira. Accessed on May 6, 2014, on: http://aliceweb.mdic.gov.br/.
Takayama, T. and G.G. Judge, 1971. Spatial and Temporal Price and Allocation Models. North Holland Publishing Co.
UNICA – UNIÃO DA INDÚSTRIA DE CANA-DE-AÇÚCAR. 2014. Histórico de produção e moagem. 2014. Accessed on January 23, 2015, on: http://www.unicadata.com.br/historico-de-producao-e-moagem.php?idMn=31&tipoHistorico=2.