R E S E A R C H A R T I C L E
Open Access
4D Flexible Atom-Pairs: An efficient probabilistic
conformational space comparison for
ligand-based virtual screening
Andreas Jahn
*, Lars Rosenbaum, Georg Hinselmann and Andreas Zell
Abstract
Background:The performance of 3D-based virtual screening similarity functions is affected by the applied conformations of compounds. Therefore, the results of 3D approaches are often less robust than 2D approaches. The application of 3D methods on multiple conformer data sets normally reduces this weakness, but entails a significant computational overhead. Therefore, we developed a special conformational space encoding by means of Gaussian mixture models and a similarity function that operates on these models. The application of a model-based encoding allows an efficient comparison of the conformational space of compounds.
Results:Comparisons of our 4D flexible atom-pair approach with over 15 state-of-the-art 2D- and 3D-based virtual screening similarity functions on the 40 data sets of the Directory of Useful Decoys show a robust performance of our approach. Even 3D-based approaches that operate on multiple conformers yield inferior results. The 4D flexible atom-pair method achieves an averaged AUC value of 0.78 on the filtered Directory of Useful Decoys data sets. The best 2D- and 3D-based approaches of this study yield an AUC value of 0.74 and 0.72, respectively. As a result, the 4D flexible atom-pair approach achieves an average rank of 1.25 with respect to 15 other state-of-the-art similarity functions and four different evaluation metrics.
Conclusions:Our 4D method yields a robust performance on 40 pharmaceutically relevant targets. The conformational space encoding enables an efficient comparison of the conformational space. Therefore, the weakness of the 3D-based approaches on single conformations is circumvented. With over 100,000 similarity calculations on a single desktop CPU, the utilization of the 4D flexible atom-pair in real-world applications is feasible.
Background
Sorting and comparing molecules from chemical data-bases represent two of the key tasks in cheminformatics [1]. The sorting of such databases, with respect to a given set of queries (molecules) and similarity functions, is known as virtual screening (VS). The goal of VS is to enrich molecules with similar properties (e.g., biological activity) to the query molecules and to discover new chemical entities in a small fraction of the database. To ensure the desired properties (e.g., biological activity) and to evaluate the success of the VS run, it is necessary to further analyze the enriched molecules by means of biological assays. The success of a VS run consists of
two different aspects. First, the enriched molecules should have similar properties as the query molecules. Second, the discovery of new chemical entities that con-sist of different scaffolds in comparison with the query molecules, and, therefore represent an information gain. Based on the focus on a relevant subset of the database and the possible structural information gain, VS experi-ments represent a fundamental approach in the drug discovery pipeline [2,3].
In the last two decades a plethora of different similar-ity functions were proposed [4,5], and the development of new functions is still an open field of research. All similarity functions can be categorized by the dimension of the applied representation of molecules. 1D similarity functions are based on molecular property counts such as molecular weight or number of hydrogen bond * Correspondence: [email protected]
University of Tübingen, Center for Bioinformatics Tübingen (ZBIT), Sand 1, 72076 Tübingen, Germany
acceptors. 2D approaches make use of the adjacency matrix of the molecular graph, and, therefore they are also called topological-based approaches. MOLPRINT2D [6], substructure-based fingerprints like BCI [7] and DAYLIGHT [8] as well as the MACCS [9] keys are well known 2D similarity methods. Those topological or structural fingerprints yield promising results with respect to the enrichment of active molecules, but often lack the ability to discover new chemical entities [10]. 3D similarity functions are based on the shape [11-14] or geometrical distance information [15-17] of mole-cules. Information of the conformational ensembles of molecules extends the 3D-based methods and can be seen as 4D approaches [18,19].
Based on the key-lock principle of Hermann Emil Fischer, it could be expected that the shape of molecules plays an important role for the biological activity. How-ever, the shape of a molecule is not unique, but rather a function of internal parameters like the torsion angles. Hence, each rotatable bond represents a degree of free-dom and increases the number of possible shapes (con-formations) of the molecule. The resulting space, which contains all possible conformations, represents the con-formational space of the molecule. Based on this increased complexity, it is not surprising that several lit-erature studies reported a more robust VS performance of 2D methods in comparison to 3D approaches [20,21]. Further arguments for 2D methods are their simplicity and speed [22].
In a comprehensive study, Venkatraman et al. [21] investigated the performance of different 2D and 3D methods on a wide range of pharmaceutically relevant targets. The results of the study underpin the predomi-nant opinion that 2D-based approaches are superior to 3D approaches with respect to the enrichment of active molecules. The performance of the 2D and 3D approaches with respect to the knowledge gain by means of the discovery of new chemical entities was not evaluated by the study. A possible reason for the inferior performance of 3D methods is the geometric informa-tion that is based on one conformainforma-tion of the molecule [21]. One opportunity to improve the performance of 3D methods is to apply the 3D methods on different conformations of the molecules and use the mean or maximum similarity value. The drawback of this work-around is the quadratic increase in computation time, which scales with the number of conformations. To address this runtime issue, it is necessary to perform the similarity calculation on the complete conformational ensemble in one step in a feasible manner. These limita-tions of 3D approaches also affect the performance of instance-based machine learning QSAR/QSPR models. To improve the robustness of those QSAR/QSPR mod-els, we developed a 4D-based approach that is able to
compare the conformational space of molecules within one step in feasible time [23]. The results showed that our approach produces robust models that are superior to similar 3D and 2D approaches. Given the fact that the reasons for the inferior performance of 3D-based methods seem to be similar in both applications (VS and QSAR/QSPR), it is possible that our 4D-based approach is also able to increase the VS performance in comparison to 2D and 3D methods.
The aim of this study is to evaluate our 4D approach as VS similarity function on a variety of literature VS benchmark data sets. Additionally, we compare the results to state-of-the-art 2D and 3D approaches to assess the performance of our method. We employed VS performance metrics that measure the chemotype enrichment performance to reduce the influence of arti-ficial enrichment. The results show a robust perfor-mance of our approach in comparison to state-of-the-art 2D and 3D approaches. Therefore, our conforma-tional space comparison is able to reduce the weakness of 3D-based methods without the time-demanding pair-wise comparison of individual conformations.
Methods
This section describes our 4D flexible atom-pair (4D FAP) similarity measure on the conformational space of molecules. To allow an efficient comparison of the con-formational space of molecules, our approach needs a special encoding of the conformational ensembles, which can be seen as a preprocessing step. First, We describe our conformational space encoding. Afterwards, a modified Expectation Maximization (EM) algorithm will be presented that computes generative models, which represent the behavior of the molecules in their conformational space. Finally, the actual similarity calcu-lation, which operates on the preprocessed molecules, will be explained.
Conformational Space Encoding
To ensure a fast comparison of the conformational space of molecules, it is necessary to transform the com-plex information of the conformational space of mole-cules into a representation that is suitable for the integration into fast similarity functions. Therefore, we decompose the information of the conformational space into small portions. Given a conformational sampling CMof molecule M with |M| heavy atoms, the encoding
is based on the distance behavior of atom-pairs in the conformational space. Hence, the conformational space CMof moleculeMis segmented into the distance
beha-vior of|M|(|M2|−1)atom-pairs.
|M|(|M|−1)
2 atom-pairs of a moleculeMhave a flexible
tance behavior in the conformational space. The dis-tance relation of neighboring atoms or atoms of a ring system only shows a small variability of the distance. Therefore, our encoding separates the atom-pairs into two disjoint classes: The flexible and the rigid atom-pair
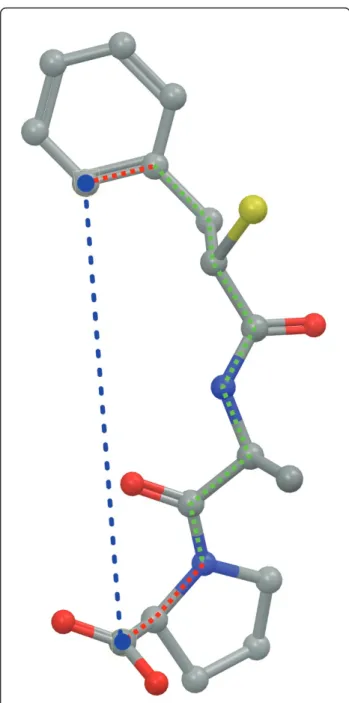
class. The separation is realized by a heuristic that employs the number of rotatable bonds in the shortest path of the corresponding molecular graph. Figure 1 visualizes the shortest path of the marked atom-pair. A bond is supposed to be rotatable if it is a single bond and not a bond of a ring system. If the number of rota-table bonds in the shortest path is ≥ 1, the atom-pair represents a flexible, otherwise a rigid atom-pair. Term-inal rotatable bonds (rotatable bonds that are adjacent to one of the atoms that form the atom-pair) are not counted in the heuristic because a rotation of such a bond has no influence on the distance relation of the atoms (Figure 1).
Given the class of flexible atom-pairs from the heuris-tic above, our encoding measures the distance of each atom-pair and conformation of the given conformational samplingCM. This results into atom-pairs that have |
CM| distance values, where |CM| represents the number
of sampled conformers of moleculeM. We refer to the atom-pairs containing the distance information in the conformational space as distance profiles.
These distance profiles can be visualized by means of normalized histograms, which represent the relative fre-quency of observing the corresponding atom-pair dis-tance within a binned disdis-tance range. A histogram-based visualization of the distance profile from the atom-pair of Figure 1 can be seen in Figure 2. The application of histograms in a similarity function entails two major drawbacks. First, the binning size represents a parameter and has substantial impact on the resulting similarity value. Second, the storage of the information
Figure 1Shortest flexible atom-pair path. Exemplary visualization of an atom-pair of the marked atoms. The shortest topological path is depicted by the red and green dotted lines. A red line represents a rigid bond, whereas a green line marks a rotatable bond. The last bond of the path (bond from the heterocycle to the carbon of the carboxyl group) is treated as a rigid bond because a rotation of this bond has no influence on the geometric distance of the atom-pair.
needs more space than a model-based encoding. There-fore, we decided to describe the distance behavior in the conformational space by means of Gaussian Mixture Models (GMMs). After the encoding of the distance profiles as GMMs the preprocessing of the molecules is finished.
Gaussian Mixture Models and Parameter Estimation on Distance Profiles
Mixture models are probabilistic models that represent a complex distribution based on a linear combination of individual sub-distributions. Applying Gaussian distribu-tions as sub-distribudistribu-tions in a mixture model yields a GMM as given in Equation 1, wherep(x) represents the probability density at the point x, πc determines the
weight of the c-th Gaussian distribution, and
N(x|μc,c)depicts the c-th Gaussian distribution with meanμc and covariance matrixΣc.
p(x) = C
c=1
πcN(x|μc,c) (1)
GMMs are generative models for real-world data and involve two advantages in our application. First, a con-formational ensemble of a molecule represents only a discrete sampled approximation of the complete con-formational space. Therefore, the flexible atom-pairs contain a series of sampled distance values. A genera-tive model, fitted to the distance values, represents a continuous function, and, therefore describes a more realistic model in comparison to discrete or binned values. Second, the models can be efficiently stored because only the model parameters are necessary for a similarity calculation between such models. A draw-back of the GMMs is the parameter estimation for a given data set. Given the distance values of a flexible atom-pair, it is necessary to fit the parameters πc, μc,
Σc, andC(number of Gaussian components) of
Equa-tion 1 to the distance values. A popular approach to determine the parameters of a mixture model is the Expectation Maximization (EM) algorithm [24]. This algorithm is based on the maximum likelihood frame-work and optimizes the objective function given in Equation 2.
arg max
π,μ, lnp(X|π,μ,) =
|X|
n=1 ln
C
c=1
πcN(xn|μc,c)
(2)
The EM algorithm represents an iterative process that consists of two steps. The first step (E-step) evaluates the responsibilities that the k-th component of the GMM was responsible for generating the n-th (xn) data
point of the given data setX(Equation 3).
rnk= πkN(xn|μk,k) C
c=1π
cN(xn|μc,c)
(3)
The second step (M-step) updates the parameters of the GMM on the basis of the responsibilities of the pre-vious E-step (Equation 4-7).
Nk=
|X|
n=1
rnk (4)
μt+1
k = 1
Nk
|X|
n=1
rnkxn (5)
t+1
k = 1
Nk
|X|
n=1
rnk(xn−μtk+1) (xn−μtk+1)T (6)
πt+1
k =
Nk
|X| (7)
These two steps are repeated until a predefined con-vergence criterion is reached. The EM algorithm opti-mizes the parameters of the GMM and guarantees a local optimum solution. Therefore, it is necessary to execute the EM algorithm with different initial para-meters to avoid a model from a local optimum with an inferior likelihood value.
The EM algorithm estimates the parameters of a GMM based on a predefined number of Gaussian com-ponents. A suitable number of components is crucial for a useful model. Therefore, a model selection step that determines an optimal number of components is neces-sary. To reduce the risk of overfitting (high number of Gaussian components), several model selection criter-ions, such as the Bayesian information criterion [25] or the Akaike information criterion [26], were proposed that penalize an increased number of components. This model selection step involves a significant runtime over-head and can be avoided if the number of sub-distribu-tions can be estimated. In our application, a GMM has to model the distance behavior of the corresponding atom-pair in the conformational space. The distance behavior of an atom-pair can be seen as a function of the flexibility of the shortest path in the molecular graph.
[23]. This heuristic avoids the model selection step and reduces the runtime of the preprocessing step. Figure 2 presents the GMM that models the distance behavior of the atom-pair in Figure 1. The presented EM algorithm assumes that all samples of the data set are equally important for the final model. Transferred to our appli-cation this means that each conformation has the same influence on the final model. Based on a thermodynamic point of view, this assumption of equal influence holds if all conformations of the ensemble have the same energy. To emphasize the influence of low energy conforma-tions on the final model, we developed an extension of the EM algorithm that integrates the importance of each sample into the optimization process. In an earlier study, our modified EM algorithm generated improved QSAR/QSPR models in comparison to models based on equally weighted GMMs [27].
Boltzmann Weighted Expectation Maximization Algorithm To increase the importance of low energy conformations on the final GMMs of a molecule, we apply the normal-ized Boltzmann distribution as given in Equation 8 to determine a probability value for a given conformer.
ΔEnrepresents the energy offset of the n-th conformer
to the global optimum of the conformational ensemble, R presents the gas constant, and T the temperature of the canonical ensemble.
pn(En) =
e
−En
RT
|X|
j=1
e
−E j
RT
(8)
These probability values have to be integrated into the EM algorithm and modify the objective function as out-lined in Equation 9, where Esymbolizes a vector con-taining the energy values of the conformers and p(En)
depicts the probability of the n-th conformation.
arg max
π,μ, lnp(X,E|μ,,π) =
|X|
n=1
ln
C
c=1
πcN(xn|μc,c)pn(En)
(9)
The E-step (computation of the responsibilities) remains unchanged, and, therefore the responsibilities are calculated as stated in the Equation 3. However, the equations of the M-step (update of the parameters) need the integration of the probability values as listed in the Equations 10-13.
Nk=
|X|
n=1
rnkpn(En) (10)
μt+1
k = 1
Nk
|X|
n=1
rnkxnpn(En) (11)
t+1
k = 1
Nk
|X|
n=1
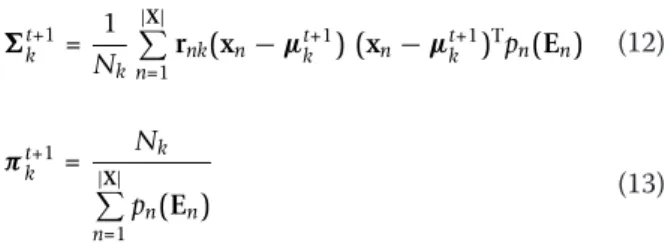
rnk(xn−μtk+1) (xn−μtk+1)Tpn(En) (12)
πt+1
k =
Nk
|X|
n=1
pn(En)
(13)
Based on the described modifications, the EM algo-rithm computes GMMs that represent the distance behavior of atom-pairs as a function of the frequency of observing an atom-pair at a certain distance as well as the probability that the canonical ensemble will occupy these states (conformations). Figure 3 visualizes a weighted (probabilities of the conformations) histogram-based representation of the same atom-pair visualized in Figure 2. The Boltzmann weighted model of Figure 3 shows that the distances at 9.25 Å and 11 Å are energe-tically favorable, and, therefore the probability density is increased in comparison to the unweighted model of Figure 2. In contrast, the conformations with low range distances have higher energy values and, as a conse-quence, the corresponding probability densities are reduced.
4D Flexible Atom-Pair Similarity Function
After the preprocessing of the molecules (encoding the distance distributions by means of GMMs) the actual 4D similarity calculation can be conducted. The similar-ity function operates on the molecular graph (adjacency matrix) and the GMMs of the flexible atom-pairs.
Therefore, the conformational ensemble of the mole-cules is not further needed.
In a first step, the 4D FAP creates for each heavy atom of the molecule an atom-pair prefix tree. This data structure represents an efficient approach for search and comparison operations and was already applied as a data structure for an atom-pair-based similarity measure [28,29]. Each prefix tree has one atom as root node and contains all atom-pair information to the remaining |M| - 1 heavy atoms of the molecule (leaves of the tree). The preprocessing step divides the atom-pairs into two disjoint classes. Therefore, an atom-pair tree Tcontains the two different sub-trees R andF for the rigid and flexible atom-pair class, respectively. The rigid sub-tree Rcontains the information of the rigid atom-pairs that were not modeled by GMMs. To increase the informa-tion content of the rigid atom-pairs, the sub-tree addi-tionally contains the topological distance information of each atom-pair. An example of such an atom-pair tree can be seen in Figure 4.
The nodes in these prefix trees can be labeled by any arbitrary atom typing scheme. We applied a labeling function that consists of three different elements. The first element is the element symbol of the atom. A ring flag indicates the membership to a ring system. The final value is the result of the number of neighboring heavy atoms minus the number of neighboring hydro-gen atoms.
Given the prefix trees of two moleculesAandB, the 4D FAP computes a similarity matrix S, where each entry represents the similarity value between two atom-pair trees. Based on the two different sub-trees, an entry Sij
in the similarity matrix is the sum of two distinct similarity calculations(Sij=Sij
rigid(Ri,Rj) +S
ij
flexible(Fi,Fj))
on the sub-trees. Hence, the 4D FAP utilizes different similarity functions for the sub-trees.
The rigid sub-tree contains the labels of the atoms and a topological distance value. This type of informa-tion represents nominal features and enables the use of simple similarity functions. We applied the Tanimoto similarity function as stated in Equation 14.Ri and Rj
represent the rigid atom-pair sub-trees of thei-th andj -th atom, respectively.
Sijrigid(Ri,Rj) = |
Ri∩Rj|
|Ri∪Rj| (14)
The comparison of the flexible atom-pair sub-tree consists of two different similarity functions. Given the flexible atom-pair sub-treesFiand Fjcontaining |Fi| and
|Fj| flexible atom-pairs (number of leaves in the
sub-tree). The first function compares the atom labels of two given flexible atom-pairs APnÎFiand APmÎ Fjas
presented in Equation 15.lmandln represent the atom
labels of the atom-pairs. The function is a Dirac func-tion on the atom labels and returns a value of 1.0 if the labels are equal and 0 otherwise.
sDirac(APm, APn) =
1, iflm=ln
0 else (15)
The second similarity function compares the behavior of the atom-pairs in the conformational space. For this purpose, a correlation measure on GMMs is applied as denoted in Equation 16, wheregm andgnsymbolize the
GMMs of the flexible atom-pair APm and APn,
respec-tively.
sGMM(APm, APn) =
gm(x)gn(x)dx (16)
The assembly of both similarity functions for flexible atom-pairs results in Equation 17 and represents the
similarity function for the flexible atom-pair sub-tree.
Sijflexible(Fi,Fj) =
|Fi|,|Fj|
APm∈Fi,APn∈Fj
sDirac(lm,ln)sGMM(gm,gn)(17)
Unlike the similarity function for the rigid atom-pair sub-tree, the similarity function for the flexible atom-pair sub-tree is not based on nominal features. There-fore, Equation 17 performs a pair-wise comparison of all atom-pairs and sums up the individual similarity scores. To avoid overestimated similarity values of sub-trees with an increased number of flexible atom-pairs, the similarity value is normalized by Equation 18
Sijflexible(Fi,Fj)←
Sijflexible(Fi,Fj)
Sii
flexible(Fi,Fi)Sjjflexible(Fj,Fj) (18)
After computation of the similarity matrix S, which contains all pair-wise similarity values of the atom-pair trees, the 4D FAP computes a final similarity value based on the matrix S. The original 4D FAP, as applied in QSAR/QSPR studies [23,27], sums up the entries of theS matrix and normalizes the sum to obtain a value in the range [0.0, 1.0]. Another possibility to compute a final similarity value represents the optimal assignment. This approach was introduced into the field of chemin-formatics by Fröhlich et al. [30,31] and applied as a VS similarity function in a previous study [28].
Preliminary experiments (not published) showed that an optimal assignment on the matrixSimproves the VS performance in comparison to the normalized summa-tion of the matrix elements. Therefore, we changed the final computation step of the 4D FAP to perform an optimal assignment on the matrixS as stated in Equa-tion 19. Given the moleculesAand B(with |A| < |B| w. l.o.g.),πrepresents a function that maps each value of i Î [1, ..., |A|] on a value in the range [1, ..., |B|] in such a way that the sum of the similarity entries is maxi-mized. The final sum of the optimal assigned similarity values of the atom-pair trees is also normalized by Equation 18. We refer to the optimal assignment-based variant of the 4D FAP as 4D FAPOA.
4D FAPOA(A,B) = arg max
π
|A|
i
Siπ(i) (19)
Experimental
In this section we initially characterize the applied VS benchmark data sets as well as their preparation step. Afterwards, the protocol for the conformational sam-pling of the molecules as well as a short description of
the VS evaluation metrics follow. Finally, we present a brief overview of literature VS methods that were applied to classify the results of the 4D FAPOA.
Data sets
To evaluate the 4D FAPOAon a wide range of
pharma-ceutically relevant targets, we employed the directory of useful decoys (DUDs) release 2 [32]. These data sets were introduced as a benchmark data set compilation for the evaluation of docking algorithms [33]. Ligand-based VS, Ligand-based on similarity values to a query struc-ture, can be afflicted with an analogue enrichment bias. This bias results from the enrichment of structurally similar molecules with respect to the query structure. These similar structures represent only a limited infor-mation gain, and, therefore the results of the experiment will have an analogue enrichment bias.
To reduce this bias and to enable a fair comparison between similarity-based and docking-based algorithms, Good and Oprea applied a lead-like filter [34] on the data sets and clustered the actives [35]. These filtered and clustered data sets were already applied in a ligand-based VS study [28] and are publicly available [36]. Table 1 shows a complete overview of the 40 targets and the number of actives and decoys for the DUD release 2 and the filtered variant. For the VS experi-ments we applied the target ligands as query structure for the respective active and decoy data set. The data sets were not further modified to allow a fair compari-son of the results.
The evaluation of similarity functions by means of the DUD data sets represents a retrospective evaluation. Analogous to the“Kubinyi paradox” [37] of QSAR mod-els, the solely retrospective evaluation possibly implies the risk that the development of new methods or the improvement of existing approaches will increase their retrospective performance at the expense of the pro-spective performance. However, the DUD data sets con-tain over 100,000 molecules for 40 different targets. Consequently, the evaluation on all 40 data sets is based on an increased molecular diversity in comparison with the usually smaller and less diverse benchmark data sets of QSAR experiments. Therefore, the risk of an inferior prospective performance of VS similarity functions as a result of their optimization for the retrospective perfor-mance is reduced but still present.
Conformational sampling
To compute useful GMMs in the preprocessing step, it is necessary to sample the conformational space at a high resolution. Therefore, we modified the‘ comprehen-sive’parameter scheme of ConfGen to further increase the resolution. We reduced the heavy atom rmsd for distinct conformers from 0.5 Å to 0.1 Å. This modifica-tion results in more conformers but does not increase
the runtime of the conformational sampling. The energy values, which are necessary for the Boltzmann weighted GMMs, were computed by the OPLS 2005 force-field with standard parameters.
The applied conformational sampling algorithm as well as the force-field model have a major impact on the final results of the 4D FAPOA. Different
conforma-tional sampling algorithms compute different sets of conformers, which in turn yield different atom-pair dis-tance profiles. The force-field computes an energy value for each conformer and determines the weight of each measured atom-pair distance. As a result, a different conformational sampling protocol will yield different GMMs of the atom-pairs. Hence, the computed similar-ity values differ and will probably change the results. However, the aim of this study is not the evaluation of the impact of different conformational sampling proto-cols on the 4D FAPOA, but the evaluation of the 4D
FAPOA as a VS similarity function based on the given
protocol.
Evaluation metrics
To evaluate the performance of our 4D FAPOA
approach, we applied different standard evaluation metrics. The receiver operating characteristic (ROC) curve represents a function that plots the true positive rate as a function of the false positive rate. The area under the ROC curve (AUC) represents a quantification of the curve and facilitates an easier comparison of results. The AUC is calculated as given in Equation 20, where Nactives depicts the number of actives, Ndecoys
represents the number of decoys, and Ni
decoys seen
describes the number of decoys that are higher ranked than thei-th active structure. The received value is in the range [0.0, 1.0], where 0.5 indicates a random per-formance.
AUC = 1− 1
Nactives
Nactives
i
Ni
decoys seen
Ndecoys
(20)
The AUC metric represents a measure that evaluates the performance on the complete data. However, a major goal of VS experiments is the enrichment of active structures in a small fraction of the database. Therefore, it is necessary to apply additional metrics that focus on the early enrichment behavior. A common metric for the early enrichment problem is the enrich-ment factor at a predefined fraction of the data set (x%) as given in Equation 21.
EFx%=
Nactives seen
Nx%
Nactives
Nactives+Ndecoys
(21) Table 1 DUD data sets
Filtered sets Original sets
target actives decoy actives decoys
ACE 46 1796 49 1797
AChE 99 3859 107 3891
ADA 23 927 39 927
ALR2 26 986 26 995
AmpC 21 786 21 786
AR 68 2848 79 2854
CDK2 47 2070 72 2074
COMT 11 468 11 468
COX-1 23 910 25 911
COX-2 212 12606 426 13289
DHFR 190 8350 410 8366
EGFr 365 10303 475 15996
ERagonist 63 2568 67 2570 ERantagonist 18 1058 39 1448
FGFr1 71 3462 120 4550
FXa 64 1633 146 5743
GART 8 155 40 879
GPB 52 2135 52 2947
GR 32 2585 78 2947
HIVPR 4 9 62 2038
HIVRT 34 1494 43 1519
HMGR 25 1423 35 3478
HSP90 23 975 37 979
InhA 57 2707 86 3266
MR 13 636 15 634
NA 49 1713 49 1874
P38 137 6779 454 9140
PARP 31 1350 35 1351
PDE5 26 1697 88 1977
PDGFrb 124 5603 170 5980
PNP 25 1036 49 1036
PPARg 6 40 85 3117
PR 22 920 27 1041
RXRa 18 575 20 750
SAHH 33 1346 33 1346
SRC 98 5679 159 6319
thrombin 23 1148 72 2456
TK 22 891 22 891
trypsin 9 718 49 1664
VEGFr2 48 2712 88 2906
The enrichment factor depends on the number of actives, and, therefore it is not a robust metric. Korff et al. [41] proposed the relative enrichment factor (REF) as stated in Equation 22 to remove the dependency on the number of actives structures.
REFx%=
100·Nactives seen
min (Nx%,Nactives)
(22)
The enrichment of active structures that are based on different scaffolds emerged to an additional impor-tant goal of VS experiments. All metrics that evaluate the so-called chemotype enrichment are based on a clustering of the active structures into different chemo-types (scaffolds). Mackey and Melville showed the inte-gration of the scaffold information into common VS metrics [42]. We decided to apply the arithmetic weighting on the ROC enrichment as given in Equa-tion 23. Based on the informaEqua-tion of the clustering, a structure i obtains a weight that is inversely propor-tional to the number of structures (Nj) in the cluster αx%
ji . αjix%represents a binary function that returns 1 if thei-th active structure of the j-th cluster is contained in the firstx% of the data set.
awROCEx%= Nclusters
j Nj i
wjiαx%
ji
Nclusters
Nx%
decoys seen
Ndecoys
(23)
The evaluation metrics listed above represent only a small fraction of possible metrics. Other popular metrics for the early enrichment evaluation are the BEDROC [43] score or the enrichment factor. To enable future comparisons with the presented results of the 4D FAPOA, we computed for each target of the filtered
DUD data set a result file that contains several addi-tional VS metrics (e.g., BEDROC score at nine prede-fined alpha values). Additionally, the files contain the complete ranking of the molecules that allows the com-putation of the VS metric of choice. The 40 result files are contained in the additional file 1 of this study.
Literature Similarity Functions
We employed a wide range of different 2D and 3D simi-larity approaches to assess the performance of the 4D FAPOA. Due to the fact that we compare our approach
to 20 other approaches, we only mention the name of the method and the applied type of information. For a comprehensive description we refer to the original publications.
Different optimal assignment approaches were already evaluated on the filtered DUD data sets in an earlier publication [28]. The best approach of this study was a
two-step hierarchical assignment (2SHA) that first oper-ates on a substructure level and afterwards on the atomic level. A second approach of that study optimally assigns the atom-pair (OAAP) environment trees and represents a similar 3D concept in comparison to the 4D FAPOA. The optimal assignment kernel (OAK)
[30,31] and its flexibility extension, the OAKFLEX[44],
were also evaluated in this earlier publication.
Cheeseright et al. [45] introduced FieldScreen as a multiconformer-based VS tool. FieldScreen utilizes a database that contains conformers of each molecule. Therefore, it operates on a conformational ensemble in a similar way as the 4D FAPOAand represents an
inter-esting reference approach. FieldScreen employs four dif-ferent types of locally optimized molecular field points to compute a similarity value between two given molecules.
Venkatraman et al. conducted a comparison study in which a plethora of different 2D and 3D approaches were evaluated on the original as well as the filtered DUD data sets [21]. We compared the performance of the 4D FAPOA to the main results of this study. The
study conducted by Venkatraman et al. employed the 2D fingerprint methods: OPENBABEL [46], DAYLIGHT [8], BCI [7], MACCS [9], and MOLPRINT2D [6]. As 3D-based approaches they utilized ROCS [12] with two different scoring schemes ROCSS (shape only) and ROCSSC(shape and chemistry). The EON [47] approach
compares the electrostatic fields computed by the Pois-son-Boltzmann equation and was also evaluated using two different parameterizations. EONSEis based on the
shape and the electrostatic, whereas EONSCE
addition-ally uses chemical information.
SHAEP [14] is based on a maximum common sub-graph approach that is employed to perform a superpo-sition of the molecules. The method operates only on the shape of molecules (SHAPES) or on the shape and
the electrostatic (SHAPESE). The Ultrafast Shape
Recog-nition (USR) [17] employs four distance relations of each atom and computes the first three moments of each distribution to obtain 12 descriptor values for each molecule. ESHAPE3D is based on a heavy atom distance matrix that is employed to compute fingerprints. The ESHAPEHYD alternatively uses the hydrophobic heavy
atoms.
between these pharmacophore features plays an impor-tant role and can be measured in a topological or geo-metrical manner. Therefore, the pharmacophore-based approaches can also be divided into 2D- and 3D-based approaches. Korff et al. [41] compared different struc-ture- and ligand-based VS approaches on the DUD data sets. This study contains two different pharmacophore-based methods. The topological pharmacophore point histogram (TopPPHist) computes for each pair of phar-macophore classes a distance histogram based on the topological distances. Therefore, the TopPPHist repre-sents a 2D-based pharmacophore approach. Finally, the distance histograms are converted into a descriptor vec-tor. The Flexophore approach [1,41] computes geome-trical and binned distance histograms for each pharmacophore point pair based on a representative set of given conformers. The final comparison between two molecules is similar to the maximum common sub-graph-isomorphism because the pharmacophore points together with the distance histograms form complete graphs.
Results and Discussion
The results section is divided into four different subsec-tions. The first subsection compares the results of the 4D FAPOA approach with other optimal
assignment-based approaches that were already evaluated on the DUD data sets [28]. The second part is based on the results of Venkatraman et al. [21] and compares the average performance of the 4D FAPOAwith 15
state-of-the-art 2D and 3D approaches. Afterwards, a compari-son with the pharmacophore-based approaches of Korff et al. [41] follows. The final subsection focuses on the performance difference between 3D approaches on mul-tiple conformers and our 4D FAPOA approach.
Comparison with other Optimal Assignment Methods The comparison with other optimal assignment methods measures the influence of the applied information type on the final performance. The OAAP represents the comparable 3D approach in comparison with the 4D FAPOA, and, therefore directly measures the
perfor-mance gain of the 4D extension. As an early enrichment metric we applied the awROCE5%, which also assesses
the chemotype enrichment performance. To reduce the bias introduced by a low number of chemotypes, we only applied data sets that have at least 15 different che-motypes. The AUC value was applied to evaluate the performance on the complete data sets.
Table 2 shows the results of the four optimal assign-ment methods and the 4D FAPOA. The direct
compari-son of the OAAP and the 4D FAPOAindicates that the
4D FAPOAoutperforms the OAAP on 10 out of 13 data
sets with respect to both performance measures. The
OAAP is superior to the 4D FAPOA on the COX2,
HIVRT, and the PDGFrb data sets. These three data sets are more rigid data sets with respect to the number of rotatable bonds of the query compounds. The query compounds of COX2, HIVRT, and PDGFrb have 5, 9, and 7 rotatable bonds, respectively. In comparison, the most flexible data sets are the ACE and EGFr data sets with 18 and 14 rotatable bonds, respectively. The corre-lation between the performance gain on the AUC metric
(AUC4D FAPOA−AUCOAAP)and the number of rotatable bonds of the query structure amounts to 0.54. Based on
the equationt=r
n−2
1−r2, wherenis the number of sam-ples (13 data sets) andr the correlation, the probability that both variables (AUC performance gain and flexibil-ity of query compounds) result in such a correlation if there is no true correlation of the variables (r = 0.0) is 0.0277. Therefore, the correlation is significant (p= 0.05) and indicates that the performance gain of the 4D FAPOAis a function of the flexibility of the data set. In
comparison to the other optimal assignment methods there is no correlation apparent. However, the OAK, OAKFLEX, and 2SHA are based on a different type of
information (local atom similarity based on atom and bond features), and therefore, a direct comparison of the correlations is not meaningful.
The comparisons of the 4D FAPOAwith all other
opti-mal assignment approaches show that the 4D FAPOA
outperforms all other methods on 6 and 9 data sets with respect to the awROCE5% and AUC, respectively.
These results yield a best average rank of 1.58 for the 4D FAPOA with respect to the AUC. For the awROCE5%
results the 2SHA achieves the best average rank of 2.15 followed by the 4D FAPOAwith an average rank of 2.31.
In a direct comparison the 4D FAPOAoutperforms the
2SHA approach on 7 data sets, whereas the reverse case only occurs on 5 data sets. To conclude, the 4D FAPOA
shows a robust performance on 13 data sets. Consider-ing the results of the complete data sets (AUC) the 4D FAPOAoutperforms all other optimal assignment
meth-ods. The ability of 4D FAPOAto early enrich different
scaffolds is comparable with the 2SHA approach. The encoding of the conformational space should be most beneficial if the flexibility of the query structure is high. Therefore, we discuss the results on the two data sets with the most flexible query compounds, the ACE and EGFr data set, in more detail.
Figure 5 shows the ROC plot of all optimal assign-ment methods on the ACE data set. The curve of the 4D FAPOApasses always above the other curves with
the exception of the 2SHA curve between 0.3 and 0.4 false positive rate. In the early enrichment range (0.0 -0.1 false positive rate) the 4D FAPOAshows a strong
phases of stagnation (horizontal elements in the curve). The other optimal assignment methods show a similar behavior till≈ 0.03 false positive rate, but they stagnate until≈ 0.1 false positive rate. Therefore, the 4D FAPOA
has an offset of the true positive rate of nearly 0.2 in comparison to the other methods. The 4D FAPOA is
also the first approach that is able to retrieve all actives of the data set (≈ 0.7 false positive rate). The second approach that retrieves all actives is the 2SHA approach at a false positive rate of ≈ 0.9. The comparable 3D approach (OAAP) is always inferior in comparison to the 4D FAPOA.
To evaluate the chemotype discovery on the complete data set, we plotted the fraction of the discovered che-motypes as a function of the fraction of the ranked data set. A chemotype is considered as discovered if one compound of the chemotype is ranked.
Figure 6 presents the chemotype discovery of all opti-mal assignment approaches on the ACE data set. The curves of the 4D FAPOA, 2SHA, OAK, and OAKFLEX
show a similar behavior over the complete data set. Only the OAAP has an inferior chemotype discovery rate until≈ 40% of the data set. Therefore, the informa-tion gain by discovering new chemotypes is increased by the 4D FAPOAin comparison to its similar 3D method
Table 2 Optimal assignment methods results
OAK OAKFLEX 2SHA OAAP 4D FAPOA
target awROCE5% AUC awROCE5% AUC awROCE5% AUC awROCE5% AUC awROCE5% AUC
ACE 12.1 0.78 12.1 0.76 11.6 0.82 8.0 0.58 12.2 0.88
AChE 3.9 0.69 4.4 0.71 5.4 0.74 4.0 0.71 7.6 0.75
CDK2 2.6 0.57 2.6 0.47 3.5 0.50 3.5 0.55 3.5 0.77
COX2 9.0 0.88 8.8 0.89 9.7 0.87 12.2 0.93 11.9 0.89
EGFr 11.6 0.76 11.3 0.75 12.1 0.74 7.3 0.51 18.0 0.99
FXa 2.1 0.43 1.1 0.51 2.6 0.59 2.1 0.58 3.2 0.64
HIVRT 3.3 0.53 3.3 0.48 3.5 0.60 5.1 0.65 2.3 0.58
InhA 8.6 0.54 5.7 0.53 9.4 0.63 7.0 0.57 7.8 0.66
P38 4.3 0.43 4.0 0.44 5.0 0.75 2.9 0.45 3.1 0.68
PDE5 2.3 0.46 1.4 0.41 2.7 0.47 1.4 0.38 3.6 0.69
PDGFrb 4.9 0.44 4.9 0.38 4.5 0.34 8.6 0.42 4.9 0.66
SRC 3.7 0.67 4.5 0.64 6.4 0.72 1.0 0.45 2.7 0.51
VEGFr2 1.3 0.28 1.3 0.30 4.5 0.47 2.6 0.39 3.2 0.67
avg. rank 3.35 3.54 3.81 3.77 2.15 2.62 3.38 3.35 2.31 1.58
awROCE5% and AUC performance of the OAK, OAKFLEX, 2SHA, OAAP, and 4D FAPOA. The approaches were evaluated on the 13 filtered DUD data sets that entail at least 15 different chemotypes in the active data set.
Bold values indicate the best results on the corresponding data set and metric. The last row contains the average rank of the corresponding approach with respect to the metric and the other approaches.
Figure 5ROC plot on ACE. ROC plot of all optimal assignment methods on the filtered ACE data set. TPR and FPR denote the true positive rate and false positive rate, respectively.
(OAAP). However, the other approaches that are based on a different type of information (OAK, OAKFLEX, and
2SHA) show a similar discovery rate.
The ROC plots and the chemotype discovery on the EGFr data set can be seen in the Figures 7 and 8, respectively. In both figures a considerably performance gain of the 4D FAPOA is apparent. The 4D FAPOA is
able to retrieve all actives within ≈30% of the data set (Figure 7). All chemotypes were discovered within 23% of the data set (Figure 8). All other optimal assignment methods retrieve at least 20% of the actives and at least 15% of the chemotypes within the last percent of the data set. In comparison to the OAAP the performance gain of the 4D FAPOAis approximately twice that of the
OAK, OAKFLEX, and 2SHA. Therefore, our encoding of
the conformational space entails a significant perfor-mance gain on the EGFr data set.
Another important property of a VS similarity func-tion is the computafunc-tion performance. To enable a VS experiment on a real-world database, the VS similarity function should be able to process a reasonable number of compounds in a feasible time. All presented VS simi-larity functions that are based on the optimal assign-ment approach were developed at our departassign-ment, and, therefore we are able to perform a fair comparison of the computation time. We computed the average com-putation time of each optimal assignment method on the 13 data sets, which were used in Table 2, to
approx-imate a reasonable performance for drug-like
compounds.
The 4D FAPOA approach has an averaged
perfor-mance of 38.8 ± 27.56 similarity calculations per second. This computation time is based on preprocessed mole-cules (GMMs already computed). The OAK yields 27.34 ± 3.40 calculations per second, whereas its flexibility extension (OAKFLEX) computes 41.03 ± 7.32 molecules
per second. The OAAP represents the fastest approach with 51.49 ± 18.07 computations per second. In con-trast, the 2SHA is the slowest method with a throughput of 14.04 ± 1.78 per second. All calculations were done on a Core2Duo CPU with 2 GHz using one core and 1 GB memory. As a result, the 4D FAPOAis fast enough
to screen over 100,000 molecules within one hour on a desktop CPU using only one core. The similarity calcu-lation can be easily parallelized to further increase the throughput, and, therefore the approach should be fast enough for real-world applications.
The preprocessing step (conformational sampling and GMM calculation) represents an additional computa-tional task of our approach. However, the preprocessing step has only to be computed once for each molecule. Additionally, the computation of different conformers (conformational sampling) is often necessary for differ-ent tasks in the drug discovery pipeline. Furthermore, our encoding is a model-based encoding that reduces the memory usage in a database in comparison to the storage of multiple conformers of a molecule.
Comparison with State-of-the-Art 2D and 3D Approaches In this subsection we compare the performance of the 4D FAPOA with different state-of-the-art 2D and 3D
approaches. Venkatraman et al. [21] conducted a com-prehensive evaluation of 15 different literature methods on the DUD data sets. The study contains the averaged (over all 40 data sets) relative enrichment factors at 1%, 5%, and 10% as well as the AUC values for each method. Unfortunately, the study lacks any evaluation metric that rates the chemotype discovery of the approaches. Therefore, the results in this section are Figure 7ROC plot on EGFr. ROC plot of all optimal assignment
methods on the filtered EGFr data set.
only based on the early enrichment (relative enrichment factors) and the performance on the complete data set (AUC). All results are based on the filtered data sets and compiled in Table 3.
The results of Table 3 confirm that the 2D approaches are more robust in comparison to the 3D methods. Only the ROCSSCis able to yield comparable
results in comparison to the MACCS keys and MOL-PRINT2D. The 4D FAPOAis able to utilize the GMMs
as a source of reasonable information, and, therefore the approach yields the best results with respect to the relative enrichment factor at 5% and 10% as well as the AUC metric. Only the BCI approach is able to marginally improve the results with respect to the rela-tive enrichment factor at 1%. The best performance of the 4D FAPOA on three out of four metrics results in
the best average rank of 1.25. The BCI and DAY-LIGHT fingerprints yield an average rank of 2.75 and represent the best 2D-based approach. ROCSSC is the
best 3D-based approach with an average rank of 5.0, and, therefore higher ranked as the 2D-based approaches MOLPRINT2D (6.0) and the MACCS keys (7.0). All other 3D-based methods are inferior in com-parison to the 2D-based approaches. To conclude, the 4D FAPOA benefits from the conformational space
information and is able to yield the best average per-formance of all methods.
Comparison with Pharmacophore-Based Approaches Korff et al. [41] evaluated the TopPPHist and the Flexo-phore approach on the 40 targets of the DUD data sets. The early enrichment performance was assessed by the relative enrichment factor at 1% of the data set. To eval-uate the chemotype enrichment, Korff et al. counted the discovered chemotypes within the enriched data set fraction with respect to the chemotype definition of Good and Oprea [35]. Table 4 lists the relative enrich-ment factors and the number of discovered chemotypes for each of the 40 data sets of the DUD.
With respect to the early enrichment performance the TopPPHist and the Flexophore approach achieved an average relative enrichment factor of 37.34 ± 31.38 and 43.31 ± 33.25, respectively. The application of the 4D FAPOAresulted in an average relative enrichment factor
of 55.45 ± 33.26 and increased the performance of the Flexophore approach by over 20%. However, based on their abstract representation of molecules, one of the strengths of pharmacophore-based approaches is the ability to discover new chemical entities. This abstrac-tion from the query scaffold can be seen in the chemo-type discovery results of Table 4. The Flexophore approach needs ≈ 20% less active compounds to dis-cover a similar amount of chemotypes (94) in compari-son with the 4D FAPOA (98). The 2D-based TopPPHist discovered only 66 chemotypes over all 40 data sets and showed an inferior chemotype discovery in comparison with the 4D-based approaches (Flexophore, 4D FAPOA).
Comparison with Multiple Conformer Approaches
The results of the previous sections demonstrated the inferior performance of 3D-based approaches in com-parison with 2D-based methods. A common technique to tackle this deficit of 3D approaches is to utilize multi-ple conformers and average or use the maximum of all pair-wise similarity values. The number of necessary similarity computations scales with O(n2), where n represents the number of conformers of the molecules. Therefore, this technique implies a significant increase in computation time. However, the averaging over mul-tiple conformers increases the available information con-tent of the 3D-based approaches to a level that is similar in comparison to the 4D FAPOA. The 4D FAPOAhas a
model-based description of the conformational space, whereas the 3D-based approaches explicitly have the conformational space. Consequently, a comparison of the 4D FAPOAwith 3D-based approaches on multiple
conformers represents an interesting comparison based on a equal source of information.
Venkatraman et al. [21] evaluated the ROCSSC (best
3D-based approach of Table 3) in three additional experiments on the unfiltered DUD data sets with dif-ferent ensembles of size 10, 100, and 1000 conformers Table 3 Average REF and AUC performance
method REF1% REF5% REF10% AUC avg.
rank
BABEL 44.4 ± 28.4 41.1 ± 25.4 49.6 ± 26.6 0.74 3.25 DAYLIGHT 43.9 ± 28.7 41.8 ± 25.8 52.2 ± 26.7 0.74 2.75 MACCS 30.5 ± 25.7 29.7 ± 22.8 39.6 ± 23.3 0.69 7.0
BCI 46.7±
31.7
41.3 ± 28.5 49.1 ± 29.7 0.74 2.75
MOLPRINT2D 34.5 ± 28.3 33.8 ± 26.9 40.9 ± 30.2 0.70 6.0
PARAFITS 19.1 ± 20.3 24.4 ± 20.1 33.0 ± 22.4 0.67 12.5 ROCSSC 36.8 ± 29.7 35.2 ± 27.1 44.0 ± 28.7 0.72 5.0 ROCSS 27.3 ± 25.7 27.8 ± 22.4 35.2 ± 24.1 0.65 10.25 EONSCE 24.2 ± 26.5 24.8 ± 24.1 33.3 ± 24.1 0.68 10.375 EONSE 22.9 ± 25.4 24.7 ± 21.5 32.2 ± 22.8 0.68 11.625 SHAEPSE 29.0 ± 25.5 27.2 ± 22.1 35.3 ± 23.7 0.67 9.75 SHAEPS 28.1 ± 26.6 27.2 ± 22.1 35.5 ± 23.8 0.67 8.875 USR 12.7 ± 15.6 16.2 ± 13.9 24.3 ± 17.6 0.61 15.0 ESHAPE3DHYD 24.0 ± 27.6 23.1 ± 20.8 27.8 ± 23.4 0.54 13.75 ESHAPE3D 14.1 ± 16.8 13.0 ± 9.8 18.6 ± 12.7 0.42 15.75
4D FAPOA 46.0 ± 33.1 45.4±
30.1
53.5± 31.0
0.78 1.25
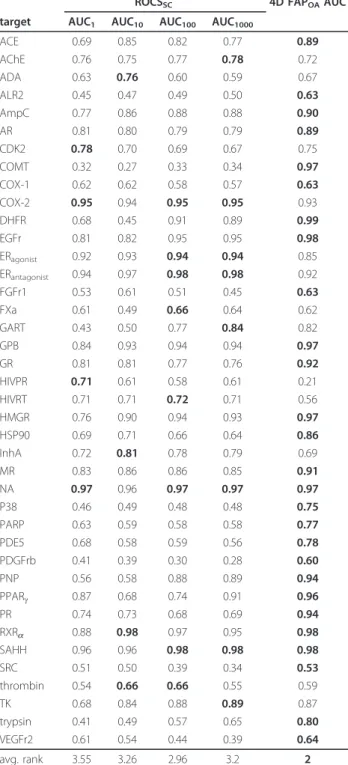
per molecule. Table 5 lists in detail the AUC perfor-mance of the ROCSSC on different ensemble sizes and
the AUC results of the 4D FAPOA. The table also
con-tains the AUC results of the ROCSSC on one given
conformation as a baseline to evaluate the performance gain of the multiple conformer setup.
The average AUC of the ROCSSCincreases from 0.692
(AUC(1)) over 0.703 (AUC(10)) to 0.725(AUC(100)). The results on 1000 conformers are marginally inferior (average AUC(1000) of 0.722) in comparison to the results on 100 conformers. As a result, the ROCSSC
slightly benefits from the additional information content of multiple conformers. However, the average AUC of the 4D FAPOAis 0.80, and, therefore superior in
com-parison to all four ROCSSC setups. These results are
verified by the average ranks of the approaches. The 4D FAPOAis able to achieve the best AUC value on 27 out
of 40 data sets and demonstrates its robust performance on a wide range of pharmaceutically relevant targets. The best ROCSSC setup (100 conformers) yields on
eight data sets the best result. Please note that the dif-ferent average AUC values in Table 3 and 5 are the result of the applied data sets (filtered DUD in Table 3 and unfiltered in Table 5).
Despite the robust and superior performance of the 4D FAPOAon the majority of the 40 data sets, the weak
performance on the HIVPR data set is conspicuous. The HIVPR data set has an average number of heavy atoms of 36.3 and represents the data set with the largest com-pounds of all 40 DUD data sets. The 4D FAPOAentails
an optimal assignment step to compute a final similarity value based on the atom-pair tree similarity matrixS. If the approach computes the similarity value between the query compound and a data set compound, thei-th row ofS represents the atom-pair tree with thei-th atom of the query compound as root node. Analogously, this applies to thej-th column ofSand the j-th atom of the data set compound. The optimal assignment step maps each atom of the query compound onto an atom of the data set compound. With an increased size of atoms the number of possibilities (possible mappings) scales with O(n!), where n is the number of heavy atoms. This increase also increments the risk of a topological error in the assignment step. Topological errors are assign-ments that do not preserve a substructure mapping (e. g., atoms of a ring are assigned to atoms of different rings). Figure 9 shows a mapping with several topologi-cal errors. These topologitopologi-cal errors maximize the final similarity value, but from a chemical point of view these mappings are questionable. Therefore, these errors can negatively influence the ranking of the compounds on the HIVPR data set.
The FieldScreen approach by Cheeseright et al. [45] represents a VS similarity function that applies four dif-ferent types of locally optimized field points and oper-ates on a multiconformer database. Therefore, it also operates on a comparable information content as our 4D FAPOA approach. Cheeseright et al. evaluated the
Table 4 Relative enrichment factors and chemotype discovery of pharmacophore-based approaches and the 4D FAPOA.
TopPPHist Flexophore 4D FAPOA
target REF1% Chem1% REF1% Chem1% REF1% Chem1%
ACE 65.01 8 75.84 8 75.84 5
AChe 57.54 4 55.04 3 57.53 4
ADA 0.0 0 0.0 0 41.41 1
ALR2 9.79 1 9.79 1 19.59 1
AmpC 74.35 1 86.74 1 99.13 1
AR 44.4 2 27.32 1 68.19 1
CDK2 23.52 4 23.52 3 41.94 4
COMT 20.88 1 20.88 1 62.63 1
COX-1 21.39 1 64.17 4 64.1 4
COX-2 69.66 9 96.79 7 99.16 13
DHFR 96.86 4 91.03 9 91.16 6
EGFr 70.56 2 73.6 12 97.14 13
ERagonist 45.66 2 41.86 5 72.05 3 ERantagonist 47.07 2 26.9 2 47.07 1
FGFr1 0.0 0 12.92 0 10.71 4
FXa 5.1 1 23.78 4 8.49 2
GART 10.99 0 10.99 0 10.88 0
GPB 72.99 3 36.5 3 96.7 3
GR 26.47 1 26.47 3 36.36 3
HIVPR 4.78 0 4.78 0 0.0 0
HIVRT 38.49 2 38.49 3 38.41 2
HMGR 66.05 1 99.08 2 99.14 2
HSP90 99.6 2 69.72 2 98.43 2
InhA 86.52 5 95.47 6 95.47 6
MR 0.0 0 0.0 0 77.04 1
NA 31.2 1 20.8 1 57.2 1
P38 0.0 0 22.27 1 20.85 1
PARP 7.22 1 14.43 2 0.0 0
PDE5 58.45 2 58.45 1 96.85 3
PNP 28.14 2 93.81 4 55.3 3
PPARg 87.28 0 96.63 0 87.45 0
PR 0.0 0 9.45 1 37.45 1
RXRa 12.99 1 77.92 1 51.95 1
SAHH 58.01 1 36.26 1 79.77 1
SRC 1.96 1 0.0 0 7.72 2
TK 32.86 1 54.76 2 43.81 1
trypsin 5.95 0 5.95 0 5.84 1
mean 37.34 1.78 43.31 2.54 55.48 2.65 avg. rank 2.35 2.30 2.04 1.93 1.61 1.80
FieldScreen approach on the filtered DUD data sets and applied the chemotype information on the result metrics. The results of the FieldScreen approach as well as the 4D FAPOA are listed in Table 6.
The 4D FAPOAyields a superior early enrichment
per-formance (awROCE5%) on 9 out of 13 data sets.
Con-cerning the performance on the complete data set (AUC) our approach outperforms FieldScreen on 8 data sets. The 4D FAPOAis able to increase the mean early
enrichment and complete data set performance by ≈ 30% and≈ 16%, respectively. The major improvements Figure 9Optimal assignment with topological errors. Example mapping with several topological errors. Figure was taken from Jahn et al. [28]
Table 6 awROCE and AUC results of FieldScreen and the 4D FAPOA
FieldScreen 4D FAPOA
data set awROCE5% AUC awROCE5% AUC
ACE 4.7 0.67 12.2 0.88
AChE 7.3 0.76 7.6 0.75
CDK2 0.8 0.47 3.5 0.77
COX2 10.4 0.92 11.9 0.89
EGFr 9.5 0.84 18.0 0.99
FXa 5.4 0.74 3.2 0.64
HIVRT 5.1 0.70 2.3 0.58
InhA 6.5 0.71 7.8 0.66
P38 0.5 0.33 3.1 0.68
PDE5 4.8 0.66 3.6 0.69
PDGFrb 3.8 0.29 4.9 0.66
SRC 2.5 0.45 2.7 0.51
VEGFr2 3.5 0.48 3.2 0.67
mean 4.98 0.62 6.5 0.72
avg. rank 1.69 1.62 1.31 1.38
The approaches were evaluated on awROCE5%and AUC results of FieldScreen [45] and the 4D FAPOA.
The approaches were evaluated on the 13 filtered DUD data sets that entail at least 15 different chemotypes in the active data set. Bold values indicate the best results with respect to the corresponding metric and data set. The last two lines contain the average performance and average rank of each approach.
Table 5 Average AUC of ROCSSCwith multiple
conformers and the 4D FAPOA
ROCSSC 4D FAPOAAUC
target AUC1 AUC10 AUC100 AUC1000
ACE 0.69 0.85 0.82 0.77 0.89
AChE 0.76 0.75 0.77 0.78 0.72
ADA 0.63 0.76 0.60 0.59 0.67
ALR2 0.45 0.47 0.49 0.50 0.63
AmpC 0.77 0.86 0.88 0.88 0.90
AR 0.81 0.80 0.79 0.79 0.89
CDK2 0.78 0.70 0.69 0.67 0.75
COMT 0.32 0.27 0.33 0.34 0.97
COX-1 0.62 0.62 0.58 0.57 0.63
COX-2 0.95 0.94 0.95 0.95 0.93
DHFR 0.68 0.45 0.91 0.89 0.99
EGFr 0.81 0.82 0.95 0.95 0.98
ERagonist 0.92 0.93 0.94 0.94 0.85 ERantagonist 0.94 0.97 0.98 0.98 0.92
FGFr1 0.53 0.61 0.51 0.45 0.63
FXa 0.61 0.49 0.66 0.64 0.62
GART 0.43 0.50 0.77 0.84 0.82
GPB 0.84 0.93 0.94 0.94 0.97
GR 0.81 0.81 0.77 0.76 0.92
HIVPR 0.71 0.61 0.58 0.61 0.21
HIVRT 0.71 0.71 0.72 0.71 0.56
HMGR 0.76 0.90 0.94 0.93 0.97
HSP90 0.69 0.71 0.66 0.64 0.86
InhA 0.72 0.81 0.78 0.79 0.69
MR 0.83 0.86 0.86 0.85 0.91
NA 0.97 0.96 0.97 0.97 0.97
P38 0.46 0.49 0.48 0.48 0.75
PARP 0.63 0.59 0.58 0.58 0.77
PDE5 0.68 0.58 0.59 0.56 0.78
PDGFrb 0.41 0.39 0.30 0.28 0.60
PNP 0.56 0.58 0.88 0.89 0.94
PPARg 0.87 0.68 0.74 0.91 0.96
PR 0.74 0.73 0.68 0.69 0.94
RXRa 0.88 0.98 0.97 0.95 0.98
SAHH 0.96 0.96 0.98 0.98 0.98
SRC 0.51 0.50 0.39 0.34 0.53
thrombin 0.54 0.66 0.66 0.55 0.59
TK 0.68 0.84 0.88 0.89 0.87
trypsin 0.41 0.49 0.57 0.65 0.80
VEGFr2 0.61 0.54 0.44 0.39 0.64
avg. rank 3.55 3.26 2.96 3.2 2
of FieldScreen in comparison to the 4D FAPOAare on
the FXa and HIVRT data sets. These data sets also con-sist of larger molecules, and, therefore the risk of topo-logical errors is increased and is probably a reason for the inferior 4D FAPOA performance.
To conclude, the best 3D-based approach of Table 3 (ROCSSC) could increase the performance if it is applied
on multiple conformer data sets. However, the perfor-mance gain was not strong enough to reach the results of the 4D FAPOA. The comparison with the FieldScreen
approach yields similar results and underpinned the robust performance of the 4D FAPOA. The detailed
eva-luation of the results reveals a weakness of our approach if the compounds of a data set have an increased num-ber of heavy atoms. This weakness is likely the result of the optimal assignment step and was already reported as a weak point of optimal assignment approaches [28]. Nevertheless, the 4D FAPOA represents a robust
similar-ity measure for small and medium sized drug-like compounds.
Conclusions
We presented a VS similarity function that operates on GMM encoded conformational space information. Our approach is able to compare the conformational space of molecules within one step, and, therefore avoids the application of time-consuming averaging techniques. The approach was already applied in QSAR experiments and demonstrated its robust performance in comparison to similar 3D-based QSAR models [23,28].
The aim of this study was to evaluate our approach as VS similarity function. Therefore, we compared the results of the 4D FAPOA with 20 other 2D- and
3D-based approaches. Additionally, we applied two approaches (ROCSSC and FieldScreen) that operate on
multiple conformers to provide a comparison of approaches that are based on a similar information content.
The results showed that our approach is able to achieve superior results on a wide range of pharmaceuti-cally relevant targets. Even the best 3D approach, with respect to the results of Venkatraman et al. [21], applied on multiple conformers is inferior in comparison to our approach.
The preprocessing, which is necessary to encode the conformational space information by means of GMMs, represents an additional computational step. However, all compounds have only be computed once and the encoded models need less space in comparison to the storage of conformational ensembles. The computational speed of the actual similarity function is fast enough to screen over 100,000 compounds within one hour on a standard desktop CPU with one core. Therefore, our
approach should meet the requirements of real-world VS applications.
The complete source code of the preprocessing tool (computing GMMs based on conformational ensembles) as well as the 4D FAPOA similarity function are publicly
available on our department website http://www.cogsys. cs.uni-tuebingen.de/software/4DFAP.
Additional material
Additional file 1:Archive of the 4D FAPOAresult files. This is a Gzip compressed Tar archive containing the result files of the 4D FAPOAon the filtered DUD data sets. The result files are tab-separated plain text files including the following information: method name, active data set with size, cluster information and the distribution of the active molecules over the clusters, decoy data set with size, ratio active:decoy, AUC, awAUC, BEDROC scores for predefined alpha values as suggested by Truchon and Bayly [43], enrichment factors, relative enrichment factor [41], ROC enrichments, awROC enrichments at predefined false positive fractions, chemotype enrichment, ROC and awROC data points, and the ranking of each structure to compute other VS metrics.
List of abbreviations
ACE: angiotensin-converting enzyme; AChE: acetylcholinesterase; ADA: adenosine deaminase; ALR2: aldose reductase; AmpC: AmpCβ-lactamase; AR: androgen receptor; CDK2: cyclin-dependent kinase 2; COMT: catechol O-methyltransferase; COX-1: cyclooxygenase-1; COX-2: cyclooxygenase-2; DHFR: dihydrofolate reductase; EGFr: epidermal growth factor receptor; ER: estrogen receptor; FGFr1: fibroplast growth factor receptor kinase; FXa: factor Xa; GART: glycinamide ribonucleotide transformylase; GPB: glycogen phosphorylaseβ; GR: glucocorticoid receptor; HIVPR: HIV protease; HIVRT: HIV reverse transcriptase; HMGR: hydroxymethylglutaryl-CoA reductase; HSP90: human heat shock protein 90; InhA: enoyl ACP reductase; MR: mineralo-corticoid receptor; NA: neuraminidase; P38: P38 mitogen activated protein; PARP: poly(ADP-ribose) polymerase; PDE5: phosphodiesterase 5; PDGFrb: platelet derived growth factor receptor kinase; PNP: purine nucleoside phosphorylase; PPARγ: peroxisome proliferator activated receptorγ; PR: progesterone receptor; RXRαretinoic X receptorα; SAHH: S-adenosyl-homocysteine hydrolase; SRC: tyrosine kinase SRC; TK: thymidine kinase; VEGFr2: vascular endothelial growth factor receptor.
Authors’contributions
AJ designed and developed the main part of the 4D FAPOA, has written the manuscript, participated in the design of the experiments and the discussion of the results. LR participated in the design of the experiments and the discussion of the results. GH contributed to the development of the 4D FAPOA, participated in the design of the experiments and the discussion. AZ participated in the design of the 4DFAPOA, the design of the experiments, and the discussion of the results.
Competing interests
The authors declare that they have no competing interests.
Received: 29 April 2011 Accepted: 6 July 2011 Published: 6 July 2011
References
1. von Korff M, Freyss J, Sander T:Flexophore, a New Versatile 3D Pharmacophore Descriptor That Considers Molecular Flexibility.J Chem
Inf Model2008,48(4):797-810.
2. Bajorath J:Integration of virtual and high-throughput screening.Nat Rev
Drug Discov2002,1(11):882-894.
3. Varnek A, Tropsha A, (Eds):Chemoinformatics Approaches to Virtual Screening Cambridge: The Royal Society of Chemistry; 2008.