California’s Energy Future:
Electricity from Renewable
Energy and Fossil Fuels
with Carbon Capture and
Sequestration
April 2012
or the State of California. The CEC, the State of California, its employees, contractors, and subcontractors make no warranty, express or implied, and assume no legal liability for the information in this report; nor does any party represent that the use of this information will not infringe upon privately owned rights.
ACKNOWLEDGEMENTS
We would also like to thank the Stephen Bechtel Fund and the California Energy Commision for their contributions to the underwriting of this project. We would also like to thank the California Air Resources Board for their continued support and Lawrence Livermore National Laboratory for underwriting the leadership of this effort.
COPYRIGHT
Copyright 2011 by the California Council on Science and Technology. Library of Congress Cataloging Number in Publications Data Main Entry Under Title:
California’s Energy Future:
Electricity from Renewable Energy and Fossil Fuels with Carbon Capture and Sequestration April 2012
ISBN-13: 978-1-930117-52-5
Note: The California Council on Science and Technology (CCST) has made every reasonable effort to assure the accuracy of the information in this publication. However, the contents of this publication are subject to changes, omissions, and errors, and CCST does not accept responsibility for any inaccuracies that may occur. CCST is a non-profit organization established in 1988 at the request of the California State Government and sponsored by the major public and private postsecondary institutions of California and affiliate federal laboratories in conjunction with leading private-sector firms. CCST’s mission is to improve science and technology policy and application in California by proposing programs, conducting analyses, and recommending public policies and initiatives that will maintain California’s technological leadership and a vigorous economy.
For questions or comments on this publication contact:
California Council on Science and Technology 1130 K. Street, Suite 280
Sacramento, California 95814 (916) 492-0996
Table of Contents
Overview: Electricity Supply Cases ... 1
Fossil/CCS Electricity ... 3 Renewable Electricity ... 11 Load Balancing ... 21 Conclusion ... 35 Appendix A: References ... 37 Appendix B: Acronyms ... 41
Appendix C: California’s Energy Future Full Committee ... 43
Message From CCST
CCST is pleased to present the results of an analysis of the future of renewable electricity and fossil fuel electricity with carbon capture and sequestration (CCS) in California. This study is part of the California’s Energy Future (CEF) project, which was undertaken to help inform California state and local governments of the scale and timing of decisions that must be made in order to achieve the state’s goals of significantly reducing total greenhouse gas emissions over the next four decades. California’s Global Warming Solutions Act of 2006 (AB32) and Executive Order S-3-05 set strict standards for the state to meet. In order to comply, California needs to reduce its greenhouse gas emissions to 80% below 1990 levels by 2050 while accommodating projected growth in its economy and population. This will likely require a doubling of electricity production with nearly zero emissions. Renewable energy and CCS could be important components of a strategy for meeting these standards. This report is a summary of the realistic potential of these technologies for California and presents an analysis of technological readiness, resources, issues of intermittency, and emissions. We believe that the CEF renewable and CCS electricity report presents valuable insights into the possibilities and realities of meeting California’s electricity needs and emissions standards over the decades to come, and hope that you will find it useful.
Jane C.S. Long
California’s Energy Future Committee Co-chair
Miriam John
California’s Energy Future Committee Co-chair
I. Overview: Electricity Supply Cases
California’s Energy Future (CEF) was a two-year study sponsored by the California Council on Science and Technology to identify pathways for achieving California’s aggressive greenhouse gas (GHG) reduction target of 80% below the 1990 level in 2050. A summary report was published in May 2011 (CCST, 2011). The analysis first estimated how emissions could be reduced through modifications to demand, including aggressive efficiency and electrification. [Details of the efficiency and electrification calculations are presented in the separate CEF reports on building and industrial efficiency (Greenblatt et al., 2012) and transportation (Yang et al., 2011)]. Second, the analysis looked at various supply technologies for electricity and fuel and how these could be provided without emissions. This report examines electricity generation through fossil fuel combustion with CO2 capture and sequestration (“fossil/CCS”), or renewable energy technologies (wind, solar, geothermal, biomass, hydro, etc.). A separate CEF report describes a nuclear power option; see Richter et al. (2011). Youngs et al. (in preparation) examines meeting the fuel demand with biofuels. A final report synthesizes the results of the other reports, and explores the remaining challenges—and possible solutions—to achieving California’s ambitious GHG target (Greenblatt and Long, 2012). Two different demand scenarios were used to examine technological readiness to provide low-carbon electricity in 2050. First, a maximum electricity demand that would result from business-as-usual plus economic and population growth without aggressive efficiency measures, but very high levels of electrification, was developed.1 We refer to this case as the “stress test.” For the
stress test, the total demand for electricity would be ~1,200 TWh/yr (average generation of ~130 GW). Secondly, we used a much smaller estimate of demand (“Case E”) that included aggressive, but realistic, amounts of both efficiency improvement and electrification in all energy sectors. The resulting demand for electricity is ~500 TWh/yr (average generation of ~60 GW). By comparison, California’s electricity demand in 2005 was ~270 TWh/yr.
We assessed a variety of ways to provide electricity for these two levels of demand. Electricity generation cases all assumed that California meets its 33% renewable target by 2020, as stipulated by recent legislation (Brown, 2011), and maintains it thereafter. (Note that in the CEF scenarios, we assumed that the rest of the U.S. would develop low-carbon policies similar to those in California and that this would place limits on the availability of imported resources such as renewable or CCS projects from outside California.) We looked at three major ways to provide the rest of the electricity: nuclear power, fossil/CCS, and more renewable energy. We found the following:
• Developing generation capacity is not a technical issue. Generation capacity to meet either the high or low level of demand could be developed with any of the three electricity supply choices.
• All of the electricity cases require load balancing to address peaking, ramping and intermittency of electricity supply resulting from the inherent variability of wind and solar resources. The use of natural gas for load balancing at the scales envisioned to be necessary in 2050 would produce significant amounts of GHG emissions (Greenblatt and Long, 2012). This problem is significantly larger for intermittent renewable energy. 1 While not meant to be a projection of likely future demand, the stress test case was developed to determine the maximum
foreseeable level of electricity demand that generation technologies might have to meet. To come up with this maximum, one assumed the same efficiency levels as in the business-as-usual case, but a virtual total replacement of fuel combustion with electricity wherever technically feasible—e.g., 100% electrification of building and industrial heat, and most forms of transport (light-duty vehicles, buses, and rail); however, most heavy-duty transport trucks, and all airplanes and ships would remain fuel-based. One conceivably plausible explanation for such a future might be if fuel prices rose dramatically in the near future, and stayed high through 2050, but there was no imperative to reduce electricity consumption.
• Electricity generation with fossil/CCS will not be emission-free because CO2 capture efficiency is not expected to exceed 90%.
The remainder of this report discusses generating electricity with fossil/CCS, generating electricity with large amounts of renewable energy, and finally, a technology assessment of load balancing.
II. Fossil/CCS Electricity
Stress TestIn the absence of significant technology breakthroughs, neither coal nor natural gas combustion with CCS can provide 100% of the projected 2050 stress test electricity demand while staying within future GHG emissions limits, because 100% capture efficiency is not possible today, and will likely exist only with severe energy penalties. (For a discussion on the challenges of developing >90% efficient capture technology, see Greenblatt and Long, 2012).
Therefore, we assumed 90% capture efficiency for CCS applied to either coal or natural gas plants, and sufficient flexible load and/or electricity storage technology to manage grid fluctuations without natural gas turbines. The GHG intensity is estimated to be 80 kgCO2/MWh for coal and 36 kgCO2/ MWh for natural gas. To supply the State’s entire stress test electricity demand of 1,200 TWh/yr, the resulting (uncaptured) emissions would be 96 MtCO2/yr for coal and 43 MtCO2/yr for natural gas;
for comparison, California’s electricity system emitted 100 MtCO2/yr in 2008 (CARB, 2010). Using exclusively natural gas, or a combination of natural gas and coal, could in theory fit within the State’s 2050 GHG emissions limits of 77 MtCO2e/yr;2 however it would leave very little GHG budget for
the rest of the State’s economy to utilize. Consequently, it would not be possible to solve the State’s energy emissions problems by producing all of the electricity with fossil/CCS.
Moreover, if we produced 1,200 TWh/yr of electricity from fossil fuel, we would have to find a place to store the ~900 MtCO2/yr (from coal) or ~400 MtCO2/yr (from natural gas) of captured CO2. CEC (2007) estimates that California oil and gas fields have a total CO2 sequestration potential capacity of about 5,200 MtCO2. Abandoned oil and gas reservoirs are usually well-characterized because they were of economic interest and are known to have good containment properties (otherwise the oil or gas would have escaped). This means that, at the above rates, abandoned oil and gas reservoirs would only provide 6 to 13 years of in-state storage capacity.
Saline aquifers represent a much larger capacity, between 150,000 and 500,000 MtCO2 (CEC, 2007). While there is ample capacity in saline aquifers to absorb even the stress test levels of CO2 production for more than a century, these potential reservoirs have not been of economic interest thus far, and are less well characterized. Significant new infrastructure would also be required, either transmission lines to move power from near the storage reservoir to consumers, or a significant new pipeline network to take CO2 from the point of generation to the storage reservoir.
2 Million metric tons CO2 equivalent per year (includes emissions of other GHGs such as CH4, N2O and hydrofluorocarbons). Note that this target is for the energy sector only, which emitted 386 MtCO2e in 1990; an 80% reduction is therefore 77 MtCO2e. Total statewide emissions (including land-use change and non-energy GHGs) totaled 427 MtCO2e in 1990 (CARB, 2007).
Realistic Fossil/CCS Electricity Case Summary
CCS approaches for both coal and natural gas power plants are currently in demonstration, but not presently commercially available at scale. Coal with CCS produces approximately twice the CO2 emissions per MWh as natural gas with CCS, but coal technology is currently cheaper due to lower per Btu fuel costs.3 The main challenges are the cost of capture, and access to adequate
CO2 storage capacity. As shown in the CCS stress test, abandoned oil and gas reservoirs provide
previously-characterized sites that have demonstrated containment properties, and, assuming that CCS plants are introduced in the next decade (see Table 2), would provide sufficient storage capacity to absorb CO2 emissions through 2050 with a comfortable margin, but not much capacity beyond that. The potential for storage in saline aquifers is much larger, but these will require more work to characterize and certify. Other challenges include massive new infrastructure of electrical transmission and/or concentrated CO2 transport. A system that is dependent on natural gas would
also introduce associated challenges in the reliability of supply that have been a hallmark of this fuel over time, specifically the reliability and environmental acceptability of unconventional gas production, acceptability and security issues related to liquefied natural gas (LNG), and historical price volatility.
Technical Assumptions
CCS represents technology that is still in a developmental stage, though demonstration plants do exist for both the capture and sequestration of CO2. Current and assumed future performance characteristics of fossil/CCS systems are shown in Table 1. The most important metric, capture efficiency, is close to 90% today, but cannot exceed this value without significant energy penalties, in the absence of breakthrough technology (for more information, see Greenblatt and Long, 2012). Therefore, in the estimates discussed below, 90% capture efficiency is assumed, with higher generation efficiency and lower cost than today.
3 However, recent declines in natural gas prices have narrowed the gap between coal and natural gas. While recent coal plant closures are widely blamed on new EPA pollution regulations (e.g., Koenig, 2011), some claim that low natural gas prices are
Fossil / CCS Electricity
Natural Gas Combined
Cycle (NGCC) Pulverized Coal (PC) Combined Cycle (IGCC) Integrated Gasification Coal
CO2 vented CCS CO2 vented CCS CO2 vented CCS
Current state of the art (2010)
Heat Rate (Btu/MWh) 7,706 9,066 8,995 12,428 8,614 11,351 Combustion Efficiency 44.3% 37.6% 37.9% 27.5% 39.6% 30.1% CO2 Emissions (kg/MWh) 385 45 867 121 825 109 Capture Efficiency 88% 86% 87% CEF 2050 CO2 Emissions
(kg/MWh) 360 36 Not used Not used 800 80
Capture
Efficiency 90% n/a 90%
Table 1. CCS parameter assumptions.
Source: EPRI (2009a)
Two bounding cases are examined below: one based entirely on coal combustion; the other on natural gas combustion. Natural gas has lower inherent carbon content per unit energy, making both storage requirements and residual emissions lower than coal by more than 50%. The relative economics of the fuels plus the costs of carbon capture from each will largely determine the future mix of technologies deployed.
Carbon Capture at Coal Plants
We assume that coal plants operate at high efficiency [ultra-supercritical Pulverized Coal (PC) or Integrated Gasification Combined Cycle (IGCC) coal, with 800 kg CO2 per MWh] with an 80% capacity factor that includes a 10% penalty for the parasitic load required to operate the CO2 capture equipment. Total gross generating capacity is therefore 54 GW in 2050. By comparison, California consumed approximately 58 TWh of coal electricity in 2005 (without CCS)—roughly 16% of the 2050 target level (CEC, 2006).
Supply and demand are balanced by one or more of the strategies discussed in the section on load balancing below. A 90% capture efficiency is assumed, resulting in residual emissions of 28 MtCO2/ yr in 2050. The annual storage requirement is 248 MtCO2/yr in 2050. Depending on the details of
the build-out scenario, cumulative storage capacity through 2050 is approximately 2,600 MtCO2. See Table 2 below for more information.
Parameter Units Fuel 2015 2020 2030 2040 2050
Gross generation capacity GW
Coal or Natural Gas
0.6 1.2 5.8 22 54
Parasitic loss from CCS % 25% 20% 15% 10% 10%
Net generation capacity GW 0.5 1.0 5.0 20 49
Fraction of electricity
demand met % 1.1% 2.1% 9.1% 31% 67%
Emissions rate MtCO
2/yr Coal 0.3 0.6 2.8 11.2 27.5
Natural Gas 0.1 0.3 1.3 5.0 12.4
Storage rate MtCO
2/yr Coal 2.5 5.0 25 101 248
Natural Gas 1.1 2.3 11.4 45.4 111
Cumulative stored CO2* MtCO2 Coal 6.3 25 177 807 2,550
Natural Gas 2.8 11 80 363 1,147
Table 2. Build-out scenarios for fossil/CCS.
*Assuming piecewise annual linear growth in CO2 storage requirement as shown.
For a coal/CCS-dominant electricity solution, a massive new infrastructure would be required, along with high associated transportation costs, regardless of the strategy pursued:
• Importing “coal by wire” with CCS out-of-state would require a large transmission investment: e.g., the “Frontier Line” proposal to bring Wyoming wind plus coal (with local CCS) into California (WPSC, 2005).
• Storing CO2 in-state would require siting new generators near CO2 storage (abandoned
oil and gas reservoirs and saline aquifers in the Central Valley) and transmitting power to the load, or siting power plants near the load and using pipelines to move the CO2 to storage sites. Either choice requires infrastructure investment.
Without saline aquifers, in-state storage capacity is limited to about 5,200 MtCO2. While sufficient through 2050, the capacity will run out by approximately 2060 using coal, or 2085 using natural gas, assuming the storage rates are fixed at 2050 values; with continued expansion of demand, these deadlines would be sooner. Therefore, if fossil/CCS is to become a post-2050 strategy in California, saline aquifers (or export to regional sequestration sites) must be developed to provide the required capacity. Moreover, there is non-zero technical and regulatory risk associated with saline aquifers that will need to be overcome, through more detailed characterization to eliminate those aquifer settings that do not meet the requirement for very low rates of leakage to shallower formations. Carbon Capture at Natural Gas Plants
We assume natural gas plants would operate at high efficiency (advanced natural gas combined cycle approaches 360 kgCO2/MWh) with 80% capacity factor. We include a 10% penalty for the
Fossil / CCS Electricity
parasitic load as we did for coal, resulting in 54 GW gross capacity in 2050. Supply and demand are balanced by one or more of the strategies discussed in the load balancing section. A 90% capture efficiency is assumed, resulting in residual emissions of 12 MtCO2/yr. The annual storage requirement is 111 MtCO2/yr in 2050. Depending on the build-rate assumptions (see Table 2), the cumulative storage capacity through 2050 is approximately 1,200 MtCO2. The 2050 generation requirement would be about three times California’s current natural gas generation output (109 TWh in 2005) (CEC, 2006).
The same infrastructure challenges outlined above for coal would be encountered for natural gas. However, for CO2 storage capacity, there would be about 40 years’ worth of additional capacity available in abandoned oil and gas reservoirs (though with continued expansion, the time available would be less). Saline aquifers will still be necessary for a sustainable long-term strategy.
Other challenges include reluctance by utilities to invest in natural gas capacity, because volatility in natural gas prices has hurt utilities in the past. While the cost and time for building a natural gas plant is much lower than that of a similarly-sized coal plant, and while there is currently significant spare natural gas capacity nationwide in simple cycle (though not combined cycle) gas turbines, there is concern about whether utilities can compete with coal and/or pass along to customers the natural gas fuel costs, should they rise in the future. Coal prices, on the other hand, have remained low over time and would be expected to remain low in a carbon-constrained future.
Another important consideration is that the North American market for gas is presently largely separate from the rest of the world. More than 90% of the gas used in the U.S. is supplied domestically. In recent years, the price of natural gas in Europe and in Asia has been about twice the U.S. price, so very little liquefied natural gas (LNG) has made it to the U.S., and there is significant excess LNG import capacity as a result. Furthermore, with significant new unconventional production of natural gas from shales, U.S. prices may remain low. There is significant new LNG production coming online around the world, and the U.S. may join in exporting its natural gas to the rest of the world. How this will affect the U.S. market depends on how the relative prices of natural gas evolve, and whether or not a global market emerges for LNG similar to that which exists today for crude oil and refined fuels.
In summary, an electricity system largely served by natural gas with CCS is possible, but uncertainties in the long-term cost of production, institutional reluctance to invest in natural gas, competition from LNG imports, and (like with coal) concern over potential environmental impacts and the necessity of massive CO2 storage infrastructure, make this option a complex one to evaluate.
Technological Maturity
Fossil/CCS technologies were divided into four technological maturity “bins,” shown in Table 3
below. The same binning rationale was used throughout the CEF analysis.
Technological
maturity bin Bin description Coal or natural gas with COcapture 2 sequestrationCO2
1 Deployed and available at
scale now High-efficiency coal gasification, high-efficiency natural gas combined cycle, ultra-supercritical pulverized coal combustion, solid-oxide fuel cell (SOFC), solvent separation
Injection into oil/gas reservoirs
2 Demonstrated, but not available at scale or not economical
Post-combustion CO2 capture technologies with 80% capture efficiency, integrated gasification systems with CCS, amine solvent separation
Saline aquifer injection
3 In development, not yet
available New capture methods with >90% effectiveness, lower cost CO2 capture technologies of all kinds, metal-organic framework separations, membrane separation
Coal bed injection
4 Research concepts None Shale
injection Table 3. Technological maturity of fossil/CCS technologies.
Costs
The addition of 90% CO2 capture technology to fossil thermal power plants increases capital costs and reduces net MW output, resulting in an increase in the levelized cost of electricity (LCOE). Estimates of the increases in LCOE when CCS is added (E3, 2009; Williams et al., 2011a) are as follows:
• Pulverized coal with post-combustion CO2 capture: 50-60% increase
• Integrated gasification combined cycle (IGCC) coal with CO2 capture: 25-30% increase (but from a higher base cost today)
• Natural gas combined cycle (NGCC) with CO2 capture: 40% increase (at $6.75/mmBtu
natural gas price)
The actual LCOE is highly dependent on assumed fuel costs, which are especially uncertain for natural gas (see discussion above). Higher levels of CO2 capture would result in reduced plant efficiency and further increased costs. As noted previously, we assume 90% capture in all cases. The above LCOE estimates are broadly consistent with those of EPRI and NREL (E3, 2009).
Fossil / CCS Electricity
The above prices include only the cost of CO2 capture. The marginal cost of CO2 transport and storage in California is approximately $20-40/MWh for storage rates of less than 70 MtCO2/yr; this is primarily enhanced oil or gas recovery opportunities within 100 km of the CO2 source. Costs increase with distance to storage site, with pipelines costing $500,000 per mile. Costs of developing the much larger capacity of saline aquifers are unknown, as the technology is still under development (bin 3).
Reliability
Gas turbines (either for natural gas or IGCC coal) are very reliable power generators. A CO2 pipeline network and/or a larger transmission network adds system complexity and potential failure points. Natural gas imports are less desirable from a geopolitical perspective, but unconventional gas reserves are controversial, as discussed earlier.
Resource Constraints
The main resource challenge is adequate CO2 storage capacity. Abandoned oil and gas reservoirs
provide previously-characterized sites that have demonstrated containment properties. However, these do not have sufficient storage capacity to absorb the CO2 emissions much past 2050. The potential for storage in saline aquifers is adequate for several centuries’ worth of emissions (at the 2050 rate), but these will require more work to characterize and certify than storage in abandoned oil and gas reservoirs.
Water resources for cooling are significant but are not deemed critical constraints on expansion of fossil/CCS generation, mainly because air cooling is an available option if water resources become scarce. However, switching to air cooling would raise costs and reduce plant efficiency.
Natural gas also presents some additional challenges not encountered with coal. There is a very big domestic resource in shale reservoirs, but uncertainty exists concerning what fraction can be recovered, at what rates, and at what price. While some have questioned whether the estimates of the resource have overplayed the gas content of the “sweet” spots, and not all the widely distributed shales have been drilled enough to delineate the resource very accurately, it appears that there is a domestic resource large enough to make a difference in CO2 emissions if gas is substituted for coal in power generation.
The permeability of shale is very low, so the combination of long-reach horizontal drilling and sequential fracturing along the wells is essential for producing the gas. Technology improvements in these areas have made the gas production possible. However, typical wells start big and decline fast, requiring many wells to be drilled on an ongoing basis to maintain production rates. Producers have delivered a significant increase in shale gas production in the last few years; however, current gas prices are low (due to the economic downturn), below what is probably required to produce at large scale, and that has reduced drilling rates.
Environmental Concerns
Coal-based power generation results in emissions of air pollutants (such as oxides of sulfur and nitrogen), air toxics (such as mercury), and particulate matter, all of which have been shown to have significant negative impacts on human health and ecosystems. In addition, combustion of coal results in residuals (coal ash) and wastewater effluent, and thermal cooling of these power plants requires significant amounts of fresh water with present technologies. These key issues for fossil power plant owners and operators will be exacerbated by the adoption of CCS, which can reduce
plant efficiency and increase per-kWh emissions of air pollutants, water use, and other impacts. Advances in environmental control technologies that mitigate these impacts will also be necessary. For natural gas plants, air pollution as a result of combustion is a smaller but still significant issue, particularly in the production of nitrogen oxides. Also, there has been opposition to natural gas drilling in some quarters based on surface impacts of large volumes of drilling, water requirements, issues of disposal of drilling fluids, potential contamination of near-surface water supplies, and small earthquakes associated with hydraulic fracturing (“fracking”) used to improve well productivity. How much this potential opposition will affect the ability of producers to deliver gas in large quantities for a long period is not known. A recent study by the National Petroleum Council (NPC, 2011) explores these natural gas issues in further detail.
There may also be an issue with release of natural contaminants (e.g., benzene) into surface water supplies (Duncan, 2011). However, technologies are available for well construction, testing of whether required isolation of near-surface formations has been achieved, and recycling or processing of flow-back water that should be sufficient to control these environmental impacts, if technologies are applied with care (Orr, 2012).
Potential Synergies
Developing CCS capacity for fossil fuel electricity generation would also enable CCS technology to be used for other purposes, in particular, biomass for fuel production. This may be an important element for developing low or net-negative GHG solutions based on biomass. (See Greenblatt and Long (2012) for further discussion.)
Discussion
Fossil/CCS represents a very important electricity generation technology, because of the reliability of dispatchable generation and plentiful fossil fuel supplies. It is the only other currently scalable technology besides nuclear energy that can easily provide many tens of GW of baseload capacity in a future electric grid that would otherwise become increasingly dominated by variable wind and solar generation (see renewable electricity section below).
However, there are still GHG emissions associated with fossil/CCS electricity; while small, they will contribute noticeably to a stringent statewide cap. Moreover, the environmental externalities of both fuel production and combustion are not negligible and will need to be addressed.
Perhaps most importantly, CCS is not yet “off the shelf” technology that can be deployed at commercial scale. Improvements in capture efficiency and cost, along with demonstration of full-scale CO2 storage and management, must take place rapidly in order to allow this promising technology to become a readily-available option within the next few years. Ultimately, characterization, risk assessment and demonstrated long-term management of saline aquifers will be necessary to assure a long-term future to CCS.
III. Renewable Electricity
Stress TestTo construct this stress test, California renewable energy resource estimates, capacity factors, etc. were taken from CEC (2009) and, for biomass, from Youngs et al. (in preparation). An expert committee developed a representative mix of generation resources as follows: • Available renewable baseload resources (hydro and geothermal) were first utilized to almost their full extent (estimated at about 25 GW each; see Table 4), meeting 20% of total energy demand.
• Only 50% of the in-State biomass resource (16 GW) was assumed to be available for power (the remainder being reserved for fuels and chemicals), yielding another 5% of total energy demand.
• The remaining generation share was assumed to be split roughly evenly between wind and solar, with a little more for wind (40%) than solar (35%):
○ Onshore wind was assumed to have a 3:1 ratio over offshore wind due in part to resource availability and expected added costs of offshore wind.
○ Solar was assumed split roughly evenly between concentrating solar power (17%) and solar photovoltaic (PV) installations, which were further assumed to be split evenly between distributed PV and central station PV (9% each). A summary of the stress test renewable case is shown below in Table 4. Renewables can provide 100% of stress test electricity demand, but this would require:
• Public acceptance of resulting land use impacts. The renewable supply mix shown in Table 4 would require 3.6% of California land area, more than 15,000 km2. Distributed
PV would cover roughly 40% each of residential and commercial roofs.
• Grid flexibility and load balancing resources equal to approximately 20% of total generation to balance out the variability resulting from a high penetration (75%) of wind and solar (see load balancing section below for details).
• Significant new transmission infrastructure to move power to the loads.
• Improved conversion technology performance (e.g., higher capacity factors for wind turbines and solar PV in more marginal resource areas).
• Water resources for thermal cooling (for CSP, biomass and geothermal), or new technologies for air cooling, which absent breakthroughs will reduce plant efficiency and further increase supply requirements (and raise costs).
• Environmental controls to address particulate matter and other air pollutants (for biomass and geothermal), or to mitigate impacts to species and habitat (for wind, solar and hydro).
Resource Share of Total Generation Energy Generation in 2050 Capacity
Factora Generation Capacity in 2050 Resource Upper Limita Resource Fraction Consumed Displaced landb TWh/yr GW GW km2 Wind - onshore 30% 348 40% 99 150 66% (25,100)500 Wind - offshore 10% 116 40% 33 293 11% (8,400)170 Solar CSP 17% 197 27% 83 1061 7.9% 3,000 Solar PV - Central 9% 105 27% 44 ~17,000 0.3% 3,900 Solar PV - Distributed 9% 105 27% 44 78 57% (3,900)0 Biomass 5% 58 85% 7.8 16.2 48% (23,000)4,700 Hydro 5% 58 30% 22 24 92% (3,100)1,900 Geothermal 15% 174 90% 22 25 88% 1,300 Total 100% 1,161 356 (72,100)15,400
Table 4. Renewable electricity resource assessment for the 2050 stress test.
a All estimates from CEC (2009) with the exception of the biomass resource, which was calculated from 121
mdt/yr (Youngs et al., in preparation) and 40% conversion efficiency to electricity (1000 dt/GWh). Note that the CEC estimates for onshore and offshore wind capacity factors are identical, as they are for solar CSP and PV.
b Directly displaced land areas shown, with total affected land areas in parentheses. The physical space occupied
by wind turbine foundations, roads, and electrical equipment is modest, estimated at approximately 2% of the total area required. Distributed PV is assumed to occupy existing roof areas, thus no directly displaced land. Most (80%) of the biomass is assumed to come from marginal agricultural land, agricultural and forest residues, and municipal waste streams, and hence that fraction is not included in the displaced land total; for the remaining 20%, we assumed 10 dt/acre yield (DOE, 2011). For hydro, capacity in 2009 was 10 GW, so only new capacity is included in the direct land displacement estimate.
In conclusion, while technically feasible, it would be extremely difficult to solve California’s emission challenge solely by building renewable energy generation to meet the stress test level of demand (~1200 TWh/yr, roughly four times today’s level). Providing all our electricity this way would require using large amount of our land resources, most of our non-solar renewable resources, and introduce a significant challenge in load balancing and reliability.
Renewable Electricity
Realistic Renewable Electricity Case Summary
The renewable resources in California are sufficient to supply all of our realistic electricity capacity needs in 2050 (~500 TWh/yr). The renewable technologies are all at the commercial or demonstration stage (bin 1 or 2). Unlike in the stress test, direct impacts on land are about 1.0% of total California area, or about 4,000 km2; see Table 5. Water consumption for cooling of thermal generation (CSP,
geothermal and biomass) is considered insignificant, and air cooling, while more expensive, is available if water is unavailable or too costly. However, cost improvements relative to today are required to make this solution viable.
The most important technology advance required is load balancing. While all low-carbon electricity generation technologies require such capability, no other solution is as dependent on it as renewables, due to the large swings in output anticipated in a system dominated by intermittent wind and solar power. Solutions that provide adequate flexibility are discussed below in Section IV on load balancing.
Technical Assumptions
Because there are so many different types of renewable sources, there were many ways to provide the projected total demand. We examined how much of the estimated resource upper limit might be deployed, impacts on land area, and temporal patterns of intermittency.
Onshore wind is fairly unpredictable day-to-day but tends to be stronger at night, whereas offshore wind tends to be more consistent, though still quite variable. By contrast, solar resources obviously peak during daytime and are more consistent than wind, but still exhibit short-term variability due to cloudiness. Concentrating solar power (CSP, also called “solar thermal”), requiring nearly cloudless conditions to perform well, exhibits much more consistent daily output; moreover, its output can be shaped somewhat through the use of integrated thermal energy storage, and in some cases, output can be completely decoupled from energy extraction (Papay, 2012). Both types of solar generation exhibit strong seasonal variability, however. Hydro is more controllable, but also exhibits pronounced seasonal and interannual variability,4 and is constrained by reservoir size, flood control
requirements, and downstream flow requirements. Hydro, biomass and geothermal are essentially dispatchable on demand like conventional thermal generation plants, and therefore tend to be operated in a baseload configuration. However, hydro also has the potential to become an important load-balancing resource.
While many combinations of resources could deliver the required annual energy demand, we chose one combination as an example. All resources were limited to exploit less than 50% of the esti-mated total resource, and the various types of intermittent renewables [onshore and offshore wind, and solar CSP and photovoltaics (PV)], whose resource bases were large, were each limited to meet less than 30% of total demand. Solar PV was assumed evenly split between centralized plants and distributed generation (10% of total generation each), as both appear to be viable development pathways.
4 Of particular concern for hydro resources is the potential impact of future climate change. In Northern California especially, there are the possibilities of less snow (so less water storage in the snowpack), more rain, or more runoff earlier in the year (where the reservoirs are insufficient to hold all the water). Traditionally, utilities such as the Sacramento Municipal Utility District (SMUD) try to keep reservoirs full, in order to have sufficient hydro capacity to meet peak loads in the summer (Schori, 2012).
In our analysis, biomass is mostly important as a way to provide decarbonized fuel, but consideration of local economic trade-offs and historical precedents suggested that some biomass would be used for power production. Therefore, a small fraction (5% of annual energy production or 3.4 GW— about four times the 2009 capacity) of biomass power was assumed. Note that assumptions about the alternative uses of available biomass for fuel or electricity are examined more closely in Greenblatt and Long (2012).
Table 5 summarizes this example configuration of renewables for 2050. Depending on how load balancing is achieved, the actual renewable capacity may be somewhat different from what is shown. This is because, in the case where load balancing is accomplished with energy storage, extra generation will be required to make up for storage losses, whereas in the case where natural gas is used for load balancing, less renewable capacity will be required. See the section below on load balancing for a more in-depth discussion.
Capacity factors and the resource upper limit and land area estimates were obtained from CEC (2009) and Youngs et al. (in preparation). About 1.0% of California land area would be directly displaced by new renewable generation, with the majority coming from solar plants, along with smaller amounts from wind and geothermal plants. (Note that hydro capacity was assumed to be identical to what exists today, so no new land displacements were required in the projection.)
Indirect land displacements bring the total impacted land area to 7.6%, arising chiefly from wind (3.5%), biomass (2.4%), solar (1.3%), and hydro (0.3%). However, most of these “displacements” would have no impact in practice. For wind farms, only about 2% of the total required area (0.07%) is occupied by wind turbine foundations, roads, and electrical equipment; the rest can be—and usually is—used for other activities, such as grazing. For biomass, because the base case assumed 100% waste biomass for electricity (26 mdt/yr or about 21% of the domestic resource),5 the lands
used to produce this waste biomass are already counted in other uses. For solar PV, distributed roof areas, estimated to be about 20% each of residential and commercial 2050 building stock and representing about one-third of total solar area, would be built on existing structures; this contributes 0.5% to the total figure for solar. And as noted above for hydro, the amount of capacity in 2050 is assumed to be unchanged from today, so the figure for hydro counts only existing land displacements. See Table 5 for area estimates in km2.
Renewable Electricity Resource Share of Total Generation Energy Generation in 2050 Capacity
Factora Generation Capacity in 2050 Resource Upper Limita Resource Fraction Consumed Displaced landb TWh/yr GW GW km2 Wind - onshore 30% 154 40% 44 150 29% (11,100)220 Wind - offshore 10% 51 40% 15 293 5% (3,700)74 Concentrated Solar Power (CSP) 20% 103 27% 43 1061 4% 1,570 Centralized Photovoltaic (PV) Solar 10% 51 27% 22 17,000 0.1% 1,890 Distributed PV Solar 10% 51 27% 22 78 28% (1,890)0 Biomass 5% 26 85% 3.4 16.2 21% (10,300)0 Hydroelectric 5% 26 30% 9.8 24 41% (1,390)0 Geothermal 10% 51 90% 6.5 25 26% 390 Total 100% 513 165 (32,300)4,140
Table 5. Renewable resource assessment for California in 2050*.
*Assuming median case demand. Actual demand will vary depending on amount of zero-emission load balancing available, and hydrocarbon fuel demand (which affects refinery electricity demand), including the use of natural gas for CCS electricity.
a All estimates from CEC (2009) with the exception of the biomass resource, which was calculated from 121
mdt/yr (Youngs et al., in prep.) and 40% conversion efficiency to electricity (1000 dt/GWh). Note that the CEC estimates for onshore and offshore wind capacity factors are identical, as they are for solar CSP and PV.
b Directly displaced land areas shown, with total affected land areas in parentheses. The physical space occupied
by wind turbine foundations, roads, and electrical equipment is modest, estimated at approximately 2% of the total area required. Distributed PV is assumed to occupy existing roof areas, thus no directly displaced land. All biomass used for electricity is assumed to come from marginal agricultural land, agricultural and forest residues, and municipal waste streams. The hypothetical displaced land area, assuming all biomass was grown as energy crops, was assumed to be 10 dt/acre yield (DOE, 2011). For hydro, capacity in 2009 was 10 GW, so no new capacity is included in the direct land displacement estimate.
Build-out Scenario
Table 6 shows the build-out scenario for the renewables case between 2009 and 2050. The 2020-2050 average annual total build rate is 4.3 GW/yr, with 1.6 GW/yr for wind, 2.5 GW/yr total for solar, and smaller rates for other resources. It is assumed that existing non-renewable resources (nuclear, coal, natural gas) would phase out in order to make room for the build-out schedule depicted in the Table.
Existing 20% RPS
Projection Projection33% RPS Build-Out* Build rate*
Resource GW GW GW GW GW GW GW/yr 2009 2012 2020 2030 2040 2050 2020-2050 Wind† 3.0 5.9 11.0 26.9 42.7 58.6 1.6 Solar CSP 0.4 1.0 7.3 19.3 31.4 43.4 1.2 Solar PV 0.4 0.8 3.2 16.6 30.0 43.4 1.3 Biomass 0.9 0.4 1.0 1.8 2.6 3.4 0.08 Hydro 10.0 10.0 10.0 9.9 9.8 9.8 ~0 Geo-thermal 0.9 1.3 2.4 3.8 5.1 6.5 0.14 Total 15.6 19.4 34.9 78.3 121.7 165.1 4.3
Table 6. Build-out scenario for renewable electricity.
* Assume linear growth in generation capacities between 2020 and 2050. † Total of onshore plus offshore wind capacities.
Renewable Electricity
Technological Maturity
Technical maturity of renewable resources is shown in Table 7 below.
Technological
maturity bin* Wind Concentra-ted Solar Power (CSP) Solar Photovol-taic (PV) Geothermal Hydro and Ocean Biomass 1 Onshore, shallow offshore turbines Parabolic trough, central receiver Silicon PV, Thin-film PV, Concen-trating PV Conventional
geothermal Conven-tional hydro Coal/bio-mass cofiring, direct fired biomass 2 Dish
Stirling Better drilling and charac-terization technologies Biomass gasification 3 Floating (deepwater) offshore turbines ”Third generation” PV Alternative geothermal resources and recovery methods Wave, tidal and river turbines 4 High-altitude wind Off-shore or magma resources, Enhanced geothermal systems (EGS) Table 7. Technological maturity of renewable electricity technologies.
* See Table 3 for bin descriptions.
Costs
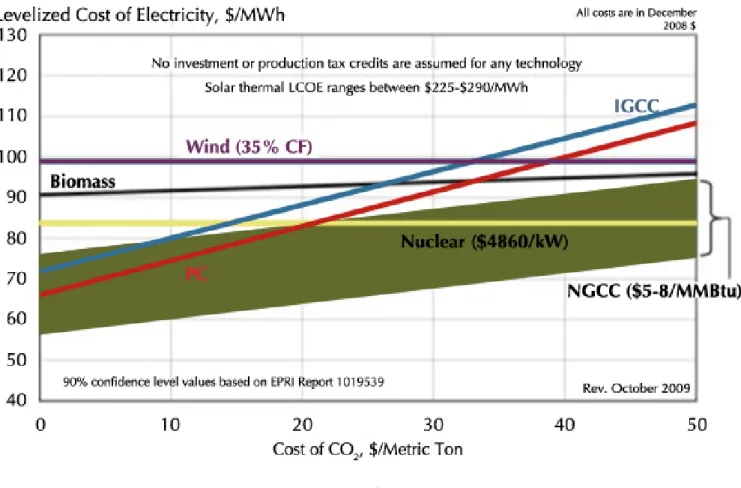
Current unsubsidized costs of renewable generation technologies, as compared to non-renewable technologies, are estimated from EPRI (2009b) and shown as a function of carbon price in Figure 1. As indicated on the chart, the unsubsidized cost of solar thermal (CSP) is higher than that of any other technology shown, at between $225 and $290 per MWh. The unsubsidized cost of solar PV estimated in the same report (not shown in the Figure) was even higher, at over $450/MWh.6 Wind
and biomass technology have virtually the same cost, between $90 and $100 per MWh. Costs of hydro and geothermal technologies were unavailable. Such costs can only be used as broad averages, as costs vary considerably by project due to many factors including financing, capacity factor at the specific location, and proximity to transmission.
6 A more recent study (Barbose et al., 2011) indicates that solar PV costs have declined rapidly in recent years, with an 11% drop in installed cost between 2010 and the first half of 2011. However, estimates of the levelized cost of electricity were unavailable from this report.
While current costs cannot be used to estimate the future mix of generation, due to potentially large changes in technology, and policy drivers that may favor or exclude certain technologies, the cost of electricity based largely on renewable technology will most likely be higher than the cost of electricity today. Most, but not all, recent analyses support this conclusion; see EPRI (2009c), Williams et al. (2011a), and Wei et al. (2011). A consideration of future price risk associated with fossil fuel technology is also important when comparing these costs.
Figure 1. Renewable technology costs
Source: EPRI (2009b)
Reliability and Resource Constraints
System reliability is dependent entirely on the ability to find balancing resources to offset the variability of generation, particularly wind and solar. As discussed elsewhere, it is assumed that this problem will be solved, and today’s system reliability level will be maintained or improved upon. From a geopolitical perspective, an economy powered by in-state renewable generation has advantages over one dependent on imported resources. While some fraction of generation, particularly wind, may be supplied from other Western states, the majority of generation is assumed to be in-state, and there are ample resources available to supply them without encroaching upon any physical limits
Renewable Electricity
Potential Synergies
Solar is a daytime resource, while onshore wind is predominantly a nighttime one. Southern California Edison has looked at the synergy that may exist between the two in planning their 500 kV renewable transmission line from the Antelope Valley (where there is in excess of 10 GW potential for wind and solar) to Los Angeles. Moreover, western hydro resources inherently have storage built into the reservoir collection systems, enabling potential synergies between hydro and other generation resources (Papay, 2012).
Discussion
Renewable energy is the poster child of green energy to reduce emissions. While California is blessed with a plethora of these resources not necessarily found in other states, sufficient to provide all of its projected future electricity demands, exploitation of large quantities of renewable energy will present challenges for load balancing. These must be solved if the potential of this important resource is to be achieved. Load-balancing technology is discussed below in Section 4.
IV. Load Balancing
Electricity supply must balance with demand at all timescales. Load balancing must provide ramping and peaking capacity, with response times on the order of minutes to an hour, as well as near-instantaneous output adjustments through spinning reserves and regulation services, some of which is done using automatic control technology. In the case of intermittent renewable energy, load balancing must include a source of power when the renewable energy source is not available. All of these functions are provided on current electricity grids mostly by natural gas, running at part-load using less efficient, single cycle turbines.7 Complementary solutions that exist today include
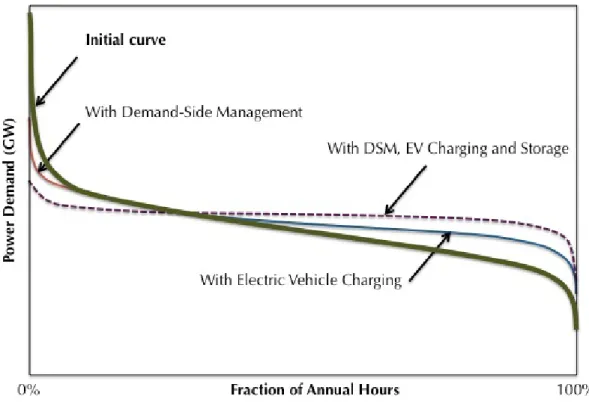
ramping hydro power, part-load operation of coal or nuclear plants, curtailment of intermittent generation, demand response programs to reduce loads during peak periods, and electricity storage. The last two approaches have so far been deployed to a very limited extent: approximately 4 GW (~7% of peak load) in demand response (Greenblatt and Long, 2012) and 1.2 GW in electricity storage (Williams et al., 2011b) exist on California’s grid today. See Figure 2 for a schematic diagram and Table 8 for more detailed information about load-balancing tradeoffs.
It is also possible to over-build baseload generation and either throttle back during off-peak load or use off-peak power to produce a useful byproduct, such as hydrogen or desalinated water. However, these approaches are generally very expensive.
Figure 2. Major supply-demand balancing approaches
7 Single cycle turbines have the advantage that they can be started and come on line much more quickly than combined cycle plants, which are typically used for baseload operation. Because such turbines are used infrequently, many are also older and less efficient than new single cycle plants.
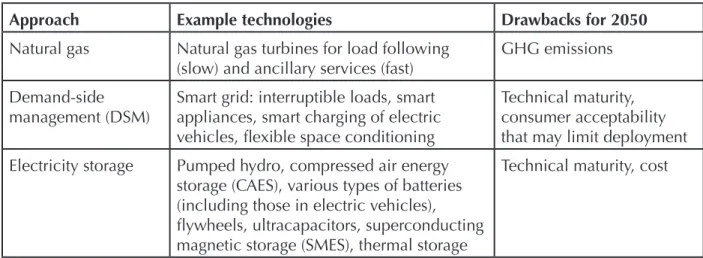
Approach Example technologies Drawbacks for 2050
Natural gas Natural gas turbines for load following
(slow) and ancillary services (fast) GHG emissions Demand-side
management (DSM) Smart grid: interruptible loads, smart appliances, smart charging of electric vehicles, flexible space conditioning
Technical maturity, consumer acceptability that may limit deployment Electricity storage Pumped hydro, compressed air energy
storage (CAES), various types of batteries (including those in electric vehicles), flywheels, ultracapacitors, superconducting magnetic storage (SMES), thermal storage
Technical maturity, cost
Table 8. Supply-demand balancing approaches in more detail. Technology Options
While mostly considered in the context of large amounts of intermittent renewable generation, supply-demand balancing is also a requirement for baseload-dominant solutions (nuclear and fossil/ CCS cases), as the ability to adjust their output up or down (ramping) is generally limited, and fast-time response capabilities are virtually nonexistent. Thus, all future scenarios will require load-balancing capacity, but large amounts of renewable energy in the portfolio represent the greatest challenge.
The use of natural gas produces significant carbon emissions, so gas is not a good choice in a carbon-constrained future because it may place severe limits on emissions from other sectors. In fact, emissions from natural gas-based load balancing may alone exceed the 2050 target in the renewables case; see CCST (2011) for a summary, and Greenblatt and Long (2012) for a detailed discussion of GHG emissions estimates.
Some possible ways to reduce or eliminate emissions include the following:
• Using sufficiently low-carbon fuel substitutes (e.g., from biomass) to fuel the gas turbines for spinning reserve and intermittent generation replacement
• Use of hydrogen produced in off-peak periods, either in a combustion turbine or fuel cell
• Adding CCS to natural gas turbines or fuel cells used for load balancing
• Use of hydro power or baseload power plants for ramping
• Flexible demand management strategies
• Electricity storage
Each of these solutions is discussed below in turn. Biomass
The use of biomass-based fuel for load following is problematic, as the CEF committee concluded that foreseeable biomass resources are probably inadequate to meet all demands for carbon fuels (both gaseous and liquid—see Youngs et al., in preparation, for an in-depth discussion). Therefore, if
Load Balancing
biomass is used for load balancing, it would not be available elsewhere (e.g., in the transportation sector), resulting in higher GHG emissions there, and therefore does not constitute an effective GHG reduction strategy.
Hydrogen
The use of hydrogen, explored in Greenblatt and Long (2012), may be a more feasible option because it is not resource-limited, but hydrogen faces its own challenges to production, storage and use. Also, in some applications, hydrogen may not be the most efficient use of energy resources (e.g., first converting a primary energy source into hydrogen, and then converting the hydrogen into electricity). Still, the advantages of producing a carbon-free fuel that can be stored indefinitely are clear, so this may be an important fallback strategy if others prove inadequate.
Natural Gas with CCS
Using natural gas fuel cells with CCS may also be worthy of further exploration, as the exhaust gases are pure CO2 plus water (which can be condensed and removed), making CO2 capture more straightforward. By contrast, in conventional combustion, the exhaust is significantly diluted with atmospheric nitrogen, and pollutants such as NOx may also be present, making CO2 capture
more difficult and costly. Still, the low utilization factor when used for load following may be cost-prohibitive given the high capital costs of such a system, and the added costs of CCS, including tying into a CO2 pipeline network, may also be significant.
Hydro Power
As discussed in the renewables section, hydro power has very limited prospects for expansion either in-state or out-of-state. What capacity currently exists—about 10 GW or 20% of current peak demand—is probably not sufficient to provide enough load-following capacity in a future grid with more than double today’s demand. Still, the possibility of “repurposing” hydro resources to provide some load balancing is interesting, and worthy of further study. The recent report by Wei et al. (2011) modeled utilizing some hydro resources in this manner.
Throttling of Baseload Plants
Throttling of baseload coal or nuclear plants is technically feasible, but has major economic implications, as these capital-intensive baseload plants need to run flat-out to maximize returns; moreover, part-load operation is less efficient, which for coal increases carbon emissions. Also, as noted in the CEF report on nuclear power (Richter et al., 2011), the Nuclear Regulatory Commission does not recommend frequent ramping for both performance and safety reasons. The French do ramp their reactors on a 24-hour basis, but not in the load-following mode currently employed by natural gas generators (many times per day).
Demand-side Management
Demand response capacity is currently very limited, but there is an expectation that this capacity can be greatly increased in a future grid that is more automated, allowing customers to turn over control of many types of non-critical devices to the utility, in exchange for lower electricity rates (see more extensive discussion in Greenblatt and Long, 2012). Such devices include lights, space conditioning, water heating, major appliances such as refrigerators and washing machines, etc.—
virtually anything whose power consumption can be moderated within a range, interrupted for short periods, or scheduled to operate only when there is excess generation capacity available (e.g., a dishwasher that can run any time before the following morning). Commercial entities already participate to a modest extent, as larger entities can command significant load reductions, and there is a strong financial interest to make the investments in exchange for rate reductions. Importantly, however, it may be very difficult to accomplish from a public acceptance standpoint, and the full potential of demand-side management approaches has not been adequately assessed.
An important new class of load in homes and businesses will be the electric vehicle, which falls into the category of being flexible in its charging schedule, and a major load besides, thus adding a significant increment of increased load flexibility to the future grid. Changes in the design of buildings to accommodate demand response, such as the addition of thermal reservoirs to allow for preheating or precooling of interior space during excess supply periods, could also increase load flexibility, and could be encouraged through a combination of rate pricing and code requirements. However, it is still largely unknown what fraction of future demand can be made truly flexible, and what price consumers will demand for this (modest) loss of control.
Electricity Storage
Electricity storage represents a set of technologies at different stages of maturity, all of which are currently expensive enough that very little overall capacity has been built. It is expected that the need for storage technology will grow in the near future, with 33% renewable capacity legislatively required by 2020. Electricity storage spans a wide range of operating timescales, from microsecond to several days (or longer), using different technologies. An excellent review of the current state-of-the-art can be found in EPRI (2010), but two promising near-term technologies are:
• Flow batteries, which occupy a middle ground of fast (sub-second) response time and large (multi-hour) capacity, with near-term prospects for cost decreases; and
• Compressed air energy storage (CAES), which offers inexpensive incremental storage capacity, but whose base capital costs are still considered prohibitive compared to its chief competition, natural gas turbines, and whose reliance on underground reservoirs limits where it can be deployed.
Figure 3 illustrates time domains of various storage technologies, and Figure 4 illustrates where new storage projects are being constructed in the U.S.; many are located in California. Table 10 (discussed in the following section) lists a range of storage technologies along with their technical maturities, round-trip efficiencies and current costs. Note that there is very little available technology to handle the bulk power management that would be required to compensate for long windless or sunless periods; see discussion of the “gigawatt-day” problem.
Load Balancing
Figure 3. Current plant size and time duration of storage technologies.
Source: EPRI (2010), Figure ES-6.
Figure 4. Energy Storage projects in development in the U.S.
A perennial question is whether storage should be located at the point of generation or nearby to loads. Cases can be made for both, for different reasons. If storage is sited at an intermittent (e.g., wind or solar) generation plant, it can lower the cost of expensive transmission by maximizing the capacity factor of the transmission line. On the other hand, in transmission-constrained load centers, storage located at the substation level may defer the addition of new feeder lines, at substantial cost savings.
An emerging technology intimately tied to renewable generation is CSP with integrated thermal storage. As discussed in the renewable section, this combination is relatively inexpensive because CSP inherently contains some thermal storage in the closed loop of hot working fluid. Because CSP is only economical in locations with virtually no clouds, the solar resource, and therefore generation output, is very predictable. Shifting the output peak to coincide with peak load requires only a few hours of storage capacity (EPRI, 2009b), and in some cases, such as Solar One in the Mojave Desert, 24 hour storage has been built which enables output to be completely decoupled from energy extraction (Papay, 2012). While not a completely flexible resource, CSP has the potential to contribute significantly to daily peak load requirements, both in a largely intermittent renewable case and in baseload-dominant cases.
Another interesting new battery technology that may be a candidate for low-cost bulk storage is based on liquid metals. First introduced by Bradwell (2006; 2011), the concept uses two immiscible metals (e.g., antimony and magnesium) separated by a molten salt layer. The entire cell is kept at high temperature (700°C), which owing to high diffusion rates and large surface area, is capable of very high currents. Materials are inexpensive, potentially providing large storage capacity at low incremental cost. The concept received funding from ARPA-e (ARPA-e, 2009) and is now a commercial company (LMBC, 2011) with seed funding from Bill Gates (LaMonica, 2011), among others.
Estimates of Required Load-balancing Capacity
Calculating the amount of load balancing by different technologies is not straightforward, due to the complexity of the grid and its strong dependence on the percentage of intermittent renewable generation (of various kinds) and daily and seasonal load shapes, which presumably may change significantly in the future. Nevertheless, recent studies can shed some light on this question.
A report by KEMA (2010) explored the requirements for storage in 2020 in California, assuming that the 33% renewable generation target was achieved. The scenario assumed:
• 3,200 MW of PV,
• 7,300 to 10,000 MW of CSP
• 11,000 to 13,000 MW of wind generation
The main conclusion of the report was that between 3,200 and 4,800 MW of regulation services would be required in the case without storage, about 2.5 to 4 times today’s storage capacity of 1,200 MW.8 By contrast, only 400 MW of conventional regulation plus 1,200 MW of storage capacity
(with 2 hours of capacity, or 2,400 MWh, and <10 MW/sec ramping capability) could provide similar or superior results.
Load Balancing
By contrast, NREL (2010) examined the integration of 35% wind and solar into the western region’s grid, and concluded that intermittency would require 100% backup with conventional sources, including large hydro and natural gas turbines, to maintain system reliability. As the renewable penetration level was similar to that in KEMA, the very different conclusions arrived at (100% vs. 15-18%) indicate that there is not yet a set of accepted metrics for estimating the amount of supply-demand balancing required, let alone required storage capacity.
To make estimates of the amount of natural gas ramping capacity required in the absence of either flexible load control or electricity storage, we examined two sources of data: KEMA (2010) and CEC (2006). The KEMA study in its 33% renewables scenario estimated that 26 GW of wind plus solar generation would be needed for a total system demand of 255 TWh in 2020. We conservatively assumed that natural gas ramping would be needed to balance this renewable generation equal to 1 hour in the morning and 2 hours in the evening. This translated into 28 TWh/yr, or 11% of total demand. The CEC gross system power estimate for 2005 (CEC, 2006) indicated that natural gas supplied 38% of a total demand of 288 TWh in 2005, though the breakdown between combustion turbine (fast ramping) and combined cycle (slow ramping/baseload) generation was not specified. Again from the KEMA study, it appears that combustion turbines accounted for ~10-20% of natural gas generation, which translates in the CEC estimate to 4-8% of total generation.
From these two data points, we can crudely extrapolate the natural gas ramping demands for future scenarios that require larger amounts of either intermittent renewable or baseload generation. For the former, the renewables case is composed of 80% wind plus solar generation in 2050, almost three times the KEMA study level. Simplistically extrapolating the level we arrived at above, and downscaling the intermittent contribution by the amount of natural gas now required on the system, approximately 20% would be needed.9 In reality, more load-following generation would be required
if no flexible load control or electricity storage were available, but here we assume an amount sufficient to keep the natural gas generation requirement at 20%.
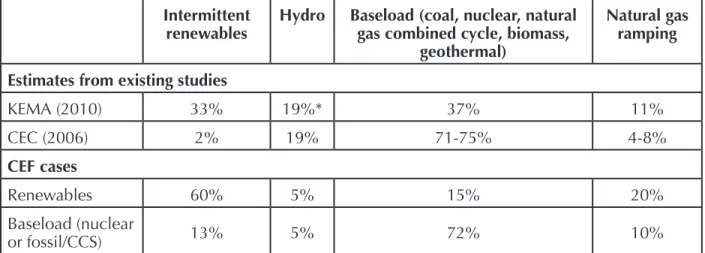
To obtain an estimate for the baseload case, we turn to the CEC estimate, whose 2005 gross system power (including imported electricity) contained 2% intermittent renewables (wind and solar), 7% baseload renewables (biomass and geothermal), 19% hydro, 14% nuclear and 20% coal. Note that 5% of hydro is primarily imported from the Northwest. Using the earlier estimate of 4-8% natural gas ramping, this results in 30-34% baseload combined cycle natural gas; thus, the baseload share of electricity generation is 71-75%. See Table 9 below for more information. Therefore, assuming 10% natural gas generation for a 72% baseload system (fossil/CCS or nuclear, plus biomass and geothermal) is not unreasonable, again assuming some flexible load control and electricity storage.
9 That is, with 20% natural gas generation and a fixed contribution of 20% from non-intermittent renewables (hydro, biomass and geothermal), the intermittent renewable capacity would be reduced to 60%. The 20% natural gas figure matches the amount obtained by scaling the KEMA study result (11%) by the ratio of intermittent renewables in the two scenarios (60% / 33%).
Intermittent
renewables Hydro Baseload (coal, nuclear, natural gas combined cycle, biomass, geothermal)
Natural gas ramping Estimates from existing studies
KEMA (2010) 33% 19%* 37% 11% CEC (2006) 2% 19% 71-75% 4-8% CEF cases Renewables 60% 5% 15% 20% Baseload (nuclear or fossil/CCS) 13% 5% 72% 10%
Table 9. Estimates of natural gas ramping generation needed for 2050 scenarios.
* Assuming same amount of hydro capacity as in CEC (2006).
These estimates are consistent with more recent results from other California studies. Williams et al. (2011a, 2011b) explored a set of electricity generation scenarios similar to CEF, and found that their high-renewables case required 26% of non-renewable generation (including 6% nuclear and an unspecified combination of hydro, natural gas, coal, and imported electricity) and 12 GW of electricity storage to balance loads. By contrast, their high-nuclear, high-fossil/CCS and mixed (similar to the CEF median) cases each required about 10% of non-nuclear, non-renewable generation, plus between 4 and 8 GW of electricity storage. Wei et al. (2011) modeled a 2050 base case that reduced electricity-sector GHG emissions by 80% below the 1990 level, and included about 42% intermittent renewable generation, plus about ~8% nuclear and ~30% fossil/CCS generation. They found that ~8% of 2050 energy demand was provided by natural gas generation without CCS, and load-balancing spinning reserves totaled 12 GW of capacity, provided primarily by hydro (~75%) and electricity storage (~25%).
The Renewable “Gigawatt-day” Problem
Unique to renewable electricity is a long-term variability challenge we call the “gigawatt-day” problem. Unlike the short-term renewable variability characterized by an hourly or daily mismatch between available supply and required demand, there exists the near-certain scenario that, despite a geographic diversity of renewable wind, solar and other resources, there will be extended periods of time—multiple days or even weeks—where renewable supply is insufficient to meet demand even after all available load flexibility and short-term storage resources have been deployed. However, the CEF committee was unable to quantitatively estimate the capacity required to meet this challenge because, to its knowledge, no studies have yet been carried out to directly explore this issue.
As a worst-case example, if we assume that all of the intermittent wind and solar generation in the high-renewables case were unavailable for an entire week, this would amount to a shortfall of 8 TWh, or roughly 300 GW-days, of electrical energy. This quantity would dwarf all other storage estimates discussed in the previous section, which are on the order of 12 GW and less than 1 day of storage. Supplying 8 TWh via natural gas turbines would not result in overwhelming GHG emissions (about 5 MtCO2e/yr), but it would be extremely costly to keep roughly 50 GW of capacity