CORPORATE FINANCE RISK ANALYSIS WITH CRYSTAL BALL
®– ARE WE ADDING VALUE?
Huybert Groenendaal Vose Consulting US LLC
14 Green Street Princeton, NJ, 08542, USA
David Vose Vose Consulting US LLC
ABSTRACT
Reading this abstract, you are probably a Crystal Ball user who is interested in corporate finance risk analysis and risk man-agement. And given that you are a Crystal Ball user, you are probably convinced of the value of risk analysis in general. But when using risk analysis and Crystal Ball in corporate finance, how are we actually adding value?
In this presentation, we discuss the benefits and costs of corporate finance risk analysis using Crystal Ball. We first dis-cuss why many people erroneously believe that risk analysis does not necessarily add a lot of value and in addition why fi-nance theory may provide an argument that many business risks are not relevant for making optimal decisions. Then we give a number of reasons why there are good arguments that all types of business risks are important and should be analyses and managed. Finally, we briefly discuss the different costs associated with doing financial risk analysis and offer a few recom-mendations.
1 INTRODUCTION
‘The most risky attitude to adopt towards the future is not to think about it’.1 This statement is especially true when decisions have to be made in risky or uncertain situations. We can think of a lot of different risks that a firm has to deal with, such as investment risk, credit risk, operational risk, market risk, technological risk, liquidity risk, etc. As risks and returns are oppo-site sides of the same coin, the proper analysis and management of a firm’s risks and opportunities will give it a strategic ad-vantage over other firms.
A range of methodologies and tools is available to support decision making under uncertainty, such as what-if analysis, scenario analysis, sensitivity analysis and risk analysis using simulation. With the improvements in computer power and the availability of user-friendly simulation software such as Crystal Ball, risk analysis using Monte Carlo simulation especially has seen a great increase in popularity. In this paper, we focus on corporate finance risk analysis using Crystal Ball. We ask the question: what are truly the costs and benefits (and the net value) of corporate finance risk analysis using Crystal Ball and from where do these benefits arise?
2 WHY PEOPLE MAY BELIEVE THAT RISK ANALYSIS DOES NOT NECESSARILY HELP
We are often asked what the value is of quantitative risk analysis over other common methods such as point-estimates and what-if analysis. In the almost twenty years we have worked with clients, we have found that people often have similar rea-sons to believe that (corporate finance) risk analysis is not necessarily a useful method for them, and below we discuss two main reasons.
2.1 Fallacy 1: If I use averages for my inputs, I will get the average (expected) results
This argument, also implicit in the common practice of using best-guess values in financial models, probably comes from the way most people are taught to think in school and university. Most education, even at a graduate level, teaches us to think
1
and make decisions in a “deterministic” way, meaning that for any question there is just one right answer. Even in many classes in business schools, risks and risk analysis are not often taught in any meaningful detail, and seldom discuss the intri-cacies of simulation. And thus, we apply our deterministic thinking that 1 + 2 = 3 to decision making in business, while in re-ality this is usually not the case as 1 and 2 are not well known or may be random variables.
There are three main problems with only using deterministic (i.e., single value) inputs in a corporate finance analysis: 1. No explicit awareness is given to risks. The use of average (or most likely) inputs in a financial risk analysis does
not encourage people to think and brainstorm about the project’s risks and opportunities. The benefits of bringing awareness to risks and uncertainty is discussed in section 3.1.
2. A ‘best guess’ is usually a most likely value, not a mean. This point is well illustrated in project planning (see also the paper and talk by P. Leach at the 2005 Crystal Ball User Conference). For example, consider a project consisting of two serial stages that are estimated to each take a minimum of two weeks, most likely three weeks and maximum ten weeks (modeled with a Triangular distribution). When using best guess estimates, the analyst would calculate that expected total project duration will be 3 + 3 = 6 weeks. However, in reality the expected (‘mean’) project dura-tion is 5 weeks per stage, and therefore the expected total project duradura-tion is 5 + 5 = 10 as show graphically below.
+
=
Figure 1: Calculation of the expected project duration
The difference between the sum of the most likely values and the resultant mean is greater the more the input distri-butions are skewed, and the more distridistri-butions that are being added together. The difference in results is even more stark when tasks are completed in parallel. Finance theory is based on estimating means, not most likely values, so a financial model (for example, an NPV calculation) based on most likely values is inconsistent and will not give you the average (expected) results you are looking for.
3. Even if true average inputs are used in the financial analysis, the ‘flaw of averages’ can cause errors
This rule states that analysis based on single number (averages) assumption are most often wrong. A range of reasons for this are explained in paragraph 3.2.
2.2 Fallacy 2: The risk-adjusted discount rate, using the Capital Asset Pricing Model (CAPM), takes into account
all risks of an investment
To understand this argument, we introduce a basic probability rule known as the Central Limit Theory (CLT). This rule goes as follows: the mean
x
of a set of n random samples (where n is large) drawn independently from the same population dis-tribution (with mean µ and standard deviation σ) will be Normally distributed:⎟⎟
⎠
⎞
⎜⎜
⎝
⎛
⎯
⎯ →
⎯
→∞n
Normal
x
nµ
,
σ
(1)The formula shows that the more samples you take (i.e., the larger n), the narrower the distribution will be around the population mean (i.e., the smaller the Normal distribution’s standard deviation).
CLT is an asymptotic rule meaning it is an approximation that is exactly true only when the sample size n is infinite, but the approximation actually works for surprisingly low sample sizes, depending of course on the level of required accuracy. If the population distribution is Normal, CLT is exact for all n. A fairly loose form of CLT, more relevant here, says that if you add up a large number n of different random variables, and if none of those variables dominate the resultant distribution spread, the sum will eventually look Normal as n gets bigger.
Why is this basic probability rule important for us? Because if a company has a portfolio of independent risky projects, the average risk per project reduces with increasing number of projects: if one project does badly, another may do well and
therefore offset the losses of the first project. In other words, the risks of a project can be partly controlled by “not putting all your eggs in one basket,” but diversifying and investing in a number of projects. This portfolio effect is illustrated below for a situation where a company invests in 1, 3 or 10 independent project, each with an expected pay-off of $1,000,000 and a standard deviation of $200,000 (assuming a Log normal distribution).
Figure 2: Average cash flows per investment, if 1, 3 or 10 investments are made
If fact, the story gets even better if we look from the perspective of the firm’s owners. Assuming that most investors are well diversified (this is a valid assumption, given that most stocks in the Western world are held by large institutional inves-tors such as insurance companies and pension funds), there is a second layer of risk diversification. Not only do companies reduce their risks by diversifying through investing in a range of projects, but also the owners of these companies (investors) diversify by investing in a great number of stocks.
The idea of diversification works as long as the individual stocks (or projects) are independent of each other, or even bet-ter negatively correlated. However, the greabet-ter the positive correlation between stocks (or projects), the less effective diversi-fication is. In other words, if there is a high positive correlation between two stocks, and the first stock does not do very well, then the second stock is likely also not going to do well. This is the idea that lies behind the Capital Asset Pricing Model (CAPM), which says that the only risks that are relevant are those risks that you cannot diversify away by holding more stocks. CAPM assumes that there is a linear relationship between the expected returns of a security and the security’s ß value (which is a measure of systematic, market or none-diversifiable risks). Thus, the higher the ß value of a stock (e.g. the more correlated a stock’s returns are to changes in the market portfolio), the higher the required returns, and the higher the required return, the higher the costs of capital (e.g. the discount rate). Therefore, many people would argue, by using a risk-adjusted discount rate based on the CAPM model, one accounts for the risks inherent in an investment. Why should one bother also performing a financial risk analysis using Crystal Ball?
The reasons is that non-systematic risks can also be costly to the firm. Corporate finance risk analysis using Crystal Ball will not only explicitly include these risks into the decision making process (further discussed in section 3.1), but will also avoid the ‘flaw of averages’ in financial analyses (more details in section 3.2), resulting in a more accurate assessment of the total risks of an investment.
3 BENEFITS OF FINANCIAL RISKS ANALYSIS
There are a variety of ways that risk analysis can help make more informed and defensible decisions in business. We focus here on the following two:
1. It explicitly includes (financial) risks into business decision making, 2. It avoids the Flaw of Averages.
3.1 Explicitly includes risks into the decision making process
We believe that getting people to thinking about risks and opportunities is often the greatest benefits of financial risk analy-sis. Raising awareness of the uncertainty and risks inherent in business decisions can provide the following benefits.
1. More realistic analysis. Financial analysis can become more realistic, because for instance no consensus is needed anymore for every input parameters. Instead, uncertainty about model parameters is included in the analysis and one can determine the value of better information on the final optimal business decision;
2. Risk-based decision making. It can move a company’s culture to a more risk-based decision making. For example,
by asking people to debate what scenarios would coincide with very high or very low values of the parameter of in-terest (rather than simply asking for minimum and maximum values for a model variable), one is in fact identifying risk and opportunity drivers, and providing a rich ground for developing good risk management. We have often seen that a formal risk identification process can lead to superior strategy from the outset of a project or investment, be-cause it leads employees to focus on increasing the likelihood and magnitude of positive opportunities, and decrease the likelihood and magnitude of negative impacts; and
3. Consistent risk approach. Companies face a wide range of risks and tools to manage them, from financial
instru-ments to manage risks in exchange rates, raw material prices, energy, etc to insurance, as well as strategic options like diversification. Risk analysis provides a means to compare these components of risk management on the same footing, helping ensure that there is a consistent risk management approach. So, for example, a company may be spending large amounts of money on some type of insurance compared with the risk it covers, and spending too lit-tle on health and safety compared with the risks that avoids.
4. Using risk as a strategic tool. Uncertainty has its upside as well as its downside. Systematically identifying and managing risk can give a company the edge over its competitors by opening the chance to take on projects that oth-ers would consider too risky.
3.2 Prevents the “Flaw of Averages” 2
The Flaw of Averages is a term used to describe the fallacies that arise when single numbers (usually averages) are used to represent uncertain outcomes (Savage, 2000). For example, when a financial analyst uses expected values as inputs to repre-sent uncertain parameters, the results will often not be equal to the true expected results. Aside from the question of how the analyst was able to determine the mean (as opposed to the most likely) without knowing the distribution, the two other main reasons why the Flaw of Averages exists are (1) portfolio effects and dependency, and (2) non-linearity.
3.2.1 Portfolio Effects and Dependency
This form of the flaw of averages results from not taking into account the effects of diversification and statistical dependence. Both diversification and correlation are very hard to analysis with analytical techniques; simulation using Crystal Ball can however prevent you from ignoring both effects where they are you important, using correlation tools like linked distribu-tions, rank order correlation, logical relationships and copulas (with Vose Functions).
Take for example a company that has ten investment opportunities to chose from, but can only invest in three of them because of a limited budget. It could calculate NPV’s for each project separately, using expected (mean) input parameters and rank the opportunities from high to low according to the (expected) NPV’s. However, when it select the top three projects, it would not necessarily make the optimal decision. The reason is that there likely will be some dependency (correlation) be-tween the different investment opportunities, which will effect the optimal decision (this is addressed in portfolio theory; Markowitz, 1952).
When investment opportunities are correlated, it is therefore important to take dependency into account. Monte Carlo simulation with Crystal Ball, together with optimization with OptQuest can help you do this, avoid this Flaw of Averages and find the optimal investment opportunities.
3.2.2 Non-linearity
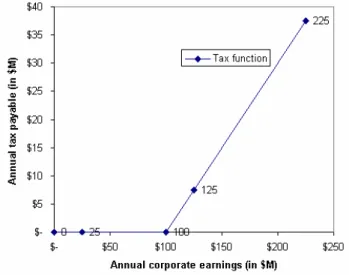
Corporate tax offers an example of non-linearity. For example, when in a certain year the company’s earnings are less than the depreciation allowed, it will not be able to fully take advantage of the depreciation tax-shield.
2
Let’s assume that a firm builds one factory for $1 billion, which it can depreciate linearly over ten years ($100M per year). The annual income stream is expected to be anywhere between $50M and $250M and most likely $125M (modeled with a triangular distribution). To keep the example very simple, we assume no annual growth, a zero discount rate and that income will be the same from one year to the next. The tax rate is 30%. If we only consider the most likely income stream, the annual tax liability is calculated as ($125M - $100M) * 30% = $7.5M. We can see this more clearly in Figure 3.
Figure 3: Non Linear Taxes and Risk
Since revenue is uncertain, the tax liability is also uncertain, and can be represented by the following probability distribu-tion. There is about a 30% probability that the annual tax liability will be zero (see the height of the high bar on the left side of the figure), which is a direct result of the fact that the probability of annual earnings being lower than $100M, assuming a Triangular ($50M,$125M,$250M) is about 30%. Furthermore, when we take into account the uncertainty around the annual earnings, the expected (mean) tax liability is $9.61M, which is higher than the $7.50M we calculated before.
Figure 4: Distribution of annual tax liability
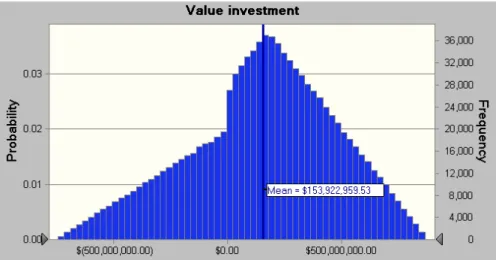
If we only use expected values, the total value of the investment would be calculated at ten years times ($125M - $100M) * 30% = $175M. However, when we take into account the uncertainty, using Crystal Ball, we can see that the ex-pected total value of the investment is equal to the lesser value of $154M, as shown in the figure below.
Figure 5: Distribution of value of the investment
One omission in the above example is the ability of firms to “carry forward” their losses to future tax years. However, because the probability that the firm can use the carry forward will always be lower than one, and therefore even when con-sidering carry forwards, there is a tax advantage from lower risks in income streams compared to higher risks. We kept it as simple as possible and didn’t included carry forwards, because the goal of showing the above example was to illustrate the principle of ‘non-linearity’. Including them in a simulation model is however not complicated.
4 COSTS OF FINANCIAL RISKS ANALYSIS
Clearly, to make a fair assessment of the value of corporate finance risk analysis using Crystal Ball, we will have to also con-sider the costs associated with this. Some main costs components are:
1. Costs of the software.
2. Costs of training people to perform financial risk analysis. This includes training people on how to use the Crystal
Ball software, plus educating people in financial risk analysis skills, such as the fundamentals of probability theory, Monte Carlo simulation (using Crystal Ball), eliciting and modeling expert opinion, times-series modeling and including risk in Net Present Value (NPV) analysis.
3. Cost of improper calculation. Almost every study that has attempted to measure error rates in spreadsheets has found
them in abundance (see, for example, http://panko.cba.hawaii.edu/ssr/Mypapers/whatknow.htm). Using probability distributions in place of single-point estimates can increase the error rate even further, not least be-cause the manipulation of random variables (like a simple multiplication) has more complex rules than the equivalent calculation with fixed values. Moreover, stochastic models (models generating random numbers) require considerably more experience to check than deterministic models (models using fixed values).
4. Cost of using any consultants specializing in risk analysis. Consultants can be expensive, but good consultants can
also help you avoid much bigger costs, and can get the job done quicker and with a greater guarantee of quality. Vose Consulting reviews and audits a lot of financial models, many of which we find have substantial errors which can lead a decision-maker to make the wrong choice, or fail to seize an opportunity to let opportunities work in their favor. In our view, the best consultants work with the client to transfer knowledge so that the client retains control of their risk analy-sis, and learn to do the next one better.
5. Cost of any potentially reduced management understanding of the analysis by using simulation. It is very
impor-tant that management understands the results of the financial risk analysis. While people are often used to making deci-sions based on one number, now they need to interpret and understand the results of a risk analysis, such as a distribution of possible outcomes. Training in how to make decisions based on risk analysis is useful, and strong use of graphical tools (distribution plots, spider and scatter diagrams, for example) will make understanding a risk analysis far more intui-tive.
5 CONCLUSION – IS CORPORATE FINANCE RISK ANALYSIS ADDING VALUE?
The main benefit of corporate finance risk analysis is to improve decision making by making people think explicitly about risks and opportunities and by avoiding the Flaw of Averages. We believe that although there are some initial costs associ-ated with including risk analysis into financial analysis and business decision making, the benefits of financial risk analysis greatly outweigh their costs.
The goal of risk management is certainly not to minimize the risks, but to optimize the risks so that the risks match the risk attitude of the business or organization concerned. As risk management strategies do have certain costs associated with their implementation (e.g. an insurance premium is normally higher than the expected loss), there must be justification for the cost of reducing risk.
So, what are then the necessary steps to make corporate finance risk analysis work for you? We recommend taking the following steps:
• Buy Crystal Ball simulation software (you have probably already taken this step).
• Receive some proper training in how to perform accurate and defensible risk analyses. Calculation rules in risk analysis are often very different from normal algebra taught in school, so be very careful not assume that owning risk analysis software will make you a risk analyst.
• Consider having someone with considerable risk analysis expertise “hold your hand” when you perform a certain type of analysis for the first time, or when the stakes are very high.
Good luck! REFERENCES
Doherty, N.A. (1985). Corporate Risk Management – A Financial Exposition. McGraw-Hill, Inc.
Doherty, N.A. (2000). Integrated Risk Management – Techniques and strategies for reducing risks. McGraw-Hill, Inc. Markowitz, Harry M. (1952). Portfolio selection, Journal of Finance, 7 (1), 77-91.
Savage, S. (2000). The Flaw of Averages. San Jose Mercury News. Vose, D. (2000). Risk analysis, 2nd ed. J Wiley, Chichester, UK. BIOGRAPHIES
Huybert Groenendaal ([email protected]) works as an risk analysis consultant and heads Vose
Con-sulting US, located in Princeton, NJ, USA. Although the Princeton office mainly focuses on clients in the US and Canada, Huybert works with clients globally. Huybert has experience using risk analysis modeling techniques to a broad range of fields, including corporate finance risk analysis, forecasting, integrated corporate risk management, marketing, food safety and animal import. Huybert has a PhD in risk analysis from Wageningen University, The Netherlands and an MBA in Corpo-rate Finance from the Wharton School of Business, University of Pennsylvania. In addition, he has a Masters of Science with majors in Veterinary Epidemiology and Animal Health Economics from Wageningen University.
David Vose ([email protected]) heads Vose Consulting. He has been a specialist, independent consultant
in Monte Carlo risk analysis since 1988. David started directly applying risk analysis as a marketing and new projects analyst to an oil and gas exploration company in New Zealand. He has applied risk analysis modeling principles to a wide range of problems and industries including oil, gas and LPG marketing and production, diamond mining, electricity generation and supply, shipping logistics and acquisitions, forecasting, project management, project economics, foreign exchange manage-ment, banking, engineering economics, forestry, reliability modeling, epidemiology and food safety, contract risk, banking operational risk, animal imports and insurance. For the last eleven years, he has also been running training seminars in risk analysis modeling that exploit the techniques he has developed and applied in real life problems.
David has consulted and/or lectured to companies and governments in over twenty countries around the world. He gives oc-casional tertiary lectures on risk analysis modeling and runs training seminars for a wide range of organizations. He has writ-ten the textbook Risk Analysis, published by John Wiley and Sons, now in its second edition and seventh print run, that is based around the training seminars he has developed. He has appeared as an expert witness for the US government and other, international disputes that are centered around risk-based arguments.