BUILDING FOUNDATIONS FOR THE FUTURE:
Housing, community development, and economic
opportunity in non-metropolitan Canada
Addendum Data: British Columbia Community Sample
Summer 2020
Marleen Morris, Julia Good, and Greg Halseth
using, community development, and economic
opportunity in non-metropolitan Canada
Building Foundations for the Future: Addendum i
Acknowledgements
The authors gratefully acknowledge the funding received from BC Housing over the past six years in support of the Community Development Institute’s housing research program. In particular, we wish to thank Shayne Ramsay, Chief Executive Officer and Karen Hemmingson, Chief Research Officer for their encouragement and assistance.
Authors:
Marleen Morris, Co-Director, Community Development Institute and Adjunct Professor of Geography at the University of Northern British Columbia
Julia Good, Research Associate, Community Development Institute at the University of Northern British Columbia
Greg Halseth, Professor of Geography and Co-Director, Community Development Institute at the University of Northern British Columbia
Photo credit front page: Aerial view of Kitimat, Courtesy of the District of Kitimat.
Availability
This addendum report is posted on the website of the Community Development Institute at UNBC: https://www.unbc.ca/community-development-institute/researchprojects.
Building Foundations for the Future: Addendum ii
The Community Development Institute
The Community Development Institute (CDI) at UNBC was established in 2004 with a broad mandate in the areas of community, regional, and economic development. Since its inception, the CDI has worked with communities across the northern and central regions of British Columbia to develop and implement strategies for economic diversification and community resilience.
Dedicated to understanding and realizing the potential of BC’s non-metropolitan communities in a changing global economy, the CDI works to prepare students and practitioners for leadership roles in community and economic development, and to create a body of knowledge, information, and research that will enhance our understanding and our ability to deal with the impacts of ongoing transformation. The Community Development Institute is committed to working with all communities – Indigenous and non-Indigenous – to help them further their aspirations in community and regional development.
Contact Information
For further information about this topic and the project, please contact Marleen Morris or Greg Halseth, Co-Directors of the Community Development Institute.
Community Development Institute University of Northern British Columbia 3333 University Way
Prince George, BC V2N 4Z9 Tel 250 960-5952
Building Foundations for the Future: Addendum iii
Table of Contents
Acknowledgements ... iAvailability ... i
The Community Development Institute ... ii
Contact Information ... ii Introduction ... 1 Methodology ... 2 Population Data ... 3 Housing Data ... 7
Table of Figures
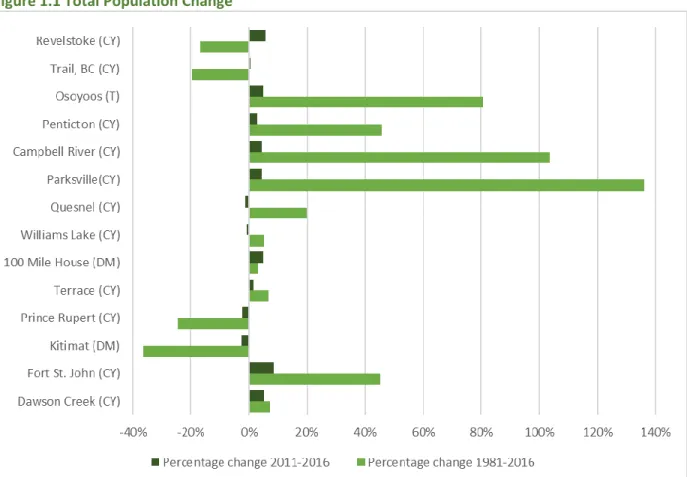
Figure 1.1 Total Population Change ... 3Figure 1.2 Median Age, 2016 ... 4
Figure 1.3 Population Pyramids ... 5
Figure 1.4 Average Number of Persons per Private Household ... 6
Figure 2.1 Period of Construction ... 7
Figure 2.2 Dwelling Condition, 2016 ... 8
Figure 2.3 Major Repairs Needed by Tenancy, 2016 ... 9
Figure 2.4 Single Detached Dwellings, 2016 ... 10
Figure 2.5 Smaller Households vs. Smaller Dwellings, 2016 ... 11
Figure 2.6 Larger Households vs. Larger Dwellings, 2016 ... 12
Figure 2.7 Households Spending 30% + of their Income on Shelter Costs ... 13
Figure 2.8 Rental Affordability by Tenant Age, 2016 ... 14
Figure 2.9 Average Value of Dwellings, 2016... 15
Building Foundations for the Future: Addendum 1
Introduction
In non-metropolitan Canada, the state of housing has become a key constraint on economic and community development. This study points to a number of emerging issues and challenges, looks at the implications of these, and concludes with a call to action on housing issues in non-metropolitan areas in Canada.
Understanding that housing is a critical building block for community and economic development, the Community Development Institute (CDI) at the University of Northern British Columbia (UNBC) has focused much of its research on identifying and exploring the issues, needs, and opportunities for non-metropolitan housing. Based on our long-standing background in housing, and through a number of commissioned housing studies in northern British Columbia (BC) communities in recent years, the authors began to recognize patterns of housing issues across non-metropolitan communities. This caught the attention of BC Housing, who then commissioned further research to explore whether those patterns held true across BC. When this was confirmed, the CDI began to look at other provinces and territories across Canada.
This data compilation is an addendum to Building Foundations for the Future: Housing, community development, and economic opportunity in non-metropolitan Canada. It presents data tables for 14 British Columbia communities, which were part of our initial research sample. The data includes demographic information, as well as data on housing stock, affordability, and home ownership rates.
Building Foundations for the Future: Addendum 2
Methodology
Statistics Canada classifies communities as Census Metropolitan Areas (CMA) when they have reached a population of 100,000. According to the 2016 census, roughly one-third of Canadians live outside of CMAs. Communities with 10,000 to 99,999 people are categorized by their population size as Census Agglomerations (CA). Smaller municipalities and settlements are sorted into Metropolitan Influence Zones (MIZ) according to their level of regional interconnectivity with metropolitan centres.
For our study, we decided to look at the full range of communities outside of CMAs. From the non-metropolitan area (NMA) of BC, we selected a sample of 14 communities from our dataset. These NMA communities range in 2016 population size from 5.085 (Osoyoos) to 33,761 (Penticton). The histories of the communities in our sample vary from settlements established with early settler economic activity in BC to instant towns purpose-built by industry. They also represent a diverse range of primary economic activity, which includes agriculture, forestry, mining, oil and gas, fishing, manufacturing, tourism, retirement living, and government services. The sample communities are commonly located some distance from, and have a weak connection to, a CMA.
NMA housing has to be considered in the context of the NMA population and their needs. For this reason, the research focused first on collecting demographic data, including current population, population change over time, age, and household size. Next, data was collected on the housing in each community, including characteristics of the housing stock, housing affordability, and home ownership rates in each community. In the main report, the data was analyzed, and despite the wide variations in the sample communities, a number of patterns are evident in practically all of the NMA communities examined so far. These communities appear to tell a consistent housing story.
Building Foundations for the Future: Addendum 3
Population Data
Figure 1.1 Total Population Change
Building Foundations for the Future: Addendum 4
Figure 1.2 Median Age, 2016
Building Foundations for the Future: Addendum 5
Figure 1.3 Population Pyramids
Source: Statistics Canada. 1981 and 2016. Census Program.
9 8 7 6 5 4 3 2 1 0 1 2 3 4 5 6 7 8 9 0-4 5-9 10-14 15-19 20-24 25-29 30-34 35-39 40-44 45-49 50-54 55-59 60-64 65-69 70-7475+
Percentage of total population
Age grou p s
Fort St. John, BC 1981
Male Female 9 7 5 3 1 1 3 5 7 9 1 2 3 4 5 6 7 8 9 10 11 12 13 14 15 16Percentage of total population
Ag e G rou p s
Fort St. John, BC 2016
Male Female 9 8 7 6 5 4 3 2 1 0 1 2 3 4 5 6 7 8 9 0-4 5-9 10-14 15-19 20-24 25-29 30-34 35-39 40-44 45-49 50-54 55-59 60-64 65-69 70-7475+Percentage of total population
Age grou p s
Osoyoos, BC 1981
Male Female 9 7 5 3 1 1 3 5 7 9 0-4 5-9 10-14 15-19 20-24 25-29 30-34 35-39 40-44 45-49 50-54 55-59 60-64 65-69 70-7475+Percentage of total population
Age grou p s
Osoyoos, BC 2016
Male FemaleBuilding Foundations for the Future: Addendum 6
Figure 1.4 Average Number of Persons per Private Household
Building Foundations for the Future: Addendum 7
Housing Data
Figure 2.1 Period of Construction
Building Foundations for the Future: Addendum 8
Figure 2.2 Dwelling Condition, 2016
Source: Statistics Canada. 2016. Census Program. 75% 80% 85% 90% 95% 100% Perc en ta ge o f H o u sin g Sto ck
Building Foundations for the Future: Addendum 9
Figure 2.3 Major Repairs Needed by Tenancy, 2016
Building Foundations for the Future: Addendum 10
Figure 2.4 Single Detached Dwellings, 2016
Building Foundations for the Future: Addendum 11
Figure 2.5 Smaller Households vs. Smaller Dwellings, 2016
Building Foundations for the Future: Addendum 12
Figure 2.6 Larger Households vs. Larger Dwellings, 2016
Building Foundations for the Future: Addendum 13
Figure 2.7 Households Spending 30% + of their Income on Shelter Costs
Building Foundations for the Future: Addendum 14
Figure 2.8 Rental Affordability by Tenant Age, 2016
Building Foundations for the Future: Addendum 15
Figure 2.9 Average Value of Dwellings, 2016
Source: Statistics Canada. 2016. Census Program. $50,000 $100,000 $150,000 $200,000 $250,000 $300,000 $350,000 $400,000 $450,000
Building Foundations for the Future: Addendum 16
Figure 2.10 Home Ownership Rates, 2016
3333 University Way, Prince George, BC CANADA V2N 4Z9 Telephone: 1 (250) 960-5952 Email: [email protected]
www.unbc.ca/community-development-institute