Consumer experiences of
mobile phone calls
Report
Publication date:
12 August 2014
About this document
This document sets out information on the consumer experience of mobile voice calls. It presents data on the percentage of mobile calls that are successfully completed on each of the mobile operators’ networks. We have used data provided by the mobile operators and data from an independent mobile analytics firm, RootMetrics©.
One of Ofcom’s priority areas is to improve the quality of consumers’ mobile experience, and the data being published today is part of a broader programme of work aimed at improving the information available to consumers and policy makers.
The operator data is derived from their network management systems. The data does not allow for direct comparisons between each operator to be made. It does however provide a view of how overall performance in the UK has changed over recent years. The RootMetrics data is derived from test calls placed on each network in the second half of 2013: it shows how performance varies in different nations of the UK, in rural and urban areas, and allows for comparisons between each operator to be made.
Consumer research conducted by Ofcom earlier this year shows that mobile users in rural areas are less satisfied than their urban counterparts, and that these consumers experience problems with making phone calls more frequently. The call performance data from
RootMetrics supports these findings. The operator data indicates that there has not been a material degradation in quality over recent years across the UK as a whole.
Contents
Section
Page
1
Executive summary
1
2
Introduction
3
3
Consumer context
5
4
Call performance data
8
5
Future work in this area
15
Annex
Page
1
RootMetrics data in tabular format
16
2
Glossary
19
Section 1
1
Executive summary
1.1 Improving the quality of consumers’ mobile experience is a priority area for Ofcom. As the adoption of smartphones has risen, mobile services have become increasingly important to consumers. Ofcom is currently carrying out a programme of work that seeks to improve the overall experience for mobile services.
1.2 There are two broad drivers of mobile quality of experience:
• Coverage: the availability of the networks which deliver mobile services in different locations; and
• Quality of Service (QoS): the performance of the voice and data services that are delivered over mobile networks.
Consumer context
1.3 We conducted consumer research earlier this year to inform our work in this area. Whilst overall satisfaction levels with networks are high, in rural areas satisfaction levels are lower. Similarly, consumers experience problems making calls more frequently in rural areas than they do in urban areas.
Voice call performance
1.4 Today we are publishing information derived from two sets of data relating to the quality of voice calls:
• Mobile operator data: we have received data from the mobile network operators (MNOs) which shows how the proportion of calls which are successfully
completed has varied over time for each MNO. The data show that call
completion success rates (CCSRs) have been broadly stable over the past two years across each MNO’s network, and that all of the networks are reporting national average respective CCSRs between 97.9% and 99%.
• Third-party data: in order to allow us to take a more granular view of voice call performance and to compare operators, we acquired data from RootMetrics, an independent mobile analytics firm. This data, collected in the second half of 2013, also measured CCSRs and shows:
o overall CCSRs are between 93% and 97% nationally. The reason that these figures are lower than the MNO-reported data is likely to be driven by the fact that RootMetrics records call attempts in areas of no coverage and the operators’ data do not include these attempts; and
o CCSRs are lower in rural areas compared to urban areas: in the case of some operators there are rural areas where as many as one in five call attempts failed. The same pattern is observed in each of the Nations.
1.5 The MNOs have informed us that there are likely to be differences in the exact way each operator measures CCSRs. As a result, we have chosen not to make direct comparisons between the MNO supplied data in this report. To address this lack of
comparability, the MNOs have agreed to work with us to develop a common methodology for reporting CCSRs and/or quantify any systematic differences
between individual MNO methodologies. We hope to include this comparative data in future reports.
1.6 The performance variations in different parts of the UK identified in this report
highlights the need to undertake analysis at a granular level as national averages can mask regional differences.
Our other work in this area
1.7 In 2013 Ofcom required Three, O2, Vodafone and EE to ensure that their 3G networks served at least 90% of the population, an increase from the previous obligation of 80%. All the operators have now met this requirement.1
1.8 Ofcom released radio spectrum in 2013 that has enabled the MNOs to deploy 4G networks. This included spectrum in the 800MHz band which is well suited to providing coverage in rural areas. Under the terms of their spectrum licence one operator, O2, is required to provide indoor, at home 4G coverage to at least 98% of the population by the end of 2017. Based on their public announcements, we expect all the MNOs to achieve similar levels of coverage before the 2017 deadline.
1.9 In addition to rolling out 4G networks, the costs of operating some of the existing cell sites are being reduced through greater mast and equipment sharing. These cost efficiencies have the potential to improve network coverage, particularly in the more rural areas. We will continue to monitor developments in this area by gathering coverage data from the MNOs, third parties and by commissioning our own research. 1.10 Later this year, we will be publishing a report on 3G and 4G mobile broadband
speeds and performance based on measurements undertaken by Ofcom in five UK cities during 2014.
1.11 The government is spending £150m on mobile infrastructure to serve premises and a number of main roads which are in mobile ‘not-spots’, having no mobile coverage at all. We will continue to provide support relating to the planning of this initiative. 1.12 We are also supporting a joint Department for Transport/Network Rail initiative to
improve coverage on the UK’s rail network. We will continue to provide technical advice for this project.
1.13 The availability of comparable information on network coverage and quality of voice and data services will help inform public policy, assist consumers in making informed purchasing decisions, promote competition and encourage network investment. With these aims in mind, we will continue to monitor improvements in network coverage and quality and explore how best to make this information more accessible to consumers.
1
http://media.ofcom.org.uk/2014/01/31/3g-mobile-coverage-requirements-now-met/
Section 2
2
Introduction
2.1 Mobile services are important to consumers as they rely increasingly on mobile devices for a growing range of functions. Mobile devices are used by consumers to communicate from a range of locations, including inside the home, using voice, SMS and data services. Consumers can only derive the most out of their service if it works effectively. We know that this is not always the case, and that some consumers may have a poor experience when it comes to using their mobile services owing to coverage or network-related issues.
Mobile Quality of Experience
2.2 We use the term Quality of Experience (QoE) to describe the overall technical performance of mobile services.2 The primary drivers for QoE are:
•Coverage: the availability of the networks which deliver mobile services in different locations; and
•Quality of service (QoS): the performance of the voice and data services that are delivered over mobile networks.
2.3 While we categorise coverage and QoS separately under QoE, in reality the two are often related. For example, a consumer may experience a dropped call when they move into an area of poor coverage. Mobile coverage is a pre-requisite of achieving an acceptable QoS.
2.4 We recognise that some aspects of QoE are not under the full control of the MNO. Choice of handset and exact location of use3 can be contributing factors. We will be undertaking further work to better understand the role of these external factors on the overall QoE.
2.5 This report focusses on the QoE of voice calls made on mobile phones. We plan to publish the results of our research into mobile broadband QoE later in the year.
Mobile voice QoE data
2.6 To better understand the current QoE of mobile voice services in the UK, we have gathered data from the MNOs and RootMetrics, a company that specialises in mobile analytics.
2.7 In January 2014 Ofcom gathered dropped and blocked call data from O2, EE, Three and Vodafone relating to performance over the past two years to determine how QoS has varied over this period.4 The aggregated findings are set out in Section 4.
2
For the purposes of this report we have not considered other aspects of the service, such as customer support and billing.
3
Issues can arise regarding the propagation of mobile signals into some buildings or vehicles. 4
Other common ways to measure the QoE of a voice service is to report on the time it takes for a call to connect or the sound quality during the call.
2.8 From a consumer perspective ‘blocked calls’ are those call attempts that do not get connected through to the called party. A MNO may block a call if there is insufficient capacity on the network in that locality due to heavy demand. If, once connected, a call terminates unexpectedly then this is termed a ‘dropped call’. Dropped calls can occur for a number of reasons including moving into an area with poor or no mobile signal.
2.9 In this report we have focussed on blocked and dropped calls, combining them to give an overall view of ‘call completion success rate’ (CCSR).
2.10 The data is collected from the MNO network management systems and represents all calls that are made on the network. However there are some limitations to this data.
• The MNOs network derived data does not include those call attempts made by users in areas with no coverage. Therefore the reported statistics may tend to under reflect the true number of issues consumers’ experience.
• The data we requested provides a national picture for the MNOs, and therefore does not allow us to analyse regional performance or draw comparisons between rural and urban network performance.
• The MNO data is informative in showing the trend in each respective MNO’s performance over the past two years. However, we cannot make comparisons between operators with confidence due to differences in the way the data is generated from each MNOs network systems.
2.11 To address these limitations, we have looked into a third party data source. We have used data from RootMetrics, which produces independent reports on the overall quality of the mobile experience from a consumer’s point of view. RootMetrics
measures QoE by making test calls using consumer handsets in different parts of the UK and measures how many calls complete successfully.
2.12 As well as allowing us to look at performance at a more granular geographic level, the RootMetrics data has the benefit of being measured from the point of view of the user. As such, it reflects the more complete consumer experience which may be affected by factors other than network performance, for example the handset or the how or where it is being used. The RootMetrics measure of CCSR also includes call failures where no coverage is available.
2.13 One difference between the RootMetrics approach and that of the MNOs is that RootMetrics data is based on a sampling approach in which the company deploys individual testers conducting tests (call, mobile internet and text) from consumer handsets on the networks. In contrast, the MNO data reflects all calls made by consumers in areas with network coverage. RootMetrics uses statistical analysis to show 95 per cent confidence levels for each metric. Generally, where the confidence interval ‘bars’ on the charts in this report overlap, there is no statistical difference between the MNOs.
Section 3
3
Consumer context
3.1 In March 2014, we commissioned quantitative research to assess the role of mobile network coverage and quality in consumers’ experiences and decisions. We will be publishing this research in full in the coming months, but we are including extracts of this research in this document to give context to our work in this area.
3.2 Despite an increase in the take-up of smartphones and greater use of data, voice services are still important to consumers. Our research revealed that 99% of mobile phone owners still use their handsets to make phone calls.
Satisfaction
3.3 Levels of overall network satisfaction are high, with the majority (76%) of UK consumers saying that they are ‘fairly’ or ‘very’ satisfied with their mobile network. However, as figure 1 demonstrates, the proportion of consumers reporting high levels of satisfaction falls in rural and remote rural areas, with a corresponding increase in the proportion that are neither satisfied or dissatisfied
Figure 1: Overall network satisfaction – UK, urban, rural and remote rural
Source: Ipsos MORI, Ofcom Mobile Network Coverage Research, March 2014.
Unweighted base: all respondents (n=1,5095), weighted data.
Q21. Overall, how satisfied are you with your network?
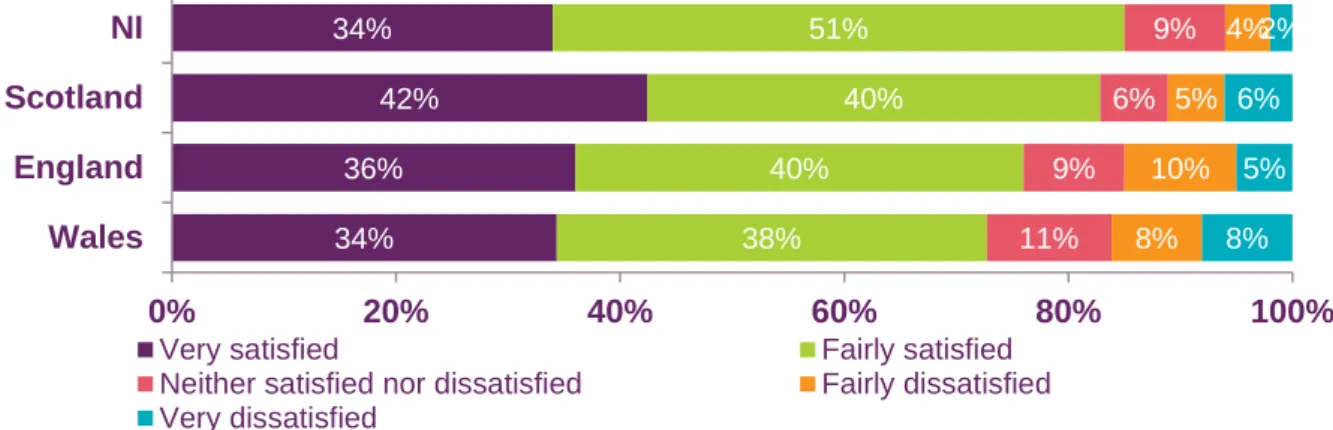
3.4 There are also some noticeable differences when looking at each UK Nation, with consumers in Northern Ireland being more satisfied with their operator (85% reported ‘very satisfied’ or ‘fairly satisfied’) than those in the other Nations (82% of consumers in Scotland, 76% in England and 72% in Wales).
5
n is the number of respondents to the question 28% 26% 38% 36% 42% 41% 40% 40% 15% 17% 8% 9% 9% 12% 9% 9% 7% 4% 6% 5% 0% 20% 40% 60% 80% 100% Remote Rural Urban Total
Very satisfied Fairly satisfied Neither satisfied nor dissatisfied Fairly dissatisfied Very dissatisfied
Figure 2: Overall network satisfaction by Nation
Source: Ipsos MORI, Ofcom Mobile Network Coverage Research, March 2014. Unweighted base: all respondents (n=1,509), NI (n=194), Scotland (n=216), England (n=877), Wales (n=222), weighted data. Q21. Overall, how satisfied are you with your network?
3.5 Participants were asked how often they experience particular issues with their mobile service. Thirty per cent of UK consumers experience having no signal or reception at least once per week, and this rises to 43% and 47% in rural and remote rural areas respectively. Furthermore, a lack of signal or reception is a part of daily life for 28% of mobile users in remote rural areas. This is more common than in rural (17% experience it daily) or urban areas (11%).
Figure 3: Frequency of having no signal or reception
Source: Ipsos MORI, Ofcom Mobile Network Coverage Research, March 2014. Unweighted base: all respondents (n=1,509), weighted data.
Q43 How often, if at all, have you experienced any of the following when using your main mobile phone? 34% 36% 42% 34% 38% 40% 40% 51% 11% 9% 6% 9% 8% 10% 5% 4% 8% 5% 6% 2% 0% 20% 40% 60% 80% 100% Wales England Scotland NI
Very satisfied Fairly satisfied Neither satisfied nor dissatisfied Fairly dissatisfied Very dissatisfied 28% 17% 11% 12% 11% 19% 10% 11% 8% 7% 7% 7% 17% 13% 13% 13% 24% 27% 38% 36% 12% 15% 20% 19% 0% 20% 40% 60% 80% 100% Remote rural Rural Urban Total
Every day A few times a week Once a week A few times a month Hardly ever Never
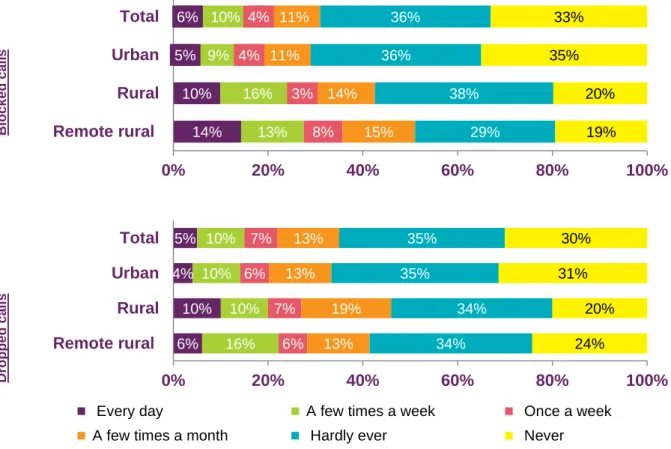
3.6 Looking specifically at voice services, participants were also asked how frequently they experienced issues such as blocked calls (being unable to make or connect a call even though the phone shows signal) and dropped calls (calls ending
unexpectedly).As shown in Figure 4, around a fifth of all UK consumers experience each of these voice issues at least once per week, and again consumers in rural and remote rural locations are more likely to experience these problems compared to urban users. Blocked calls appear to be a particular issue for those in remote rural areas, where over a third of consumers experience this problem at least once per week.
3.7
While the survey asked consumers to consider the frequency of experiencing no signal and call blocking separately, it is possible that some of those surveyed were unable to differentiate between them. As such, differences in consumers’experiences of blocked calls (with signal) and experiences of no signal should be treated with some caution.
Figure 4: Frequency of experiencing issues with voice services - UK, urban, rural and remote rural
Source: Ipsos MORI, Ofcom Mobile Network Coverage Research, March 2014.
Unweighted base: all respondents (n=1,509), (urban n = 1,033, rural n= 366, remote rural n=110), weighted data.
Q43 How often, if at all, have you experienced any of the following when using your main mobile phone? B lo cked cal ls D ro p p e d c a ll s 14% 10% 5% 6% 13% 16% 9% 10% 8% 3% 4% 4% 15% 14% 11% 11% 29% 38% 36% 36% 19% 20% 35% 33% 0% 20% 40% 60% 80% 100% Remote rural Rural Urban Total 6% 10% 4% 5% 16% 10% 10% 10% 6% 7% 6% 7% 13% 19% 13% 13% 34% 34% 35% 35% 24% 20% 31% 30% 0% 20% 40% 60% 80% 100% Remote rural Rural Urban Total
Every day A few times a week Once a week A few times a month Hardly ever Never
Section 4
4
Call performance data
4.1 To allow us to better understand consumers’ experiences of mobile voice services in the UK we have collected data from Mobile Network Operators (MNOs) and
RootMetrics.
The MNO data
4.2 In December 2013 Ofcom requested data on blocked and dropped call performance from the four major MNOs in the UK (EE, O2, Three and Vodafone). The data was supplied in January 2014. The data period over which data was supplied varied between the operators, ranging from two years to three and a half years.
4.3 The data we received was provided in the form of blocked and dropped call rates, which were combined to produce call completion success rates (CCSR). This
measure shows the percentage of calls which are not affected by dropped or blocked calls.
4.4 The data is derived from the MNO network management systems. During the process of setting up and terminating a call, a number of control messages are sent between the handset and the network. By recording which messages are sent, the MNOs are able to determine whether the call is successful and, when a call fails, at what stage in the call this occurs. The MNOs collect data on every call attempt, and as such the data provides a very complete view of network performance
measurements.
4.5 While the layman’s definition of a blocked and dropped call may be relatively straight forward, the exact way in which the MNOs define the metrics does vary. The MNOs have informed us that even achieving consistency of measurement across their own network can be complicated when different equipment vendors are used in different areas. For this reason we do not believe that we can reliably compare the data provided by each operator and have therefore anonymised and aggregated the MNO data presented in this report. However, the MNOs have agreed to work with Ofcom to develop a methodology to allow comparisons to be made. We hope to include these comparisons in future reports.
4.6 In addition to the issues of comparability, the data provided by the MNOs is gathered from their network infrastructure and management systems. It therefore measures connectivity from the networks’ point of view and does not account for call attempts from subscribers who are outside of network coverage. As such, if the network is unavailable due to a network outage or limited coverage, call attempts by a
subscriber would not necessarily be picked up by the network and might not appear in the data. As a result, the figures reported by the MNOs are likely to underestimate the number of failed call attempts experienced by consumers.
4.7 Despite its limitations, the network derived data supplied by the MNOs provides a useful overview of the performance of their networks, particularly in establishing a time series.
4.8 The maximum performance reported for a single month by any MNO was 98.9% in April 2013. One MNO reported a success rate of just 94.2% for a single month in the
summer of 2012. However, other than this one off incident which was associated with a network fault, the lowest reported success rate was 97.7%.
4.9 Looking across the whole reporting period, the average of the monthly CCSRs reported by the individual operators ranged from 97.9% to 98.6%.
4.10 The data does not indicate any long term degradation in call performance. One MNO did report a period of slightly reduced performance in the Summer of 2013, but this was resolved by the end of the year. Another MNO reported steady improvements, with call failures reducing by around 0.5% percentage points over a three and a half year period.
4.11 The MNO data provides an overall view of performance across the UK. However, we know from our consumer research that QoE is perceived to be a bigger problem in more rural areas, and that this could be masked by the UK averages. We have therefore considered alternative data sources to better understand the variations in CCSRs across the UK.
Data from RootMetrics
4.12 To help understand the experience of mobile voice services in different parts of the UK and to allow comparative performance to be assessed, Ofcom sought alternative data sources.
4.13 RootMetrics published a report in March 2014 which compared network performance across the UK, based on data it had collected in the second half of 2013. Following publication of this report, Ofcom approached RootMetrics to gain access to its CCSR results.
4.14 The RootMetrics methodology involves measuring network performance in a variety of locations across the UK by testing from the consumer’s point of view, using handsets as opposed to measuring from the network’s perspective.6
4.15 The RootMetrics methodology has some advantages over the MNO supplied data:
• the same tests are run on all networks, meaning results are comparable between the MNOs;
• the methodology identifies call failures that result from a lack of coverage; and
• test calls are placed to the same fixed number. This means that the destination network is not a variable (as is the case with the MNO data) which enhances the reliability of the data for use in operator comparisons.
4.16 While there are benefits, the RootMetrics methodology has some limitations when compared to the MNO data:
• The RootMetrics methodology is designed to measure mobile performance as experienced by the consumer. Calls are placed at locations indoors and
outdoors and when driving. However, the mix of call locations and use cases may not be representative of the behaviour of real consumers on each network and
6
Refer to RootMetrics website for more detail about RootMetrics’ methodology:
http://www.rootmetrics.com/uk/methodology
calls attempts may be made in areas where a MNO may not claim to have coverage.
• RootMetrics does not currently report on the success rate of incoming calls (all test calls are outbound). The MNO data reflects both inbound and outbound calls.
• RootMetrics uses a statistical sampling approach to determine where, and how many, test samples it performs. This means that the data is a statistical
representation of the consumer experience and is subject to the accuracy
associated with statistical sampling. This accuracy is shown in the charts below – the ranges indicated on each bar show the 95% confidence range for the
measurements, i.e. there is a 95% probability the actual value associated with each metric lies within the range shown. Generally, where confidence intervals overlap then the difference between metrics is not statistically significant and no conclusions can be drawn on relative performance.
4.17 In the study, RootMetrics measured the percentage of calls which complete successfully (CCSR) for both rural and urban locations within the four UK nations. Details of how RootMetrics categorise urban and rural are provided in Annex 3. Some tests were conducted on stretches of roads which fall outside the rural and urban categorisations. These ‘other’ measurements have been included in the overall nation / country category in the charts below but are not presented separately. 4.18 The RootMetrics data for the UK as a whole (Figure 9) shows lower CCSRs than the
data provided by the MNOs. The RootMetrics estimates range from 93% for
Vodafone to 97% for EE, whereas the monthly CCSRs reported by the MNOs for the UK were typically 97.7% or above across the reporting period. In part this is likely to reflect the impact of RootMetrics ability to identify call failures due to lack of
coverage. The MNOs are unable to record these call attempts on their network systems, although they have informed us that they do gather data on coverage gaps by undertaking their own measurement campaigns and monitoring feedback from consumers.
Figure 9: RootMetrics 2G & 3G CCSR data for UK
Source: RootMetrics second half of 2013
97.0 95.3 94.5 92.6 93.7 87.4 86.0 79.9 97.5 97.7 96.0 95.3 0% 20% 40% 60% 80% 100% EE O2 Three Vodafone CCS R MNO
RootMetrics 2G & 3G CCSR data for the UK
4.19 Figures 10, 11, 12 and 13 show the performance of the MNOs in each of the UK nations. The data highlights some significant variations in rural and urban areas and between operators.
Figure 10: RootMetrics 2G & 3G CCSR data for England
Source: RootMetrics second half of 2013
Figure 11: RootMetrics 2G & 3G CCSR data for Scotland
Source: RootMetrics second half of 2013
96.7 94.7 93.2 91.0 93.4 87.9 85.0 78.0 97.4 97.8 95.8 95.1 0% 20% 40% 60% 80% 100% EE O2 Three Vodafone CCS R MNO
RootMetrics 2G & 3G CCSR data for England
England Rural Urban
96.3 94.1 94.3 91.6 96.1 90.6 93.6 84.7 97.9 97.4 96.0 96.0 0% 20% 40% 60% 80% 100% EE O2 Three Vodafone CCS R MNO
RootMetrics 2G & 3G CCSR data for Scotland
Figure 12: RootMetrics 2G & 3G CCSR data for Wales
Source: RootMetrics second half of 2013
Figure 13: RootMetrics 2G & 3G CCSR data for Northern Ireland
Source: RootMetrics second half of 2013
4.20 The RootMetrics data appears to support our own consumer research which shows that consumers in more rural areas are experiencing more problems making calls. 4.21 It is notable that all the operators perform at their best in Northern Ireland. This is the
nation that our consumer research identified as having the highest overall levels of satisfaction with the mobile networks.
4.22 There is lower performance from Vodafone in rural England and O2 in rural Wales, with over one in five call attempts failing.
4.23 The RootMetrics and the MNO data highlights the importance of measuring CCSR at a more granular level than the UK as a whole; the need to differentiate between rural
96.0 89.7 94.0 92.5 93.6 77.6 88.8 91.3 98.5 96.5 97.8 95.3 0% 20% 40% 60% 80% 100% EE O2 Three Vodafone CCS R MNO
RootMetrics 2G & 3G CCSR data for Wales
Wales Rural Urban
97.5 97.3 96.9 98.4 96.6 94.8 92.1 94.3 99.2 98.3 98.5 97.9 0% 20% 40% 60% 80% 100% EE O2 Three Vodafone CCS R MNO
RootMetrics 2G & 3G CCSR data for Northern Ireland
and urban areas; and the need to consider MNOs’ network coverage, as well as their own network derived CCSR statistics, when considering overall mobile voice
experience.
4.24 Some of the MNOs requested clarification about certain aspects of the RootMetrics methodology. RootMetrics provided written responses. In summary, RootMetrics explained that:
• Device Choice: Tests were performed using the Samsung Galaxy S® III for EE, Vodafone and Three, and the Sony Xperia™ Z for O2. Prior to conducting field testing, RootMetrics conducted its own internal testing to select the best phone model commercially available from each operator, to characterise operators’ networks from a consumer experience. It selected the handsets directly from operator stores, and tested them across a range of services (voice, text, data) used in different use cases (indoor, outdoor and while driving) and in multiple geographic locations.
• Scale of testing: Testing was conducted on 114 different days. Over 35,000 km of roads and motorways in, around, and between large cites and small villages were driven and tested. Tests were also performed in more than 1,000 different indoor locations. In all, more than 28,000 calls were placed on each MNO’s network.
• Device positioning: The operator-specific test devices were mounted in a portfolio case, such that they were evenly distributed and unlikely to results in any significant impact on radio performance. Mobile networks and devices are specifically built and regulated to minimise both the production of “electromagnetic noise”, as well as the effects of this from other sources. RootMetrics’ investigations have never identified a significant impact on network performance due to device positioning, and they do not expect to find any.
• Sample weighting: The numbers of test calls made in different parts of the UK are weighted to ensure the final results are reflective of population distributions. Due to the larger number of sample points available for the UK as a whole, different weightings are applied when creating the UK metrics compared to the individual nations. As a result direct comparisons cannot be made between the results for individual nations and the UK as a whole.7
Other data sources
4.25 We are not currently aware of any other available data source that has been
collected independently of the MNOs which provides a sufficiently accurate picture of voice call success for each nation and in rural and urban areas.
4.26 One MNO did share data collected by a drive test company that it commissioned as part of its ongoing work to benchmark its service against the other MNOs. This data, which was primarily collected in urban locations during November 2013, indicated CCSRs ranging between 94.9% and 95.8% across the MNOs and the relative
7
This is a recognised practice in statistical analysis. Ofcom uses a similar approach in its regular reports on fixed broadband speeds.
ranking of the MNOs in these tests differed from those reported by RootMetrics for urban areas of the UK. However, direct comparisons cannot be made between the two data sources because the MNO commissioned tests were not designed to be representative of all urban areas in the UK and no 95% confidence intervals were provided. It was therefore not possible to draw any conclusions on the significance of the differences measured between the MNOs.
4.27 Our experience of measuring fixed and mobile broadband in the past has shown us that there is rarely a single, definitive way of measuring the performance of telecoms services. In future, we will continue to draw on the best available data sources as part of our monitoring of network coverage and performance.
Section 5
5
Future work in this area
5.1 The data presented in this report highlights the complexity of accurately measuring mobile QoE. We are currently engaged in a range of work which will help improve the information available in this area:
• we will work with the MNOs to develop a common methodology for measuring CCSR across the networks to allow comparisons to be made with a view to publication. If a single, common methodology cannot be found we will endeavour to quantify the size of systematic differences between MNOs’ individual
methodologies;
• in relation to 3G and 4G mobile broadband, this autumn, Ofcom will publish results of field measurement made in five UK cities. This report will highlight how the performance of 4G networks compares to 3G networks; and
• we will continue to work with the MNOs and third parties to improve the information available to consumers on mobile voice and data QoE. We will continue to draw on the best available data, whether supplied by the MNOs, third parties or research commissioned directly by Ofcom.
5.2 In addition to the improvements in information provided to consumers, we will also continue to support the improvement of mobile coverage through a number of initiatives:
• ensuring the fulfilment of the 4G coverage obligation which will provide 4G indoor coverage to at least 98% of the UK by 2017. This obligation only applies to O2 but the other mobile operators have publicly stated they intend on delivering similar levels of coverage;
• the government is spending £150m on mobile infrastructure to serve premises and a number of main roads which are in mobile ‘not-spots’, having no mobile
coverage at all. We will continue to provide support relating to the planning of this initiative; and
• we are also supporting a joint Department for Transport/Network Rail initiative to improve coverage on the UK’s rail network. We will continue to provide technical advice for this project.
Annex 1
1
RootMetrics data in tabular format
Data for UK
MNO Area CCSR Lower bound Upper bound
EE UK 97.0% 96.7% 97.2% EE Rural 93.7% 92.8% 94.6% EE Urban 97.5% 96.9% 98.0% O2 UK 95.3% 95.0% 95.7% O2 Rural 87.4% 86.3% 88.6% O2 Urban 97.7% 97.2% 98.1% Three UK 94.5% 94.2% 94.9% Three Rural 86.0% 84.7% 87.2% Three Urban 96.0% 95.3% 96.6% Vodafone UK 92.6% 92.1% 93.0% Vodafone Rural 79.9% 78.5% 81.4% Vodafone Urban 95.3% 94.6% 95.9%
Data for England
MNO Area CCSR Lower bound Upper bound
EE England 96.7% 96.3% 97.0% EE Rural 93.4% 92.3% 94.4% EE Urban 97.4% 96.7% 98.0% O2 England 94.7% 94.2% 95.1% O2 Rural 87.9% 86.5% 89.2% O2 Urban 97.8% 97.2% 98.3% Three England 93.2% 92.7% 93.7%
Three Rural 85.0% 83.5% 86.4%
Three Urban 95.8% 95.1% 96.6%
Vodafone England 91.0% 90.4% 91.6% Vodafone Rural 78.0% 76.3% 79.7% Vodafone Urban 95.1% 94.3% 95.9%
Data for Northern Ireland
MNO Area CCSR Lower bound Upper bound EE Northern Ireland 97.5% 96.6% 98.3% EE Rural 97.3% 93.8% 99.0% EE Urban 99.2% 98.7% 99.6% O2 Northern Ireland 96.9% 96.0% 97.8% O2 Rural 98.4% 95.2% 99.7% O2 Urban 98.3% 97.0% 99.2%
Three Northern Ireland 96.6% 95.5% 97.6%
Three Rural 92.1% 87.4% 95.3%
Three Urban 98.5% 97.5% 99.3%
Vodafone Northern Ireland 94.8% 93.5% 96.0% Vodafone Rural 94.3% 90.0% 96.9% Vodafone Urban 97.9% 97.2% 98.6%
Data for Scotland
MNO Area CCSR Lower bound Upper bound
EE Scotland 96.3% 95.5% 97.0%
EE Rural 96.1% 92.7% 98.1%
O2 Scotland 94.1% 93.1% 95.1% O2 Rural 90.6% 86.1% 93.7% O2 Urban 97.4% 96.3% 98.3% Three Scotland 94.3% 93.4% 95.3% Three Rural 93.6% 89.7% 96.2% Three Urban 96.0% 94.2% 97.5% Vodafone Scotland 91.6% 90.3% 92.7% Vodafone Rural 84.7% 79.6% 88.8% Vodafone Urban 96.0% 94.4% 97.2%
Data for Wales
MNO Area CCSR Lower bound Upper bound
EE Wales 96.0% 95.0% 97.0 EE Rural 93.6% 90.4% 95.8% EE Urban 98.5% 97.8% 99.1% O2 Wales 89.7% 88.3% 91.1% O2 Rural 77.6% 73.0% 81.7% O2 Urban 96.5% 94.1% 98.1% Three Wales 94.0% 92.8% 95.1% Three Rural 88.8% 85.0% 91.7% Three Urban 97.8% 97.1% 98.5% Vodafone Wales 92.5% 93.7% 91.3% Vodafone Rural 91.3% 87.8% 93.9% Vodafone Urban 95.3% 93.0% 97.1%
Annex 2
2
Glossary
2G Second generation of mobile telephony systems. Uses digital transmission to support voice, low-speed data communications, and short messaging services.
3G Third generation of mobile systems. Provides high-speed data transmission and supports multimedia applications such as full-motion video, video-conferencing and internet access, alongside conventional voice services.
4G The fourth generation of mobile phone mobile communication technology standards, which provides faster mobile data speeds than the 3G standards that it succeeds.
Blocked calls Call attempts that do not get connected through to the called party. When reported by the MNOs, call attempts made in areas of no coverage are not recorded. Call completion success rates (CCSRs) Blocked and dropped calls combined to give a figure which is the percentage of calls which are successfully completed i.e. connect and do not end unexpectedly.
Coverage The availability of the networks which deliver mobile services. Dropped calls Connected calls which terminate unexpectedly.
MNO (Mobile Network Operator) a provider which owns a cellular mobile network. Quality of Experience (QoE): the overall technical performance of mobile services.8
Quality of Service (QoS): the performance of the voice and data services that are delivered over mobile networks.
8
For the purposes of this report we have not considered other aspects of the service, such as customer support and billing.
Annex 3
3
Definitions of “Urban” and “Rural”
Definitions used for the consumer research presented in section 3
Rural Sampling points defined as villages with populations between 500 and 2,000 and areas that have populations less than 500 (hamlets, open countryside and town fringes) and no more than 10 miles from a large urban areas.Remote Rural Sampling points defined as villages with populations between 500 and 2,000 and areas that have populations less than 500 (hamlets and open countryside) and are more than 10 miles from a large urban areas.
Urban Sampling points defined as:
• Large cities that have populations greater than 500,000 (London, Birmingham, Glasgow and Manchester);
• Smaller cities or large towns that have populations between 100,000 and 500,000 (e.g. Reading, Bolton, York, Edinburgh, or Wolverhampton);
• Medium towns that have populations between 15,000 and 100,000 (e.g. Rochdale, Worthing, or Antrim in Northern Ireland);
• Small towns that have populations between 2,000 and 15,000 and are no more than 10 miles from one of the large urban areas defined above (e.g. Cobham, Selsey or Bodmin); and
• Small towns that have populations between 2,000 and 15,000 and are more than 10 miles from one of the large areas defined in the groups above (e.g. Southwold in Suffolk, Whitby in North Yorkshire and Minehead in Somerset). Towns in this group are mainly isolated urban centres for remote rural areas.
Definitions used for by RootMetrics
Rural England and WalesBuilt-up Areas with population <= 10,000
Source: https://www.gov.uk/government/collections/rural-urban-definition Northern Ireland
Settlements with population < 4500 and outside the Belfast or Derry Urban Areas
Source: http://www.nisra.gov.uk/archive/geography/digital_products/urban _rual_classifications/ur_report.pdf
Settlements with population < 3000
Source: http://www.scotland.gov.uk/Topics/Statistics/About/Methodology/ UrbanRuralClassification
Urban England and Wales
Built-up Areas with population > 10,000
Source: https://www.gov.uk/government/collections/rural-urban-definition Northern Ireland
Settlements with population >= 4500 or inside the Belfast or Derry Urban Areas
Source: http://www.nisra.gov.uk/archive/geography/digital_products/urban _rual_classifications/ur_report.pdf
Scotland
Settlements with population >= 3000
Source: http://www.scotland.gov.uk/Topics/Statistics/About/Methodology/ UrbanRuralClassification