Single-cell virology: on-chip investigation of viral infection
dynamics
Feng Guo1,5, Sixing Li2,5, Mehmet Umut Caglar3, Zhangming Mao1, Wu Liu4, Andrew
Woodman4, Jamie J. Arnold4, Claus O. Wilke3, Tony Jun Huang1,2,6, and Craig E. Cameron2,4,7
1Department of Engineering Science and Mechanics, The Pennsylvania State University,
University Park, PA 16802 USA
2Molecular Cellular and Integrative Biosciences Graduate Program, The Huck Institutes of the Life
Sciences, The Pennsylvania State University, University Park, PA 16802 USA
3Center for Computational Biology and Bioinformatics, Institute for Cellular and Molecular Biology,
and Department of Integrative Biology, The University of Texas at Austin, Austin TX 78712 USA
4Department of Biochemistry and Molecular Biology, The Pennsylvania State University,
University Park, PA 16802 USA
Abstract
We have developed a high-throughput, microfluidics-based platform to perform kinetic analysis of viral infections in individual cells. We have analyzed thousands of individual poliovirus infections while varying experimental parameters, including multiplicity of infection, cell cycle, viral genotype and presence of a drug. We make several unexpected observations masked by
population-based experiments: (1) viral and cellular factors contribute uniquely and independently to viral infection kinetics; (2) cellular factors cause wide variation in replication-start times; (3) infections frequently begin later and replication occurs faster than predicted by population measurements. We show that mutational load impairs interaction of the viral population with the host, delaying replication start times and explaining the attenuated phenotype of a mutator virus. We show that an antiviral drug can selectively extinguish the most-fit members of the viral population. Single-cell virology facilitates discovery and characterization of virulence determinants and elucidation of mechanisms of drug action eluded by population methods.
Address correspondence to: CEC ([email protected]; @CameronLabPSU) or TJH ([email protected]). 5These authors contributed equally to this study.
6Current address: Department of Mechanical Engineering & Materials Science, Duke University, Durham, NC 27708 USA 7Lead Contact
AUTHOR CONTRIBUTIONS
F.G. conceived the idea for the microfluidics platform used in the study. F.G., S.X.L, T.J.H and C.E.C. designed the project. F.G., S.X.L, Z.M.M, W.L., and A.W. conducted experiments, data acquisition, and/or created reagents for the study. M.U.C. and C.O.W. created and implemented the data-analysis pipeline. F.G., S.X.L, J.J.A., C.O.W., T.J.H. and C.E.C. analyzed the data. F.G., S.X.L, J.J.A., C.O.W., T.J.H. and C.E.C. wrote the manuscript.
Publisher's Disclaimer: This is a PDF file of an unedited manuscript that has been accepted for publication. As a service to our
HHS Public Access
Author manuscript
Cell Rep
. Author manuscript; available in PMC 2017 November 16.Published in final edited form as:
Cell Rep. 2017 November 07; 21(6): 1692–1704. doi:10.1016/j.celrep.2017.10.051.
A
uthor Man
uscr
ipt
A
uthor Man
uscr
ipt
A
uthor Man
uscr
ipt
A
uthor Man
uscr
eTOC Blurb
Guo et al. use a microfluidics device installed on a fluorescence microscope to monitor the kinetics of viral infection in single cells. Between-cell variation in outcomes of infection exist at all phases of the lifecycle. Cellular gene expression governs the eclipse phase; viral genetics govern replication rate and yield.
RNA viruses exist as a population of genetically distinct variants, often termed a
quasispecies (Domingo and Holland, 1997; Lauring and Andino, 2010). Productive infection of a cell by these viruses requires a multitude of suitable cellular conditions, including a cellular protein to serve as a receptor, amino acid and nucleotide precursors for synthesis of viral proteins and replication of viral nucleic acids, and myriad cellular factors to permit virus multiplication. The extent to which a cellular gene required for infection is expressed or whether and how a cell responds to infection is stochastic (Battich et al., 2015; Domingo and Holland, 1997; Lauring and Andino, 2010; Pelkmans, 2012; Snijder and Pelkmans, 2011). This circumstance creates a population of phenotypically distinct cells in culture. The genetic variation of the RNA virus population and stochastic gene expression of the cell predict between-cell variability for the outcome of an infection in each cell of a population. In fact, between-cell variability in the kinetics of release of poliovirus (PV) from infected cells was demonstrated decades ago (Lwoff et al., 1955).
Characterization of viral infections in cell culture continues to rely on the measurement of the concentrations of infectious virus using plaque assays and/or evaluation of the kinetics of infectious virus production using one-step growth analysis. These time-honored methods in molecular virology are population methods that preclude the observation of between-cell variability. Consider the scenario in which 10% of infected cells produce 50% of viral progeny because only 10% of cells express the full complement of host factors required for robust replication. This circumstance would complicate interpretation of mutations in viral genes, reduced or ablated host factor gene expression, or even drug treatment because only a
A
uthor Man
uscr
ipt
A
uthor Man
uscr
ipt
A
uthor Man
uscr
ipt
A
uthor Man
uscr
two-fold reduction to infection outcome would be observed at the population level if all of the highest- yielding infections were eliminated.
Single-cell analysis of viral infections would not suffer this complication. Indeed, studying viral infections on the single-cell level should enhance our understanding of viral mutant phenotypes, virus-host interactions, and/or antiviral therapeutic mechanisms. Previous studies of viral infection on the single-cell level have been limited in the number of cells monitored, restricted to high multiplicities of infection, unable to distinguish primary from secondary infections, and/or unable to monitor a complete time course of infection (Akpinar et al., 2016; Heldt et al., 2015; Schulte and Andino, 2014; Thompson and Yin, 2010; Warrick et al., 2016).
Here, we used poliovirus infection to determine the extent to which studies on the single-cell level advance our understanding of virus biology beyond those performed on the population level. To detect and characterize between-cell variation in the kinetics of virus replication, we have assembled a multi-layer, pneumatically-controlled, microfluidic cell-culture system with live-cell imaging. Our single-cell approach illuminated the shortcomings of population averaging on detection of the substantial variation in the observed ranges for the duration of the eclipse phase, replication speed and virus yields. A most unexpected observation was that as many as one-third of infections do not induce cell lysis, even after 24 h. We showed that both the virus and the cell cause between-cell variation and were able to construct a data-analysis pipeline capable of assigning the contributions of each to specific steps of the lifecycle. Using this pipeline, we showed that a PV mutant with perturbed quasispecies exhibited the greatest defect at a cell-dependent step of the lifecycle required to establish infection. Finally, we showed that an antiviral agent could target a specific subset of infected cells, rather than targeting the entire population in a uniform manner. We conclude that single-cell virology represents a powerful addition to the molecular-virology toolbox.
RESULTS
Biological system
The studies reported herein used a model RNA virus, poliovirus (PV), encoding the enhanced green fluorescence protein (referred to throughout as GFP-PV, Fig. 1A). We used GFP-PV to infect HeLa S3 cells (Crotty et al., 2002). GFP fluorescence is a well-
established surrogate for replication of PV, as well as many other RNA viruses (Crotty et al., 2002). We did not observe GFP fluorescence in the presence of the replication inhibitor, guanidine hydrochloride (Fig. S1A). This observation suggests that we observe translation of replicated RNA but not virion-derived RNA at the multiplicities of infection (MOIs) used in our experiments. However, we may be below the limit of detection for the first round of translation, which is not known. We performed all infections using a population of cells in suspension, and we monitored infected cells using the methods described below. This approach permitted us to compare outcomes of the same infections using both population and single-cell methods (Fig. S1A).
A
uthor Man
uscr
ipt
A
uthor Man
uscr
ipt
A
uthor Man
uscr
ipt
A
uthor Man
uscr
Requirement for isolated wells to evaluate infections of single cells
Our initial experiments evaluated single cells in a monolayer after infection under conditions in which fewer than 10% of cells were infected. We used time-lapse imaging to monitor the change in GFP fluorescence. We observed the greatest number of GFP-positive cells at 12 hours post-infection (hpi) and longer (Fig. 1B and Video S1). The generation time of PV at high MOI is in the 6–8 h regime (Kallman et al., 1958). Therefore, this setup did not permit us to distinguish delayed onset of replication due to the low MOI from a second or third round of replication. An isolated-well format did not suffer from this ambiguity (Fig. 1C and Video S2). Both formats revealed between-cell differences in the kinetics of GFP-PV replication (Figs. 1D and 1E).
Microfluidic device design and use
To monitor infections of single cells of sufficient statistical power to reach meaningful conclusions, we fabricated a microfluidic device capable of observing as many as 6,400 intracellular events using fluorescence detection (Fig. S2A). We designed the device to accommodate as many as four independent experiments by engineering four separate sample inlets, with each inlet connected to 1,600 different wells (Figs. 2A and S2A). Once loaded, each well was isolated from the others by using the integrated pneumatic-control lines (Figs. 2A and S2A). We demonstrated the effectiveness of the pneumatic seal by showing that not all cells on chip could be infected, even when a lytic infection occurred in an adjacent well (Video S3). We installed the device on the stage of an inverted fluorescence microscope equipped for cell culture (Fig. S2B). We used a motorized stage to monitor changes in fluorescence over time automatically using time-lapse microscopy, with a snapshot taken every 30 min for 24–36 h (Figs. 2B and S2). We processed images using customized MATLAB and R codes to produce time courses for GFP fluorescence (Figs. 2B and S2).
Experimental design, data acquisition and data-analysis pipeline
Experiment—We infected HeLa S3 cells with GFP-PV at a MOI that guaranteed infection of most cells. Note that the unit of MOI used in our studies is genomes per cell instead of plaque-forming unit (pfu) per cell because of the variable nature of the genome:pfu ratio (Korboukh et al., 2014). On average, 1,000 GFP-PV genomes were required to establish a single plaque (Fig. S1B). We performed the infection off-chip, and diluted infected cells to a density that would maximize the number of wells containing only one cell. We monitored wells for green fluorescence at 30-min intervals for a period of 24–36 h. After accounting for the empty wells and other events that precluded inclusion of a well (Fig. S3), 100 to 400 single cells were available for analysis. We normalized the fluorescence intensity of each cell to the background fluorescence of its well and plotted normalized fluorescence intensity (NFI) as a function of time post-infection (Fig. 2C). We observed substantial variation in the kinetics of replication of GFP-PV in each cell (Fig. 2C). The time in which fluorescence could be detected, the rate at which fluorescence intensity rose, the maximum fluorescence intensity observed, and when the infected cell lysed, if at all, were different in each of the cells (Figs. 2C and S3). We plotted the average intensity for each time point as a function of time, which yielded a curve similar to a growth curve observed by population methods (Fig. 2D). GFP was dispersed and diluted in the well as cells lysed, leading to a reduction in GFP
A
uthor Man
uscr
ipt
A
uthor Man
uscr
ipt
A
uthor Man
uscr
ipt
A
uthor Man
uscr
fluorescence (Fig. 2D). The fluorescence decay reached a plateau well above background levels because not every cell producing GFP lysed over the 24-h time period monitored (Fig. 2C and S3).
Data analysis—We sorted all of the time courses of successful infections into two classes: infection without lysis (Figs. 2E and S3C) and infection with lysis (Fig. 2F and S3D). We modeled the former as a sigmoidal rise and the latter as a sigmoidal rise followed by a sigmoidal decay. These models were sufficient to fit all of our experimental observations (Fig. S3E). We defined five phenomenological parameters to describe the sigmoidal rise that forms the foundation of our data analytics. These parameters are: (i) maximum, the
maximum fluorescence intensity observed; (ii) midpoint, the time at which the intensity was half of maximum; (iii) slope, the change in intensity per hour measured at the midpoint; (iv) start point, the time at which fluorescence was first detected; and (v) infection time, the length of time required to go from the start point of fluorescence to the maximum fluorescence (Fig. S3). Details of the code used for data analysis have been described (Caglar et al., 2017).
Implementation of the pipeline—To test the ability of the single-cell experiment to identify statistically significant differences in experimental outcomes caused by an
experimental variable or perturbation, we evaluated the impact of varying the multiplicity of infection. We chose multiplicity of infection because one-step-growth experiments demand infection of all cells. The single-cell experiment does not, thus providing an assessment of the dependence of infection outcome on multiplicity of infection. We infected HeLa S3 cells with 50, 500 or 5,000 genomes per cell, corresponding to multiplicities of infection of 0.05, 0.5 or 5, respectively, using pfu. We observed 93–202 individual cells that were successfully infected and analyzed the data as described above to produce distributions for each
parameter at each MOI (Figs. 2G – 2K). We compared the distributions for the maximum parameter under the three different conditions; the curves did not completely superimpose (Fig. 2G). We were conservative in our approach to statistical analysis. Instead of asking if pairwise differences existed for distributions and risking over-interpretation of the data, we asked only if pairwise differences existed in the mean of the distributions (Table S1). Therefore, we used t-tests to perform statistical analysis and required P-values less than 0.05 to define a statistically significant difference between two distributions. Using these criteria, the means of the maximum parameter shown in Fig. 2G were not different (Table S2). We observed statistically significant differences for unique pairwise comparisons of the means for the slope and midpoint parameters (Figs. 2H and 2I and Table S2). For the start-point parameter 50 and 500 were different when compared to 5,000 but not when compared to each other (Fig. 2J and Table S2). For the infection-time parameter 500 and 5,000 were different when compared to 50 but not when compared to each other (Fig. 2K and Table S2). We conclude that our pipeline is sufficient to take a population-level evaluation of viral growth kinetics and deconvolve this single curve into distributions of five fundamental parameters. Further, we conclude that we can identify statistically significant differences between parameters caused by an experimental variable, even a variable as insipid as multiplicity of infection. Importantly, we performed multiple experiments with different
A
uthor Man
uscr
ipt
A
uthor Man
uscr
ipt
A
uthor Man
uscr
ipt
A
uthor Man
uscr
stocks of wild-type virus and HeLa cells without observing statistically significant differences for any of the parameters (Table S3).
To determine if the five parameters used to describe infections on the single-cell level report on the same or different biological properties or processes of the virus, host and/or
interaction thereof, we performed a pairwise comparison of the parameters (Fig. 3). We reasoned that parameters governed by the same biological properties or processes will be correlated. We observed a strong correlation between the midpoint and start-point
parameters (Fig. 3J) and weaker correlation between maximum and slope parameters (Fig. 3C). However, all other pairwise comparisons were not correlated (Fig. 3). We conclude that parameters determined using the single-cell experiment permit greater elaboration of an infection cycle than permitted by population experiments.
Origins of the between-cell variability of infection outcomes
Cell cycle does not contribute to between-cell variability of infection
outcomes—Our next goal was to determine the origin(s) of the between-cell variability of infection outcomes and to assign parameters to properties or processes of the virus and/or cell. The first hypothesis was that between-cell variability arose, in part, based on stages of the cell cycle. To test this hypothesis, we used a fluorescence activated cell sorter (FACS) to divide cells into two groups based on DNA content: G0/G1 and G2/M (Fig. 4A). An unsorted control was prepared by passing cells through the FACS without sorting. We infected cells at an MOI of 500 genomes per cell. We did not observe a significant difference in the average kinetics of the population (Fig. 4B) or in any distributions describing the various parameters (Figs. 4C–4G and Table S4).
Contributions of the virus and cell to between-cell variability of infection outcomes—We conceived an alternative approach to reveal the origins of the between-cell variability. If we infect cells with viruses expressing reporters of different colors, then co-infected cells should exhibit a strong correlation in production of the reporter if the cell is the primary determinant of between-cell variability. Conversely, co-infected cells should exhibit no correlation in production of the reporter if the virus is the primary determinant of between-cell variability. For this experiment, we substituted GFP-coding sequence with that for mCherry to produce mCherry-PV. We infected cells with both GFP-PV and mCherry-PV at an MOI of 2,000 genomes per cell. We selected co-infected cells for analysis. We
determined each parameter for each virus in each co-infected cell and plotted each parameter pair (Fig. 5A). We did not observe any correlation for the maximum, slope or infection-time parameter, suggesting that the virus is the primary determinant of the variability of these parameters (Fig. 5A). We observed a very strong correlation for the start-point and midpoint parameters, suggesting that the cell is the primary determinant of the variability of these parameters (Fig. 5A). We conclude that both the virus and the cell contribute to the between-cell variability of infection outcomes. Importantly, our experimental paradigm is able to separate infection outcome into a virus component and a host component, which, in our opinion, is a major advance to using a single-cell approach.
A
uthor Man
uscr
ipt
A
uthor Man
uscr
ipt
A
uthor Man
uscr
ipt
A
uthor Man
uscr
Determinants of cell lysis
In each experiment performed, we observed a fraction of infected cells (15–30%) that failed to lyse, even at time points as long as 24 h post-infection. To identify parameters governing lysis, we compared distributions of each parameter for the two infection outcomes: infection without lysis (Infection in Fig. 5B) and infection with lysis (Infection & lysis in Fig. 5B). We observed statistically significant differences for the maximum, slope and infection-time parameters but not for the start-point and midpoint parameters (Fig. 5B and Table S5). Infections that failed to progress to lysis replicated to lower levels, were slower and took a longer time to complete the replication cycle. Because experiments above (Fig. 5) link these parameters to the virus, these results suggest that the failure to progress to lysis may be conferred by viral genotype.
It was possible that the virus or cell dependence of the parameters change in cells that fail to progress to lysis. To address this possibility, we performed an experiment in which cells were co-infected with GFP-PV and mCherry-PV as described above. Instead of evaluating all infections, however, we focused solely on infections that failed to progress to lysis. We plotted the value of each parameter for each virus pairwise. As observed previously for the entire population (Fig. 5), start-point and midpoint parameters were highly correlated (Fig. 5C). Surprisingly, in this sub-population of infections, maximum and slope parameters were now also correlated (Fig. 5C). If lysis were triggered by the total amount of viral protein produced, we would expect to see anti-correlations in these parameters in the sub-population of cells not displaying lysis. Therefore, we conclude that whether or not an infection fails to progress to lysis is in part determined by cellular factors, or by viral factors unrelated to total protein production. We will design experiments in the future to clarify these issues.
Single-cell analysis reveals phenotypes for an attenuated virus masked by population methods
RNA-dependent RNA polymerase (RdRp) fidelity is a well-established virulence determinant (Arias et al., 2016; Arnold et al., 2005; Korboukh et al., 2014; Pfeiffer and Kirkegaard, 2005; Van Slyke et al., 2015; Vignuzzi et al., 2006; Zeng et al., 2013). Studies with PV and its RdRp were among the first to make this connection by showing that changes in nucleotide-incorporation fidelity of the RdRp produce viruses that are attenuated in vivo (Arnold et al., 2005; Korboukh et al., 2014; Vignuzzi et al., 2006). However, when these same viruses were compared to wild-type using conventional methods, a difference between the mutant and wild type could not be discerned (Korboukh et al., 2014; Vignuzzi et al., 2006). This circumstance provided us with the opportunity to determine if single-cell analysis enables distinction between a PV fidelity mutant and wild type. For this experiment, we used a PV mutant expressing a mutator RdRp, H273R (Fig. S4B) (Korboukh et al., 2014). We introduced the H273R-encoding mutation into GFP-PV cDNA. In the context of GFP-PV, the mutation caused only a small reduction in the specific infectivity of the virus (Fig. S1B).
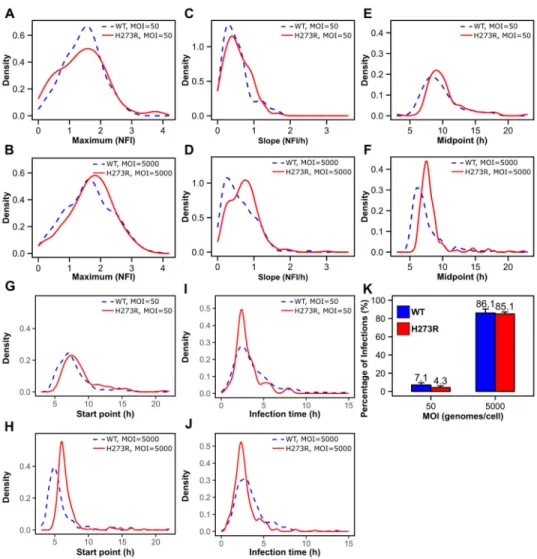
We compared H273R PV to wild type in infections using 50 or 5,000 genomes per cell. At low MOI, we observed only one statistically significant difference between the mutant and wild type (Fig. 6 and Table S6). This difference was for the start-time parameter (Fig. 6G
A
uthor Man
uscr
ipt
A
uthor Man
uscr
ipt
A
uthor Man
uscr
ipt
A
uthor Man
uscr
and Table S6). At high MOI, however, we observed numerous differences: slope, midpoint, start point and infection time (Fig. 6 and Table S6). H273R PV exhibited a delayed start of replication relative to WT PV (Fig. 6H). Consistent with biochemistry (Korboukh et al., 2014), H273R PV actually replicates faster than WT PV (Fig. 6D), leading to faster completion of replication (Fig. 6J). Because of our ability to count the number of infections established, we observed directly the reduced specific infectivity of H273R PV relative to WT PV (Fig. 6K). This analysis provided unprecedented, detailed insight into the differences in growth properties of a mutant virus relative to wild-type virus.
Some of the observed differences could actually explain the attenuated phenotype. For example, delayed start point indicates a sub-optimal interaction of the mutant virus with host cell. In the context of a heightened antiviral state, a delayed start point could produce new bottlenecks by diminishing the yield of progeny by several logs (Figs. S4C and S4D). The reduction in the number of infections established at low MOI indicates a frailty of the virus population to bottlenecking events. We conclude that studies on the single-cell level will provide a more comprehensive and in-depth perspective of virus biology and virus-host interactions in cell culture that may inform our understanding of pathogenesis in vivo.
Single-cell analysis reveals more about an antiviral agent than its efficacy
Antiviral drug discovery and characterization represent a major emphasis of molecular virology. Discovery and characterization of antiviral agents are driven by the mission to minimize the IC50, the concentration of drug required to inhibit virus multiplication by 50%, and to maximize the CC50, the concentration of drug required to cause cytotoxicity in 50% of treated cells. It was apparent to us that our single-cell-analysis platform could provide information not only on the efficacy of a drug but also on the properties of the viruses most susceptible to drug action as well as the fate and properties of the viruses that survive drug action. It was also possible that we could determine if a drug targeted a cell-dependent and/or virus-dependent aspect of the life cycle.
For this study, we chose to use 2′-C-methyladenosine. Inside of cells, this nucleoside is converted into the triphosphorylated form, which then serves as a substrate for the viral RdRp and leads to termination of RNA synthesis (Carroll et al., 2003). This drug was the first in the class of non-obligate chain terminators that paved the way for development of sofosbuvir, the antiviral nucleoside used in combination therapy to cure hepatitis C virus infection (Appleby et al., 2015; Carroll et al., 2003; Murakami et al., 2010). We grew cells in the absence or presence of 50 μM 2′-C-methyladenosine. Experiments performed at the population level identified this concentration as the IC50. We infected cells with WT PV at a MOI of 5,000 genomes per cell. As expected, we observed a 50% reduction in the number of infections established in the presence of 50 μM 2′-C-methyladenosine (Fig. 7A).
Distributions for only two parameters changed in the presence of the drug; these were for maximum (Fig. 7B) and slope (Fig. 7C). The yield from replication was reduced more than the rate of replication as might be expected for an RNA-chain terminator. A pairwise comparison of the maximum and slope parameters in the absence and presence of the drug revealed a selective loss of members of the virus population exhibiting the highest values for the maximum and slope (Fig. 7G). This observation of survival of the least-fit members of
A
uthor Man
uscr
ipt
A
uthor Man
uscr
ipt
A
uthor Man
uscr
ipt
A
uthor Man
uscr
the viral population could only be observed using a single-cell-analysis platform. We conclude that single-cell analysis will provide greater insight into the mechanisms of action, viral targets and perhaps even cellular off-targets of antiviral therapeutics.
DISCUSSION
The era of biology at the single-cell level is underway (Gawad et al., 2016; Heath et al., 2016; Kolodziejczyk et al., 2015; Saadatpour et al., 2015; Symmons and Raj, 2016). Most studies have relied on some physical method of separation to isolate single cells followed by interrogation of individual cells for some property: RNA, protein, etc. The major conclusion of these studies is the existence of between-cell variability of the measured property. This variability is often referred to as noise. In relation to viral infection, the noisy nature of gene expression would include between-cell differences in the expression of receptors for viral entry, pathogen recognition receptors, and any of the many, many host factors contributing to establishment of a productive viral infection. Therefore, it is not a surprise that the few studies that have been performed to date evaluating virus infection at the single-cell level have succeeded in observing the noise in viral infection (Akpinar et al., 2016; Heldt et al., 2015; Schulte and Andino, 2014; Thompson and Yin, 2010; Warrick et al., 2016). The single-cell platform reported here permits acquisition of complete time courses of infection for hundreds of cells even at low multiplicity of infection. (Fig. 2).
The quantitative measure most often determined using a one-step-growth experiment is virus yield. The eclipse and replication phases tend to be used qualitatively, primarily because one-step-growth curves are usually neither fit nor modeled. The one-step-growth experiment also requires the use of a multiplicity of infection in which every cell is infected, conditions prone to co-infections that can mask phenotypes by genetic/phenotypic complementation. Characterizing the behavior of a population of infected cells based on the behavior of single, infected cells expands substantively both the qualitative and quantitative description of an infection without a requirement for a high multiplicity of infection.
We define five parameters to describe each infection: maximum, slope, midpoint, start point and infection time (Fig. 2). These parameters relate to traditional parameters as follows. Maximum corresponds to yield. Slope corresponds to replication rate. Start point and midpoint correlate with eclipse phase. Infection time corresponds to the time required to produce the maximal amount of virus in the cell once the eclipse phase has ended, similar to the generation time. We are able to determine each parameter by plotting and fitting a time course of infection for each cell (Figs. 2 and S3). Next, we create a distribution for each parameter (Fig. 2). We calculate the mean of each distribution and the corresponding standard deviation (Table S1). We use a t-test to ascertain any differences between two or more experimental conditions (Tables S2–S7). Using this approach, we demonstrate that multiplicity of infection exhibits a profound effect on most parameters (Figs. 2 and S4). Infection in vivo and its associated bottlenecks (Kuss et al., 2008) are mimicked by low multiplicity of infection, an experimental design well suited to a single-cell platform.
We observe a striking difference between conclusions reached when population averages are used instead of individual distributions. Consider the time course produced for the average
A
uthor Man
uscr
ipt
A
uthor Man
uscr
ipt
A
uthor Man
uscr
ipt
A
uthor Man
uscr
of the fluorescence intensity for infections of cells at a high multiplicity of infection (Fig. 2D). From this curve, one would conclude that it takes on average to 4 h post-infection to start replication, another 4 h thereafter to complete replication and no additional replication occurs after 8 h post-infection (Fig. 2D). The individual distributions tell a completely different story. Only half of infections start by 5 h post-infection (Fig. 2J and Table S1). Indeed, infections continue to begin even at 8-h post-infection (Fig. 2J), a time in which the population average suggests that replication has ended (Fig. 2D). Replication is over in nearly half of infected cells by 2.5 h post-infection (Fig. 2K). Our studies on the single-cell level predict that similar under- and over-estimations occur for population measurements like the one-step-growth experiment. However, when infections are measured in bulk on a scale of 108 pfu/mL, a loss of half would fall squarely within the error of the measurement. The inability of an assay to explicitly report on as many as half of all events can be problematic.
The plaque-forming unit remains a gold standard of virology. When this technique was pioneered for the study of bacteriophage, in particular measuring the concentration of bacteriophage, the assumption was that each population of progeny virions associated with each plaque was founded by a single virion (Ellis and Delbruck, 1939). As the plaque assay came into vogue for the study of animal viruses, similar assumptions were made (Dulbecco, 1952; Dulbecco and Vogt, 1954). A few years ago, we showed for PV that formation of a plaque required more than a single genome (Korboukh et al., 2014). Similar conclusions have been reached by others studying PV (Aguilera et al., 2017) and vesicular stomatitis virus (Combe et al., 2015). Together, these studies highlight the concept of an infectious unit, the number of virions or genomes required to establish infection of a cell. Here, we use the single-cell platform to count the number of infected cells at any given multiplicity of infection, multiplicity counted here as genomes per cell, thus permitting an unambiguous calculation of an infectious unit (Figs. 2L, 6K and 7A).
We use the single-cell platform to distinguish events that are virus driven from those that are cell driven. Maximum and slope parameters are correlated, suggesting that they are governed by the same viral and/or cellular factors (Fig. 3C). The same is true for start-point and midpoint parameters (Fig. 3J). All other parameters report on unique viral and/or cellular factors (Fig. 3). By co-infecting cells with viruses expressing different color reporters, we identify virus-dependent parameters as those exhibiting no correlation of colors (maximum, slope and infection time), and cell-dependent parameters as those exhibiting correlation of colors (start point and midpoint) (Fig. 5A). Interestingly, infected cells that fail to readily lyse show a correlation of colors for maximum and slope, suggesting that, in this context, these parameters may now be cell driven (Fig. 5C). The ability to identify and characterize cell-dependent phenomena will facilitate studies of virus-host interactions.
The single-cell platform revealed an unexpected interaction of PV with a subset of cells, which did not support progression of the infection to lysis over a 24 h period (Figs. 2, S2 and S3). These infected cells limit both the rate of virus replication and yield of virus production (Fig. 5B). As alluded to above, this restriction appears to be more a property of the cell than the virus (Fig. 5C). The discovery of populations of infected cells with this behavior may inform our understanding of mechanisms of viral persistence or perhaps even mechanisms of
A
uthor Man
uscr
ipt
A
uthor Man
uscr
ipt
A
uthor Man
uscr
ipt
A
uthor Man
uscr
non-lytic viral spread. The existence of a population of infected cells recalcitrant to lysis creates a challenge for experiments designed to measure competitive fitness. Some of these experiments compete two viruses at low multiplicity of infection and measure the amount of each virus after multiple cycles of infection and infection. Cells that restrict lysis will complicate interpretation of experiments such as these.
Viral RNA-dependent RNA polymerase fidelity as a determinant of virulence represents an ever-increasing area of interest because of the possibility to create vaccine strains by tuning polymerase fidelity. Numerous examples exist of attenuated RNA virus mutants encoding polymerases with fidelity higher or lower than wild type (Arias et al., 2016; Arnold et al., 2005; Korboukh et al., 2014; Pfeiffer and Kirkegaard, 2005; Van Slyke et al., 2015; Vignuzzi et al., 2006; Zeng et al., 2013). However, these variants often fail to exhibit a phenotype in cell culture. This is the case for the mutator PV mutant, H273R PV (Korboukh et al., 2014). Using the single-cell platform, we show that H273R PV is unable to establish infection as efficiently as wild type (Fig. 6). This phenotype manifests as a delay in start point, longer midpoint and fewer infected cells at low multiplicity of infection (Fig. 6). This result suggests that wild-type levels of error incorporation generates a population of virus variants essential for efficient hijacking of the cell that maximizes start time and frequency of infection. The population produced by the mutator is less effective at hijacking the cell, a different perspective on the origin of the attenuated phenotype of a fidelity mutant. Emphasis on the eclipse phase (start point) as detected using the single-cell platform will illuminate changes in the virus-host interaction that impact infection outcomes in cell culture and may inform the pathogenic potential of a virus variant in vivo.
Cell-based studies of antiviral therapeutics focus on efficacy and resistance. Here we show that the concentration of a drug sufficient to extinguish half of a viral population is a concentration that also antagonizes replication of survivors (Fig. 7). The parameters affected most are those that are virus dependent: maximum and slope (Fig. 7), as expected for an inhibitor whose target is the viral polymerase. The absence of any effect on the start point suggests that RNA synthesis during the eclipse phase may not be required to establish infection. Perhaps translation of the infecting RNA genomes drives this early phase of the lifecycle, which might explain the requirement for so many genomes to establish infection (Korboukh et al., 2014). We show that a polymerase inhibitor selectively eliminates members of the virus population that replicate fastest and to the highest levels (Fig. 7G). This observation, while most unexpected, is easy to reconcile as fast polymerases will exhibit a higher probability of drug incorporation; these same polymerases would be expected to replicate fastest and produce highest yields. Is survival of the least-fit members of the population the outcome for all antiviral drugs? One might expect that an inhibitor would act equally across the population. Perhaps we have discovered an unappreciated mechanism of action. The advantage of targeting the most-fit members of a population is that development of resistance requires the virus to not only develop resistance to the drug but also restore fitness. Observations such as these are impossible to make using population methods. The single-cell platform will add important insight into our appreciation of mechanisms of antiviral drug action and facilitate discovery of antiviral drugs with a high barrier to resistance.
A
uthor Man
uscr
ipt
A
uthor Man
uscr
ipt
A
uthor Man
uscr
ipt
A
uthor Man
uscr
Virology has not witnessed an expansion of the tools used to study the quantitative, kinetic behavior of viruses in cell culture since the 1950’s. The plaque assay and one-step-growth experiment will continue to serve virology well. We view the addition of platforms for single-cell analysis of viral infections to be as impactful to virology as single-molecule methods have been to enzymology and single-particle tracking has been to cell biology. The era of single-cell virology is now.
EXPERIMENTAL PROCEDURES
Device fabrication
The isolated well array microfluidic device was designed with drafting software
(AutoCAD). This device consists of four sample loading inlets (or more depending on the application) and 6,000 wells, each of which has a dimension of 120 μm × 120 μm × 100 μm (length × width × height). Designs including control layer, flow layer and wells layer (Fig. S2A) were printed at 20,000 dots per inch (dpi) on transparent masks. The silicon molds were fabricated with standard photolithography techniques as described in Supplemental Experimental Procedures.
Experimental setup
The experimental setup of our platform for automated monitoring of single-cell viral infections is shown in Fig. S2B. The system was built on an inverted microscope (Eclipse Ti, Nikon, Japan) equipped with a motorized stage (ProScan III, Prior Scientific, USA) and a microscope incubation system (INUBTFP-WSKM-GM2000A, Prior Scientific, USA). The microfluidic device connected to a customized pneumatic valve system was placed inside the incubation chamber. The cell/virus solutions were injected into the well array microfluidic device through different outlets. After loading, the pneumatic valves (the pneumatic control channels were filled with DI water) were closed by compressed nitrogen (30 psi) to seal single cells into each individual well and to prevent the spread of virus into the neighboring wells. The cells were isolated in individual wells and cultured in a 37 °C humid environment with 5% CO2 level.
Data acquisition and processing
The time-lapse images (including bright-field and fluorescence) of multiple positions of the microfluidic device were automatically acquired with a 10× objective and a charge-coupled device (CCD) camera (CoolSNAP HQ2, Photometrics, USA) controlled by software (NIS-Elements AR, Nikon, Japan) every 30 minutes for 21 hours or 33 hours starting at 3 hpi. Fig. S2 shows the stitched images of wells connected to one inlet and enlarged images of 12 wells at 4 different time points. After data acquisition, the time-lapse images were processed with a customized MATLAB script to extract fluorescence intensity of single infected cells and background fluorescence intensity of the well. Additional details are described in Supplemental Experimental Procedures.
Statistical analysis and data availability
Statistical analysis was carried out in R. We used the R package sicegar (Caglar et al., 2017) to classify observed time courses of normalized GFP intensity and to extract relevant
A
uthor Man
uscr
ipt
A
uthor Man
uscr
ipt
A
uthor Man
uscr
ipt
A
uthor Man
uscr
parameters such as maximum intensity, midpoint, and slope. Mean parameter values among conditions were compared using the R function pairwise.t.test, which performs pairwise comparisons of all conditions while correcting for multiple testing. All raw GFP time courses, processed data, and analysis scripts are freely available at: https://github.com/ clauswilke/Guo_etal_SCV.
Supplementary Material
Refer to Web version on PubMed Central for supplementary material.
Acknowledgments
We thank Prof. John Fricks for guidance on the preliminary statistical analysis, Prof. Carl L. Hansen for a suggestion on device fabrication, and Dr. Cheri A. Lee, Dr. Suresh Sharma, and Ms. Sravani Banerjee for guidance on the biological aspects of the study. We gratefully acknowledge financial support from the Huck Institutes of the Life Sciences, NIH grants AI120560 (to CEC, TJH and COW) and EB019785 (to TJH), and the Penn State Center for Nanoscale Science (MRSEC) funded by grant DMR-1420620 from NSF. Components of this work were conducted at the Penn State node of the NSF-funded National Nanotechnology Infrastructure Network (NNIN).
References
Aguilera ER, Erickson AK, Jesudhasan PR, Robinson CM, Pfeiffer JK. Plaques Formed by Mutagenized Viral Populations Have Elevated Coinfection Frequencies. mBio. 2017:8.
Akpinar F, Timm A, Yin J. High-Throughput Single-Cell Kinetics of Virus Infections in the Presence of Defective Interfering Particles. Journal of virology. 2016; 90:1599–1612.
Appleby TC, Perry JK, Murakami E, Barauskas O, Feng J, Cho A, Fox D 3rd, Wetmore DR, McGrath ME, Ray AS, et al. Viral replication. Structural basis for RNA replication by the hepatitis C virus polymerase. Science. 2015; 347:771–775. [PubMed: 25678663]
Arias A, Thorne L, Ghurburrun E, Bailey D, Goodfellow I. Norovirus Polymerase Fidelity Contributes to Viral Transmission In Vivo. mSphere. 2016:1.
Arnold JJ, Vignuzzi M, Stone JK, Andino R, Cameron CE. Remote site control of an active site fidelity checkpoint in a viral RNA-dependent RNA polymerase. The Journal of biological chemistry. 2005; 280:25706–25716. [PubMed: 15878882]
Battich N, Stoeger T, Pelkmans L. Control of Transcript Variability in Single Mammalian Cells. Cell. 2015; 163:1596–1610. [PubMed: 26687353]
Caglar MU, Teufel AI, Wilke CO. Sicegar: R package for sigmoidal and double-sigmoidal curve fitting. PeerJ Preprints. 2017; 5:e3116v3111.
Carroll SS, Tomassini JE, Bosserman M, Getty K, Stahlhut MW, Eldrup AB, Bhat B, Hall D, Simcoe AL, LaFemina R, et al. Inhibition of hepatitis C virus RNA replication by 2′-modified nucleoside analogs. The Journal of biological chemistry. 2003; 278:11979–11984. [PubMed: 12554735] Combe M, Garijo R, Geller R, Cuevas JM, Sanjuan R. Single-Cell Analysis of RNA Virus Infection
Identifies Multiple Genetically Diverse Viral Genomes within Single Infectious Units. Cell host & microbe. 2015; 18:424–432. [PubMed: 26468746]
Crotty S, Hix L, Sigal LJ, Andino R. Poliovirus pathogenesis in a new poliovirus receptor transgenic mouse model: age-dependent paralysis and a mucosal route of infection. The Journal of general virology. 2002; 83:1707–1720. [PubMed: 12075090]
Domingo E, Holland JJ. RNA virus mutations and fitness for survival. Annual review of microbiology. 1997; 51:151–178.
Dulbecco R. Production of Plaques in Monolayer Tissue Cultures by Single Particles of an Animal Virus. Proceedings of the National Academy of Sciences of the United States of America. 1952; 38:747–752. [PubMed: 16589172]
Dulbecco R, Vogt M. Plaque formation and isolation of pure lines with poliomyelitis viruses. The Journal of experimental medicine. 1954; 99:167–182. [PubMed: 13130792]
A
uthor Man
uscr
ipt
A
uthor Man
uscr
ipt
A
uthor Man
uscr
ipt
A
uthor Man
uscr
Ellis EL, Delbruck M. THE GROWTH OF BACTERIOPHAGE. The Journal of general physiology. 1939; 22:365–384. [PubMed: 19873108]
Gawad C, Koh W, Quake SR. Single-cell genome sequencing: current state of the science. Nature reviews Genetics. 2016; 17:175–188.
Heath JR, Ribas A, Mischel PS. Single-cell analysis tools for drug discovery and development. Nature reviews Drug discovery. 2016; 15:204–216. [PubMed: 26669673]
Heldt FS, Kupke SY, Dorl S, Reichl U, Frensing T. Single-cell analysis and stochastic modelling unveil large cell-to-cell variability in influenza A virus infection. Nature communications. 2015; 6:8938. Kallman F, Williams RC, Dulbecco R, Vogt M. Fine structure of changes produced in cultured cells
sampled at specified intervals during a single growth cycle of polio virus. The Journal of biophysical and biochemical cytology. 1958; 4:301–308. [PubMed: 13549502]
Kolodziejczyk AA, Kim JK, Svensson V, Marioni JC, Teichmann SA. The technology and biology of single-cell RNA sequencing. Molecular cell. 2015; 58:610–620. [PubMed: 26000846]
Korboukh VK, Lee CA, Acevedo A, Vignuzzi M, Xiao Y, Arnold JJ, Hemperly S, Graci JD, August A, Andino R, et al. RNA virus population diversity, an optimum for maximal fitness and virulence. The Journal of biological chemistry. 2014; 289:29531–29544. [PubMed: 25213864]
Kuss SK, Etheredge CA, Pfeiffer JK. Multiple host barriers restrict poliovirus trafficking in mice. PLoS pathogens. 2008; 4:e1000082. [PubMed: 18535656]
Lauring AS, Andino R. Quasispecies theory and the behavior of RNA viruses. PLoS pathogens. 2010; 6:e1001005. [PubMed: 20661479]
Lwoff A, Dulbecco R, Vogt M, Lwoff M. Kinetics of the release of poliomyelitis virus from single cells. Virology. 1955; 1:128–139. [PubMed: 13267981]
Murakami E, Tolstykh T, Bao H, Niu C, Steuer HM, Bao D, Chang W, Espiritu C, Bansal S, Lam AM, et al. Mechanism of activation of PSI-7851 and its diastereoisomer PSI-7977. The Journal of biological chemistry. 2010; 285:34337–34347. [PubMed: 20801890]
Pelkmans L. Cell Biology. Using cell-to-cell variability--a new era in molecular biology. Science. 2012; 336:425–426. [PubMed: 22539709]
Pfeiffer JK, Kirkegaard K. Increased fidelity reduces poliovirus fitness and virulence under selective pressure in mice. PLoS pathogens. 2005; 1:e11. [PubMed: 16220146]
Saadatpour A, Lai S, Guo G, Yuan GC. Single-Cell Analysis in Cancer Genomics. Trends in genetics: TIG. 2015; 31:576–586. [PubMed: 26450340]
Schulte MB, Andino R. Single-cell analysis uncovers extensive biological noise in poliovirus replication. Journal of virology. 2014; 88:6205–6212. [PubMed: 24648454]
Snijder B, Pelkmans L. Origins of regulated cell-to-cell variability. Nature reviews Molecular cell biology. 2011; 12:119–125. [PubMed: 21224886]
Symmons O, Raj A. What’s Luck Got to Do with It: Single Cells, Multiple Fates, and Biological Nondeterminism. Molecular cell. 2016; 62:788–802. [PubMed: 27259209]
Thompson KA, Yin J. Population dynamics of an RNA virus and its defective interfering particles in passage cultures. Virology journal. 2010; 7:257. [PubMed: 20920247]
Van Slyke GA, Arnold JJ, Lugo AJ, Griesemer SB, Moustafa IM, Kramer LD, Cameron CE, Ciota AT. Sequence-Specific Fidelity Alterations Associated with West Nile Virus Attenuation in
Mosquitoes. PLoS pathogens. 2015; 11:e1005009. [PubMed: 26114757]
Vignuzzi M, Stone JK, Arnold JJ, Cameron CE, Andino R. Quasispecies diversity determines pathogenesis through cooperative interactions in a viral population. Nature. 2006; 439:344–348. [PubMed: 16327776]
Warrick JW, Timm A, Swick A, Yin J. Tools for Single-Cell Kinetic Analysis of Virus-Host Interactions. PloS one. 2016; 11:e0145081. [PubMed: 26752057]
Zeng J, Wang H, Xie X, Yang D, Zhou G, Yu L. An increased replication fidelity mutant of foot-and-mouth disease virus retains fitness in vitro and virulence in vivo. Antiviral research. 2013; 100:1– 7. [PubMed: 23880348]
A
uthor Man
uscr
ipt
A
uthor Man
uscr
ipt
A
uthor Man
uscr
ipt
A
uthor Man
uscr
Highlights
• High-throughput on-chip culturing and live-cell imaging of single, infected cells
• Single-cell, temporal infection dynamics revealed bias of population averaging
• Cells refractory to lysis exposed; infection thereof may lead to viral persistence
• An antiviral agent was shown to target only a subset of the viral population
A
uthor Man
uscr
ipt
A
uthor Man
uscr
ipt
A
uthor Man
uscr
ipt
A
uthor Man
uscr
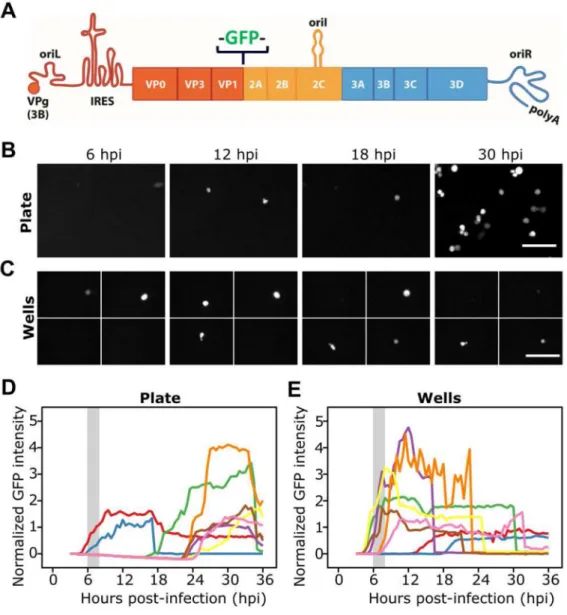
Figure 1. Isolation of single cells is essential for interpretation of replication kinetics when monitored using fluorescence
(A) GFP-PV was created by inserting GFP-coding sequence between the capsid-coding P1 region of the genome and non-structural protein-coding P2 region. Translation of the RNA produces a polyprotein; release of GFP is mediated by viral 2A protease at cleavage sites flanking the protein. Cells were infected with GFP-PV at a multiplicity of infection (MOI) of 50 genomes per cell and then either plated (B) or sorted into wells (C). (D,E) Time-lapse images of the evolution of green fluorescence is shown. On the plate, it is not possible to know if the delayed kinetics of replication is a result of the low MOI or the requirement for multiple rounds of infection. Such ambiguity does not exist for the kinetics of replication in single, isolated cells. Scale bars: 100 μm.
A
uthor Man
uscr
ipt
A
uthor Man
uscr
ipt
A
uthor Man
uscr
ipt
A
uthor Man
uscr
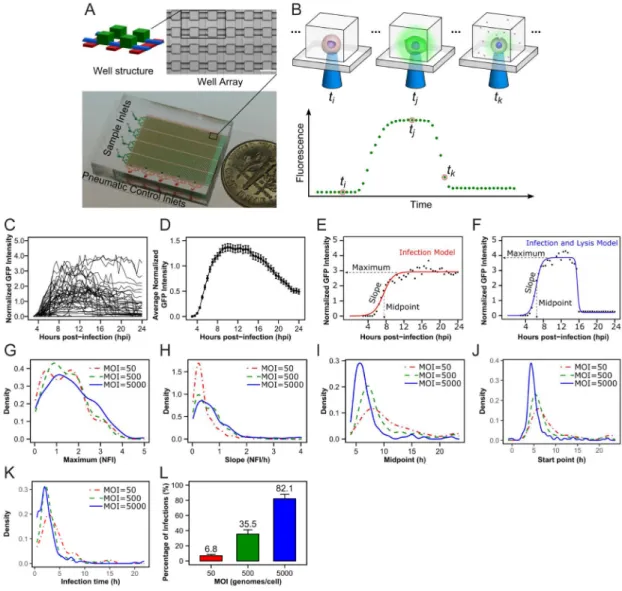
Figure 2. A microfluidic device and experimental paradigm for single-cell analysis of viral infections
(A) We created a device that contains 6,400 wells. The use of four separate sample inlets (green) and pneumatic control lines (red) permits each well and its contents to be sealed and therefore isolated from all other wells. Scale bar: 100 μm (B) The device permits real-time imaging of fluorescence in living cells. Infection of a cell by a virus expressing a fluorescent reporter should lead to a lag post-infection (ti) that transitions into a replication phase that plateaus (tj) with an ultimate decline in fluorescence caused by lysis of the infected cell (tk). (C) Plots of the fluorescence intensity observed in each well normalized to the background fluorescence of the well as a function of time revealed unprecedented, between-cell variability in the outcome of infection. (D) A plot of the average of the normalized
fluorescence intensity (NFI) from the curves shown in panel C as a function of time reveals a curve similar in appearance to a growth curve measured using population methods. Error bars indicated at each time point are from 202 individual infected cells. Standard error of the mean (SEM) ranged from 0.0008 to 0.0754 NFI. One of two models could be used to describe infection outcomes: (E) infection model; (F) infection and lysis model. Both
A
uthor Man
uscr
ipt
A
uthor Man
uscr
ipt
A
uthor Man
uscr
ipt
A
uthor Man
uscr
models identify phenomenological parameters that can be used to describe each curve. These are: maximum, slope, midpoint, start point and infection time. The impact of MOI on (G) maximum, (H) slope, (I) midpoint, (J) start point and (K) infection time was
determined. Statistical analysis of the distributions shown in panels G–K can be found in Table S2. (L) This experiment permits measurement of the percentage of infected cells, a parameter that can only be inferred from population methods. The impact of MOI on the percentage of infected cells is shown. Data are represented as means ± standard deviation (SD) for three biological replicates.
A
uthor Man
uscr
ipt
A
uthor Man
uscr
ipt
A
uthor Man
uscr
ipt
A
uthor Man
uscr
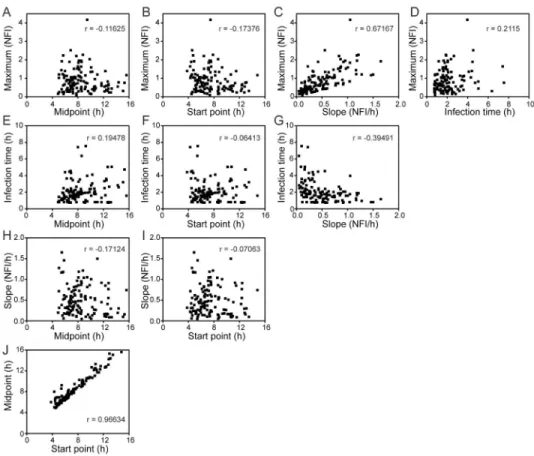
Figure 3. Independence of parameters describing single-cell infections
Each parameter obtained by fitting time courses of GFP fluorescence were compared individually to all others. With the exception of start point and midpoint, parameters were not strongly correlated. Therefore, each parameter likely reports on different aspects of viral replication and/or the interaction of the virus with the cell. The Pearson correlation
coefficient (r) is indicated in each panel.
A
uthor Man
uscr
ipt
A
uthor Man
uscr
ipt
A
uthor Man
uscr
ipt
A
uthor Man
uscr
Figure 4. Cell cycle does not influence outcome of infection in single cells
(A) HeLa S3 cells were sorted into G0/G1 and G2/M groups by FACS as described under Materials and Methods. Cells run through the FACS and collected without sorting were used as unsorted control. (B) Averaged curves of viral infection dynamics on single cells using unsorted cells, G0/G1 cells, and G2/M cells. Data are represented as means ± SEM. (C–G) Distributions of maximum, slope, midpoint, start point and infection time revealed statistically insignificant contribution of cell cycle to the heterogeneity of viral infection dynamics at the single-cell level (Table S4).
A
uthor Man
uscr
ipt
A
uthor Man
uscr
ipt
A
uthor Man
uscr
ipt
A
uthor Man
uscr
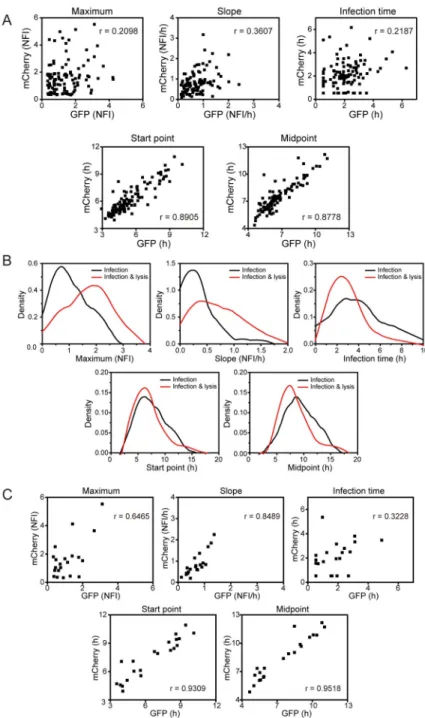
Figure 5. Contribution of virus or host to the parameters describing viral infection of single cells and determinants of a non-lytic outcome of infection
(A) HeLa S3 cells were infected with GFP-PV and mCherry-PV at an MOI of 2,000
genomes (2 pfu) per cell. Indicated parameters from co-infected cells were plotted. Virus-dependent parameters will not exhibit a correlation between GFP and mCherry fluorescence; cell-dependent parameters will. The Pearson correlation coefficient (r) is indicated in each panel. The virus determines the maximum, slope and infection time, but the cell determines the start point and midpoint. (B) Cells were infected with GFP-PV at an MOI of 500 genomes (0.5 pfu) per cell and monitored for 24 h. We divided events into two categories: those that failed to lyse during the 24-h time period (Infection), and those that lysed
A
uthor Man
uscr
ipt
A
uthor Man
uscr
ipt
A
uthor Man
uscr
ipt
A
uthor Man
uscr
(Infection & lysis). Comparison of the distributions of all parameters is shown. Infections with a non-lytic outcome showed a statistically significant reduction in the parameters for maximum, slope and infection time, parameters thought to be governed by the virus (Table S5). (C) Cells were infected with both GFP-PV and mCherry-PV at an MOI of 2,000 genomes (2 pfu) per cell and monitored for 24 h. We divided events as described above. Cells that were co-infected and failed to lyse over the 24-h time period were analysed for correlations as described in panel A. In addition to parameters for start-point and midpoint, infected cells that failed to lyse exhibited strong correlation now in the parameters for maximum and slope, suggesting that the cell contributes substantively to the lytic/non-lytic fate of the cell post-infection.
A
uthor Man
uscr
ipt
A
uthor Man
uscr
ipt
A
uthor Man
uscr
ipt
A
uthor Man
uscr
Figure 6. Insight into the mechanism of attenuation of a mutator PV
Cells were infected at the indicated MOI with either WT PV or a mutant that exhibits a mutator phenotype, referred to here as H273R. WT was compared to H273R at the two multiplicities indicated by evaluating the distributions for the values of the maximum (A,B), slope (C,D) midpoint (E,F), start point (G,H) and infection time (I,J). This analysis revealed a significant delay in the start point for H273R relative to WT (Table S6). Analysis of the percentage of infected cells (K) revealed a reduction in infections established by H273R relative to WT at low MOI. Data are represented as means ± SD for three biological replicates.
A
uthor Man
uscr
ipt
A
uthor Man
uscr
ipt
A
uthor Man
uscr
ipt
A
uthor Man
uscr
Figure 7. Selective extinction of the most-fit members of the viral population by an antiviral ribonucleoside
GFP-PV was used to infect cells grown in the absence or presence of 50 μM 2′
-C-methyladenosine (2′-C-meA), the IC50 value for this compound. Infected cells were loaded in the device and growth continued in the absence or presence of the drug. (A) Percentage of infected cells was reduced by roughly half in the presence of 2′-C-meA. Data are
represented as means ± SD for three biological replicates. (B) The distribution of values for the maximum showed that cells with high values were preferentially eliminated by drug treatment. (C) The distribution of values for the slope showed that cells with high values were preferentially eliminated by drug treatment. (D,E,F) The distributions of values for the (D) midpoint, (E) start point and (F) infection time were unaffected by drug treatment. (G) A 2D analysis of values for the maximum versus values for the slope showed elimination of the most efficient replicators in the population by the drug. Area eliminated in presence of drug is highlighted in yellow.