STRUCTURE OF AGRICULTURAL PRODUCTION FOR SUD-VEST
OLTENIA DEVELOPING AREA (2009-2011)
MEDELETE D.M., PÂNZARU R.L.
Faculty of Agronomy, University of Craiova
Key words: total production, crop production, livestock production, services, percentage, contribution
ABSTRACT
The paper aims to specify the structure of agricultural production for the counties of the Southern Development Region - West Oltenia, with its main industries specific to agriculture: crop production, livestock production and service sector. Attempting forming an overview regarding the relative importance of each type of activity and each administrative territorial units - regionally.
INTRODUCTION
For Romania's national economy, agriculture is a key industries, serving to satisfy the population's agri-food consumption, materials manufacturing, export availabilities, etc. Even for developed countries economically (USA, Canada, Germany, France etc.), agriculture is characterized by high levels of modernization and economic efficiency, special situations being in the US and Canada, countries that are large exporters of agricultural products.
Romanian Agriculture is an industry producing goods - plant and animal - with a long tradition and has favorable natural conditions.
Place of agriculture in the economy of a country can be assessed by two categories of parameters: endogenous and exogenous.
Production Branch activities relatively homogeneous groups down menus to obtain certain goods or services, characterized by the joint nature of the products produced, specialization of labor, community and technology inputs.
Production branch is part of the production activity of the agricultural unit, which are characterized by communion finished product, the means used and the qualifications of the workforce.
Specific features that define a particular branch of production and which are individualized: the finished product obtained and its economic destination; the means of production used and applied technology; determinant of labor specialization.
METHOD AND MATERIAL
Preparation of the study appealed to comparison method in time and space. Besides temporal sequences included in the analysis, it was also used their media.
Comparison method. This method appreciates the results of a farm and compare them with the baseline that can be appealed. The comparison can be done in time, in space, or may be a mixed one.
Time comparison follows the evolution of a phenomenon dynamic for a certain period, and highlights the deviations to the terms of reference with which it operates.
Combined comparison, is made based on combining both types previously submitted, aiming to examine the technical and economic processes and phenomena and the results of the farm.
Correct use of comparison method implies certain conditions which guarantee the comparability of data: presentation of results using the same system of indicators; ensure the unitary character of the contents, methodologies and metrics of the indicators used. Comparison shows a general image upon researched processes and phenomena trend, this is based on their analysis in parallel to the terms of reference. If technical and economic analysis deals with the issue in terms of cause-effect relationship, the comparison is geared toward examining the effects.
For this work it was used agricultural production value, expressed in lei current prices for the period 2009 - 2011. Level of the indicator is presented both as a whole and for the three component sectors of agriculture: crop production, animal production and nature of services zone.
To perform the work it was appealed to setting of structure parameters for total production, taking into account the three components: crop production, livestock production and services. Simultaneously there were used the dynamic indices: indices with fixed base and mobile base indices or chain.
RESULTS AND DISCUSSIONS
Table 1 presents data for agricultural production structure, over 2009-2011, for the South - West of Romania.
Table 1. South-West - The structure of agricultural production (2009 - 2011) *
-Thousand lei
c.p.-Year Total
Vegetal Animal Services
Effective % din
total Effective
% din
total Effective
% din total
2009 7026696 4515577 64,26 2437556 34,68 73563 1,06
2010 7192228 5200363 72,30 1946137 27,05 45728 0,65
2011 8740835 6604846 75,56 2107842 24,11 28147 0,33
Average
2009 - 2011 7653253 5440262 71,08 2163845 28,27 49146 0,65 Share at national
level (%) 11,43 12,23 - 9,89 - 7,96
-*http://www.dolj.insse.ro/cmsdolj/rw/pages/R42.ro.do
In the case of 2009, total agricultural production has reached a level of 7026696 thousand lei, of which, vegetable sector held a share of 64.26%, followed - downward - by the livestock sector with 34.68% and the agricultural services 1.06%. Related of the weights aforementioned the three sectors of activity recorded absolute values of total production: 4515577, 2437556 and 73563 thousand lei - crop production, livestock and supply of services respectively.
For 2010, the area is characterized by total sectorial production of 45728 thousand lei for services, 1946137 thousand lei for industry livestock and 5200363 thousand lei at the level of crop production, values that determine the general value of the indicator 7192228 thousand lei. Based on the data above, it was determined the structure of the indicator showing weights of 0.65% for services, livestock 27.05%, 72.30% vegetable production sector.
this case the descendant share of sectors in total is 75.56%, 24.11% and 0.33% - crop production, animal husbandry, and service charges.
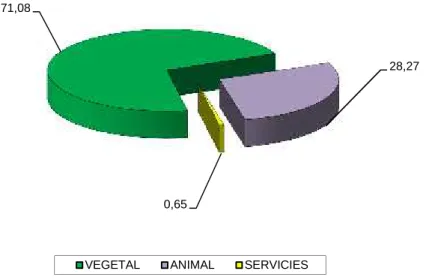
Data for the years 2009, 2010 and 2011 led to an average of the period of 7653253 thousand lei - general level of the indicator - in whose structure (Fig. 4.1.) are found, in descending order: the production plant – 71,08% and 5440262 thousand lei; livestock – 2163845 thousand lei 28.27% respectively; and the providing services for agriculture -0.65% 49146 thousand lei.
Figure.1. South - West. Agricultural production structure (%) - period average
Based on existing values in the table, the region's share was determined at national level, leading to the following position: 11.43% for total production; 12.23% for plant production; 9.89% in livestock production; 7.96% for services.
The data in Table 2 presents the evolution - in dynamics – of total agricultural production and for the indicator in three sectors of the domestic component of economic activity.
Table 2. South - West - Agricultural production, dynamic*
Year Total Vegetal Animal Service Ibf Ibm Ibf Ibm Ibf Ibm Ibf Ibm 2009 100 100 100 100 100 100 100 100 2010 102,4 102,4 115,2 115,2 79,8 79,8 62,2 62,2 2011 124,4 121,5 146,3 127,0 86,5 108,3 38,3 61,6 Average
2009 - 2011 108,9 87,6 120,5 82,4 88,8 102,7 66,8 174,6 *own calculation
In case of total agricultural production, time evolution, is strictly upward. In this regard, bear witness the above par values of fixed and mobile based indices that make up the dynamic (except those with low mobile base in the period average - 87.6% compared to term of reference 2011). The first category of indicators those with fixed base -exceeding the reporting base - 2009 -, the increase was 2.4, 8.9 and 24.4% in 2010 and in the case of the average of the period of 2011. At the level of mobile base indices, annual exceeding of comparison terms were 1.04 times and 1.21 times in 2010 in the case of 2011.
71,08
28,27
0,65
Referring to the situation of vegetable production sector, stands out the exceeding of reporting base by 1.15 times in 2010 compared to 2009, exceeding of comparison terms by 1.27 and 1.46 times in 2011. For period average fixed base indices are above -120.5%, while mobile base indices are lower that reporting value by 17.6%.
If we refer to the specific situation of livestock sector, sequentially we see: for 2009 a decrease compared to baseline by 20.2%; in 2010 an exceeding of 1.08 times for the situation of previous year and a decrease of 13.5% compared to the first term of dynamical series; the average period is superior by 2.7% to the previous term of the dynamic series and decreased compared to 2009 by 11.2%.
For the service sector, value of production achieved falls in 2010 and 2011 compared with all reporting databases. The fixed base indices are strictly below par (62.2 and 38.3% respectively in 2010 and 2011), as well as those with mobile base - 62.2 and 61.6% (for the years mentioned above). The average period is lower by 33.2% compared to the first reference term, but outruns by 1.74 times the second term of comparison.
Table 3 presents a summary of regional structure in total agricultural production (average of reporting period) and by sector (crop production, animal husbandry, agricultural services - based on the values associated with the production obtained in each county).
Table 3. South - West. County agricultural production structure - Average 2009 - 2011*
-%-Specification
Production
Total Vegetal Animal Service
Effective mii lei pc
-Str.
-%-Effective mii lei pc
-Str.
-%-Effective mii lei pc
-Str.
-%-Effective -mii lei pc
-Str.
-%-Dolj 2192302,7 28,65 1635449,7 30,06 515998,7 23,85 40854,3 83,13 Gorj 1112204,2 14,53 713537,2 13,12 397827,3 18,39 839,7 1,71 Mehedinți 1115497,7 14,57 784046,3 14,41 330805,4 15,29 646,0 1,31 Olt 1990426,7 26,01 1426376,7 26,22 558109,7 25,79 5940,3 12,09 Vâlcea 1242821,7 16,24 880852,0 16,19 361104,0 16,68 865,7 1,76 Total regional 7653253,0 100 5440262,0 100 2163845,0 100 49146,0 100
*own calculation
The existing situation for total output, have the following structure (fig. 2): 14.53% Gorj County; 14.57% Mehedinti County; Valcea 16.24%; Olt 26.01%; 28.65% Dolj County.
Regarding the structure of crop production dominates Dolj and Olt counties weights of 30.06 and 26.22% respectively (over half the regional production), followed by 16.19% Valcea, Mehedinti with 14.41 % and finally with 13.12% Gorj (and order situation is similar to the one above (fig. 3).
Figure. 2. South West region. Agricultural production - the county structure (%)- Period average
Figure. 3. South West. Crop production - county structure (%)
- Period average
Figure 4. South West Region. Agricultural production Livestock - county structure (%) - Period average
The production value generated by services, present the most imbalances structure, predominantly being Dolj County with 83.13%, followed far from Olt County with 12.09%. Other counties represents between 1 and 2% of the total, as follows (fig. 5): 1.76% Valcea, Gorj 1.71%, 1.31% County.
DOLJ GORJ
MEHEDINȚI
OLT VÂLCEA
28,65 14,53
14,57
26,01 16,24
DOLJ GORJ
MEHEDINȚI
OLT VÂLCEA
30,06 13,12
14,41
26,22 16,19
DOLJ GORJ
MEHEDINȚI
OLT VÂLCEA
23,85 18,39
15,29
Figure. 5. South West. Agricultural production services - county structure (%) - Period average
CONCLUSIONS
a. South – West Region is noted in all components, of dynamical series, the preponderance of vegetable production sector (over 64% - 64.26, 72.30 and 75.56% in 2009, 2010 and respectively for 2011), followed at a considerable distance of sector the animals (24.11, 27.05 and 34.68% for the years 2011, 2010 and 2009), while supplies of services exceeded the threshold of 1% only in 2009. As a result appears the need to reconsider sectors of livestock and provision of services;
b. At regional level is noted a certain balance between Dolj and Olt counties in terms of predominance - in structure (the two argued over the first two places overall for crop production - prevails Dolj + 3.84% and 2.64% while at livestock production Olt exceeds Dolj county by 1.94%). Unfortunately at the level of provision of services, Dolj does not have any competition (83.13%). Among the remaining counties are not huge differences: 1.71% overall, 3.07% for plant production, livestock 3.1% and 0.45% in the business services;
c. should be emphasized the need to reinvigorate at regional level livestock production, especially for Valcea, Gorj and Mehedinti, who have great potential, at least through the existing natural grassland in the territory.
BIBLIOGRAPHY
1. Barbu C., Pânzaru R.L., 2000, Agrarian Economy, Hyperion Publishing House, Craiova
2. Pânzaru R.L., Medelete D. M., 2005, Agrarian Economy, Applications, Ed. Universitaria Craiova
3. Pânzaru R. L., Medelete D. M., Ștefan G., 2007, "Elements of management and marketing in agriculture" Universitaria Craiova.
4. Pânzaru R. L., Medelete D. M., Ștefan G.,2009"The economy crop production" Universitaria, Craiova
5. Ştefan G., Bodescu D., Toma A.D., Pânzaru R.L., 2007,Economic and agro-food chain, Ed. Alfa Iaşi
6. *http://www.dolj.insse.ro/cmsdolj/rw/pages/R42.ro.do
DOLJ GORJ
MEHEDINȚI
OLT VÂLCEA
83,13 1,71