Accredited by RISTEKDIKTI, Decree No: 32a/E/KPT/2017
doi: 10.14203/jet.v19.51-56
Active Filter Analysis on Designing Electronic Stethoscope
Prihatin Oktivasari
a,*, Riandini
b, Rahmah A. Fitri
b, Sungguh I. Malaon
b aDepartment of Informatic and Computer EngineeringPoliteknik Negeri Jakarta Kampus UI Depok
Depok, Indonesia b
Department of Electrical Engineering Politeknik Negeri Jakarta
Kampus UI Depok Depok, Indonesia
Abstract
Early heart disease detection could be vital and some other diagnostic ways are being developed. In this paper, a low-cost tool for a diagnostic that analyzes the digitized heartbeat sound is given. This can be used to detect heart anomalies. The instrument shows the heart sound and also keeps a patient's long-term record for future use. The signal from the heart provides a lot of knowledge about the heart and offers an initial diagnosis recommendation. The electronic stethoscope uses the condenser microphone, preamplifier circuit, and filter circuit. The optimum filter is Butterworth with a fourth-order Sallen key low pass filter topology with a gain of 0.707 volts, -3.01 dB, and a fourth-order high pass filter with a gain of 0.782 volts, -2.137 dB. The frequency of the heart sound is about 20 Hz – 120 Hz in general. Therefore, the lower cutoff frequency of the filter is set to 20 Hz, while the higher cutoff frequency set to 120 Hz. The evaluation used to measure the performance of an electronic stethoscope is to compare with a conventional stethoscope, the recorded sound is the same.
Keywords: Filter, amplifier, condenser mic, electronic stethoscope
I. INTRODUCTION
Cardiac disease is one of the real medical problems and one of the most important causes of death in the world [1]. Heart auscultation, well known in clinics, was an essential technique for the early diagnosis of coronary disease by capturing heart murmurs. Cardiac murmurings can reveal many obsessive cardiovascular disorders, for example, cardiomyopathy, arrhythmia, valve disease, etc. The heart sound signal contains a lot of heart information for further diagnosis. While the sound of the heart is very subjective, it depends mostly on the doctor's experience, skills and hearing capacity [2]-[3]. Other than that, human ears are restricted by the intrinsic constraint, the most sensitive frequency range of which is 1000~3000 Hz, with low-frequency sensitivity [2]-[3]. Nevertheless, the medically useful frequency range of heart sound is often distributed within the 20~600 Hz area, so some significant low frequency and low-intensity heart sounds are complicated to record [4]-[5]. With rising lifestyles and chronic heart disease in Indonesia, there is a need to start and periodically analyze heart health status to keep away fatal situations. The implementation of early detection systems for wireless heart encourages to improve the quality of life of chronic patients by improving the quality of the initial diagnosis through a stethoscope examination [6]-[7]. Furthermore, without programming to record the patient's heart
sounds, Cardiologists find it hard to record cardiovascular tones that are an uncommon event and to understand the progression of coronary disease. Non- stop heart monitoring can provide information on the development of physiological indicators over the long term. With these aspects in mind, it is important to improve stethoscope innovation, and the advantages of the electronic stethoscope are impressive.
Currently, equipment for cardiovascular auscultation mostly collects signals via sensors to the heart and after that transmits them to a computer that functions as a display unit and for further research analyses the rhythm of the heart. An electronic stethoscope overcomes the limits of a conventional stethoscope by converting the sound data into electrical signals, which can be amplified, stored, replayed, and sent to an expert. Given this, a low-cost electronic stethoscope that can be interfaced with a computer has been developed. Sounds from different locations can be captured using an electret condenser microphone in this instrument. The sound captured is filtered, amplified, and digitally processed to getting audible and distinct heart sounds.
This research presents an electronic stethoscope that uses wireless technology, implemented using Arduino Nano, Bluetooth technology, and represented for further diagnosis of heart physiology in computers. Bluetooth HC05 selected as the cheap Bluetooth module with low power consumption characteristics, small size, and a moderate date for RF families [8]. The portable power efficiency capacity, simplification of operation, and efficiency in cost make the prototype of hardware more acceptable to clients. Moreover, if manufactured on a large scale, the price of the system proposed would be * Corresponding Author.
Email: [email protected]
Received: July 27, 2019 ; Revised: November 04, 2019 Accepted: November 20, 2019 ; Published: December 31, 2019
2019 PPET - LIPI
much lower. The heart sound data is transmitted to the computer wirelessly to display visually, which helps the user to get intuitive data.
Many commercially electronic stethoscopes are available on the market at fifteen to twenty million prices. The Littman Electronic Stethoscope Model 3000 from 3M [9] is one of them. Up to 18 times more amplification than the best non-electronic stethoscopes. Another electronic stethoscope model CE-3D21 was commonly used. The amplification is up to 18 times larger than the standard acoustic scope, and 8-level volume controls are integrated.
The objective of this study is to examine whether the commonly used methods for developing cost-effective and flexible electronic stethoscope filtering with the improved performance of various analog filters used for the processing of electronic stethoscope signals. The features were also compared in the time, and frequency domains differentiate between normal and abnormal heart sounds. Furthermore, some clinical heart sounds, which were collected by the heart sound acquire the system from cardiovascular disease center of the hospital in Bekasi Indonesia, are analyzed to validate the instrument and system of the electronic stethoscope.
II. HEART SOUND
The first action is the electrical activation of the heart during the cardiac cycle, which then leads to the contraction of the atrial and ventricular activity, forming a mechanical activity. The mechanical activity by the opening and closing of the heart valves, causing the blood flow to start or stop suddenly. The results of this action form the vibrations of the entire structure of the heart [10].
These vibrations can be heard on the wall of the chest, which consists of four sites: aortic, pulmonary, tricuspid, and mitral [11]. The stethoscope was placed in the mitral area, where the heart sounds of the heart better heard. Acoustic sounds of the heart are created when the muscles of the heart open blood valves from chamber to chamber. A healthy-heart sound produces two heart sounds, S1 and S2 [12]. When the mitral and tricuspid valves close after the blood returned from the body and the lungs, the sound is generated. The normal and abnormal heart sound grouping displayed in Figure 1. S1 consists primarily of energy in the 30 Hz-45 Hz range. S2 symbolizes the end of the systole and the diastole start. The First Heart Sound (S1) is provided by the atrioventricular valve closure, and the second Heart Sound (S2) is produced by the semilunar valve closure. In the event of abnormal Heart Sound, various signals between S1 and S2 such as S3, S4, murmur, etc as shown in Table 1.
The heart sound is generated when the aortic and pulmonary valves close as blood leaves the heart to the body and lungs with maximum energy in the 50 Hz-70 Hz range with a higher pitch. Heart sounds and murmurs are typically relatively low intensity and limited to about 100-1000 Hz. Meanwhile, the voice signal is perceptible to the human being's listening. Consequently, acoustic stethoscope auscultation is difficult [14].
TABLE 1
CHARACTERISTICS OFMURMURS [13]
Murmur type
Location Timing Pitch Quality
Mitral stenosis (MS)
Apex Diastolic Low Rumbling
Mitral regurgitation (MR)
Apex Systolic High Blowing
Aortic stenosis (AS)
Apex/right upper sternal border
Systolic High Harsh
Aortic regurgitation (AR) Right upper sternal border/left third/fourth intercostal space (ICS)
Diastolic High Blowing
Tricuspid The lowers (TS)
The lower right and left sternal borders
Diastolic High Rumbling
Tricuspid regurgitation (TR)
Left fourth ICS Diastolic High Blowing
Pulmonary stenosis (PS)
Left second ICS
Systolic High Blowing
Pulmonary regurgitation (PR)
Second/third ICS
Diastolic High Blowing
Mitral valve prolapse (MVP)
Apex Mid-late
systolic
High Blowing
Ventricular septal defect (VSD)
Left a lower sternal border
Systolic High Harsh
Patent ductus arteriosus (PDA)
Left an upper sternal border
Continuou s
High Harsh
Hypertrophic cardiomyopat hy (HOCM)
Left a lower sternal border
Mid-late systolic
High Harsh
Figure 1. Normal and abnormal auscultogram heart sounds [15]
III. DESIGN OF SYSTEM
output of a condenser mic that captures the heartbeat sound. Analog circuits consist of a pre-amplifier, low pass filter (LPF), and a high pass filter (HPF). The signal conditioning circuit in the heart detection device is essential because the heartbeat signal captured by the condenser microphone converted into an electrical signal with a small voltage and noise. The signal conditioning circuit consists of a pre-amplifier circuit, which functions to amplify the output voltage of the condensor mic. The LPF circuit with a 200 Hz cutoff frequency will pass signals with frequencies below 200 Hz and cut signals with frequencies above 200 Hz, and the HPF circuit with the 20 Hz cutoff frequency will pass signals with frequencies above 20 Hz and cut signals with frequencies below 20 Hz. The output signal from the signal conditioning circuit is processed by Arduino to be sent to the PC wirelessly using the Bluetooth module HC-05. The widespread and low-energy capabilities of Bluetooth improve compatibility and reduce the power consumption of this system. The design concept of an electronic stethoscope is shown in Figures 2 and 3, by representing The Signal Conditioning Circuit, and full schematic electronic stethoscope.
The first step to creating an electronic stethoscope is to determine what type of filter is suitable for the signal conditioning circuit so that the heartbeat signals displayed have a clear shape for Lub (S1) and Dub (S2) patterns. In this case, the Butterworth, Chebyshev, and Bessel filters were tested with 1st order to 4th order. The
results of the simulation can be seen from the signal response to the cutoff frequency based on the order and type of filter. The best filters will be used in the implementation of electronic stethoscope devices. Calculations were also performed on the signal conditioning circuit. After the circuit is made, then the next method is to test the circuit with a function generator and Oscilloscope. The final results are displayed on a computer.
IV. RESULTS
The filter section constructed with a bandwidth filter system with the frequency range of most heart sound signals. The use of a bandpass filter with the proper selection of passbands not only prevents aliasing but also removes certain noises outside the passband. The filtered signal amplified in post-amplification to the level range required by the analog [16]. An electronic stethoscope
Pre-Amp
Circuit LPF circuit HPF circuit
Figure 2. Block diagram of the signal conditioning circuit
Pre-Amp
Circuit LPF circuit HPF circuit
membrane stethoscope
Mic Condensor
arduino bluetooth
Computer
Figure 3. Block diagram of an eectronic stethoscope
records the heart sound and the associated electronics for the data acquisition module in digital signals and sends it to the preprocessing module.
A. Filter Type
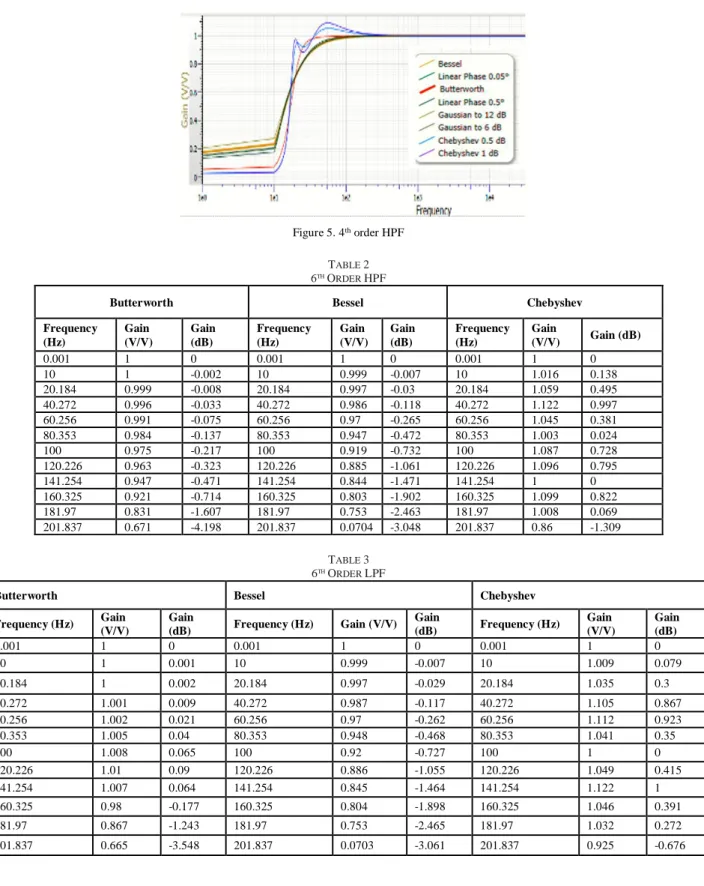
Choosing the right filter to get an accurate stethoscope signal display needs to be done. The first simulation is done on several types of active filters, among others, Butterworth filter, Bessel Filter, and Chebyshev Filter. The filter to be used should be the one that produces no ripple, is stable, and can continue the frequency for the stethoscope signal. The results of the filter type response can be seen in Figures 4 and 5, for example, LPF and HPF on the 4th order. It appears that the trend for Bessel and Butterworth has almost the same pattern, but it is very different from the Chebyshev response pattern, which is the ripple. Based on the simulation results of the filter, the best filter results are obtained using Butterworth 4th order, because the frequency response to the cutoff on the 4th order Butterworth filters is sharper than the Bessel filter and does not have the same as in the Chebyshev filter. In the Butterworth Gain reaching 0 V occurs at 1.3 kHz, the Chebyshev gain reaches 0 V happens at the frequency of 1 kHz, and at the Bessel gain reaching 0 V occurs at a rate of 2 kHz.
B. Order Filter
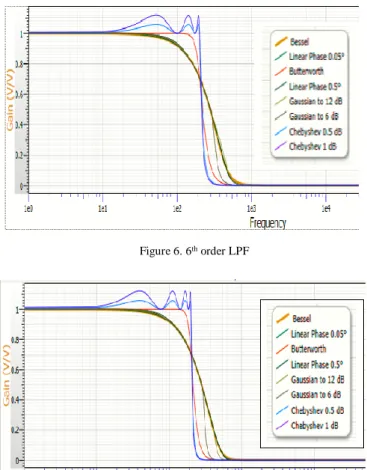
The performance comparison of several types of filters, namely Butterworth, Bessel and Chebyshev for 6th order is depicted in Table 2 and Table 3. The Gain response was very significant as seen in Gain (Volt) and Gain (dB) column. As shown in Figures 6, 7, 8, and 9, the frequency response of Chebyshev filter has more ripple patterns compared to other types. Hence, the Chebyshev filter is not suitable since the heart signal is stationary. As for the Butterworth and Bessel filters, they can still be applied, but there is still a sharper response to Butterworth than Bessel. Based on Figures 6 and 7 for the 6th and 8th order, the LPF shows that there is no significant difference in filter response. Likewise, for differences in the 6th and 8th order’s responses on HPF seen in Figures 8 and 9 are not very substantial, but there are far differences in 4th and 6th orders, then in this paper use the 4th order.
Figure 5. 4th order HPF
TABLE 2 6THORDER HPF
Butterworth Bessel Chebyshev
Frequency (Hz)
Gain (V/V)
Gain (dB)
Frequency (Hz)
Gain (V/V)
Gain (dB)
Frequency (Hz)
Gain
(V/V) Gain (dB)
0.001 1 0 0.001 1 0 0.001 1 0
10 1 -0.002 10 0.999 -0.007 10 1.016 0.138
20.184 0.999 -0.008 20.184 0.997 -0.03 20.184 1.059 0.495
40.272 0.996 -0.033 40.272 0.986 -0.118 40.272 1.122 0.997
60.256 0.991 -0.075 60.256 0.97 -0.265 60.256 1.045 0.381
80.353 0.984 -0.137 80.353 0.947 -0.472 80.353 1.003 0.024
100 0.975 -0.217 100 0.919 -0.732 100 1.087 0.728
120.226 0.963 -0.323 120.226 0.885 -1.061 120.226 1.096 0.795
141.254 0.947 -0.471 141.254 0.844 -1.471 141.254 1 0
160.325 0.921 -0.714 160.325 0.803 -1.902 160.325 1.099 0.822
181.97 0.831 -1.607 181.97 0.753 -2.463 181.97 1.008 0.069
201.837 0.671 -4.198 201.837 0.0704 -3.048 201.837 0.86 -1.309
TABLE 3 6THORDER LPF
Butterworth Bessel Chebyshev
Frequency (Hz) Gain (V/V)
Gain
(dB) Frequency (Hz) Gain (V/V) Gain
(dB) Frequency (Hz)
Gain (V/V)
Gain (dB)
0.001 1 0 0.001 1 0 0.001 1 0
10 1 0.001 10 0.999 -0.007 10 1.009 0.079
20.184 1 0.002 20.184 0.997 -0.029 20.184 1.035 0.3
40.272 1.001 0.009 40.272 0.987 -0.117 40.272 1.105 0.867
60.256 1.002 0.021 60.256 0.97 -0.262 60.256 1.112 0.923
80.353 1.005 0.04 80.353 0.948 -0.468 80.353 1.041 0.35
100 1.008 0.065 100 0.92 -0.727 100 1 0
120.226 1.01 0.09 120.226 0.886 -1.055 120.226 1.049 0.415
141.254 1.007 0.064 141.254 0.845 -1.464 141.254 1.122 1
160.325 0.98 -0.177 160.325 0.804 -1.898 160.325 1.046 0.391
181.97 0.867 -1.243 181.97 0.753 -2.465 181.97 1.032 0.272
Figure 6. 6th order LPF
Figure 7. 8th order LPF
Figure 8. 6th order HPF
Figure 9. 8th order HPF
C. Experimental
Preprocessing includes slow pass resampling standardization of frequency. The frequency band of normal heart sounds, so the 4th passband Butterworth filter of the 20 - 200 Hz cut off rate is applied to the heart sound signal. The design of a low-cost electronic stethoscope can be seen in Figure 10, with component modification in the amplifier circuit and filter circuit, especially in the component values of capacitors and resistors. In the preliminary step, we tested the functionality of the implementation filter; an amplifier circuit uses an oscilloscope and serial monitor with Arduino shown in Figures 11 and 12, in which the sample is in the age range of 18-25 years.
Based on testing the tool can be seen in Figures 11, and 12 shows the same pattern between the devices through the serial Arduino monitor and with the oscilloscope. It has shown the existence of S1 and S2 patterns, but to send signal data with Arduino and Bluetooth experience a delay of about 2 seconds. S3 and S4 patterns which are a murmur abnormality that has not been detected because the frequency is shallow [17]. An S3 corresponds to the fast filling of the ventricle in early diastole. It can happen in healthy kids and adults, particularly if the volume of stroke increases. However, an S3 should be considered abnormal after approximately 40 years of age; this caused by conditions that increase the size of early diastole ventricular filling (e.g., mitral regurgitation) or that increase pressure in early diastole (e.g., advanced heart failure) [18]. S4 is rarely heard in young people but is common in adults over the age of 40 or 50 due during atrial contraction to reduce ventricular compliance. It almost occurs in patients who have hypertension, heart failure, or cardiac ischemic disease [18].
Based on the results obtained in Figures 11 and 12, it has been shown that with the combination of Butterworth LPF and HPF filters, got significant results to show the regular signal pattern in a Figure 1 pattern when compared to using only one filter that is only Butterworth LPF [19]-[20], the results are still far from the expected normal pattern according to Figure 1.
Figure 11. The signal of normal S1 and S2 heart sounds displayed on a serial monitor with Arduino
Figure 12. The signal of regular S1 and S2 heart sounds displayed on the oscilloscope
CONCLUSION
The optimum filter for detecting heart rate signals is 4th order Butterworth. 4th order Butterworth filter has sharper and no ripple frequency response at cutoff. On the high pass 4th order Butterworth high pass filter, the gain is 0.782 V, -2.137 dB on the cutoff 20 Hz, and the low pass filter gain 0.707 V, -3.01 dB at the cutoff of 200 Hz.
ACKNOWLEDGMENT
For the funding of our research, we would like to thank the Ministry of Higher Education Research and Technology.
REFERENCES
[1] D. Satheeswari, D. Snekha, M. Sangavi, “Design and implementation of digital stethoscope with disease identification,” Int. J. Innovative Research Comput. Commun. Eng., vol. 5, no. 3, pp. 46-52, Apr. 2017.
[2] R. E. Pérez-Guzmán, R. García-Bermúdez, F. Rojas-Ruiz, A. Céspedes-Pérez, and Y. Ojeda-Riquenes, “Evaluation of algorithms for automatic classification of heart sound signals,”
in Proc. Int. Conf. Bioinf. Biomed. Eng., Cham, Switzerland, 2017, pp. 536–545.
[3] G. Zhang,M. Liu,N. Guo, and W. Zhang, ”Design of The MEMS piezoresistive electronic heart sound sensor,“ Sensors, vol. 16, no. 11 1728, Nov. 2016.
[4] L. Zhao, Q. Li, Y. Shao, X. Zhu, “The comparative study of normal and abnormal heart sound signals,“ Chin. J. Med. Phys., vol. 3, pp. 154–156, 2000.
[5] J. C. Wood, A. J. Buda, D.T. Barry, “Time-frequency transforms: A new approach to first heart sound frequency dynamics,” IEEE Trans. Biomed. Eng., vol. 39, no. 7, pp. 730–740, 1992. [6] W. Haibin, H. Yuliang, J. Zhongwei, Z. Junqi, , C. Samjin, S.
Shuping, ”Heart sound measurement and analysis system with digital stethoscope,” in Proc. Asia Int. Symp. Mechatronics, Japan, 2018, pp. 26-30.
[7] Z. Zhao and S. He, “A heart sound transmission and reception system based on NFC and Bluetooth,” in Proc. Int. Conf. Health Inform., 2014, pp. 187–190.
[8] A. Cotta, T. Devidas, V. K. N. Ekoskar, “Wireless communication using HC05 Bluetooth module interfaced with arduino,” Int. J. Sci. Eng. Tech. Research, vol. 5, no. 4, pp. 869-872, Apr. 2016. [9] G. Mills, T. A. Nketia, I. Oppong, E. E. Kaufmann, “Wireless
digital stethoscope using bluetooth technolgy,” Int. J. Eng. Sci. Technology, vol. 4, no. 8, pp. 3961-3969, Aug. 2012.
[10] H. K. Walker, W. D. Hall, J. W. Hurst, Clinical Methods: The History, Physical, and Laboratory Examinations, 3rd ed. Boston: Butterworths, 1990.
[11] L. B. Dahl, P. Hasvold, E. Arild, “Heart murmurs recorded by sensor-based electronic stethoscope e-mailed for remote assessment,” Arch Dis Child, vol. 87, no. 4, pp. 297-301, 2002. [12] A. Mukherjee, N. Pathak, and A. Roy, “Heart murmur detection
using fractal analysis of phonocardiograph signals,” Int. J. Comput. Applicat., vol. 88, no. 12, pp. 30-35, Feb. 2014. [13] S. Leng, R. S. Tan, K. T. C. Chai, C. Wang, D. Ghista, and L.
Zhong, “The electronic stethoscope,“ BioMed. Eng. OnLine, vol. 14, 2015.
[14] K. Pariaszewska, M. Mlynczak, W. Niewiadomski, G. Cybulski “Digital stethoscope system - the feasibility of cardiac auscultation,” in Proc. Photonics Applicat. Astronomy Commun. Industry High-Energy Physics Experiment 2013, Poland, 2013. [15] Madhero. (2010) Phonocardiograms from normal and abnormal
heart sounds [Online]. Available:
https://commons.wikimedia.org/wiki/ File: Phonocardiograms_from_normal_and_abnormal_heart_sounds.p ng
[16] A K. Kumar and G. Saha, “Interpretation of heart sound signal through automated artifact-free segmentation,“ Heart Res Open J., vol. 2, no. 1, pp. 25-34, 2015.
[17] B. Erickson, Heart Sounds and Murmurs: A Practical Guide, 3rd
ed. Saint Louis: Mosby Year Book Inc., 1997.
[18] L. Goldman, A. Schafer, “Approach to the Patient with Possible Cardiovascular Disease,” in Goldman's Cecil Medicine, 24th ed.
Philadelphia: Saunders, 2012.
[19] R. M. Potdar, M. Meshram, and R. Kumar, “A review based design and implementation of electronic stethoscope for heart sound analysis,” Int. J. Eng. Development Research, vol. 3, no. 2, pp. 1057-1061, 2015.
![Figure 1. Normal and abnormal auscultogram heart sounds [15]](https://thumb-us.123doks.com/thumbv2/123dok_us/8094328.2144907/2.892.466.828.89.1013/figure-normal-abnormal-auscultogram-heart-sounds.webp)