Abstract
Background: Salvage chemotherapy regimens for patients with relapsed/refractory acute myeloid leukemia (AML) are associated with complete response rates of 30 -‐ 60%. Determining the superiority of one treatment over another is difficult due to the lack of comparative data. Clofarabine and cladribine based regimens appear to be superior to combinations of
mitoxantrone, etoposide, and cytarabine (MEC). However, there are no data comparing treatments with these purine analogs to each other. Therefore, we conducted a retrospective study of GCLAC (clofarabine 25 mg/m2 IV days 1-‐5, cytarabine 2 gm/m2 IV days 1-‐5, and G-‐CSF) and CLAG (cladribine 5 mg/m2 IV days 1-‐5, cytarabine 2 gm/m2 IV days 1-‐5, and G-‐CSF).
Methods: We identified 41 consecutive patients with pathologically diagnosed relapsed or refractory AML who received either GCLAC or CLAG between 2011 and 2014. The primary outcome was the complete response rate (CRi or CR) as defined by the International Working Group. Secondary outcomes included the percentage of patients who underwent allogenic stem cell transplant, relapse free survival (RFS), and overall survival (OS). Fisher’s exact and Wilcoxon Rank Sum tests were used to compare patient characteristics and response rates. The Kaplan Meier method and Log Rank tests were used to evaluate RFS and OS.
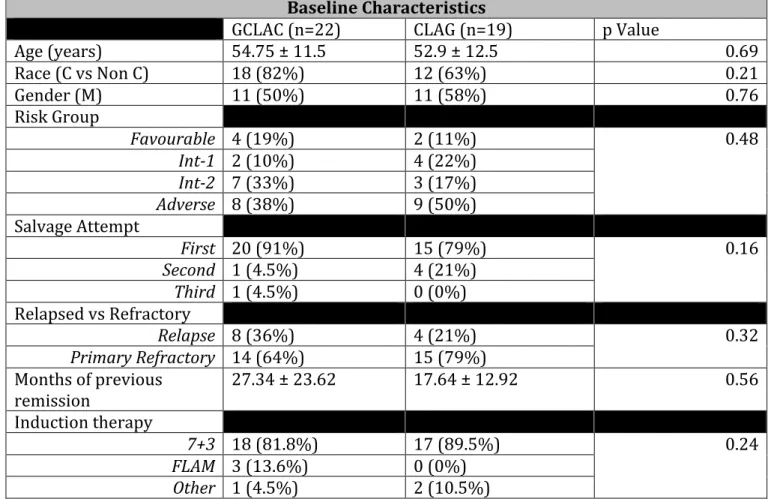
Results: We found no significant differences in the baseline characteristics of patients treated with GCLAC (n=22) or CLAG (n=19) including age, race, gender, organ function, or cytogenetic risk group (table 1). There were also no significant differences in the percentage of relapsed patients (36% vs. 21%), the average duration of the previous remission (28.6 vs. 19.4 months) or in their previous therapy. An anthracycline-‐based “7+3” regimen was given to 82% of the GCLAC patients and to 90% of the CLAG patients.
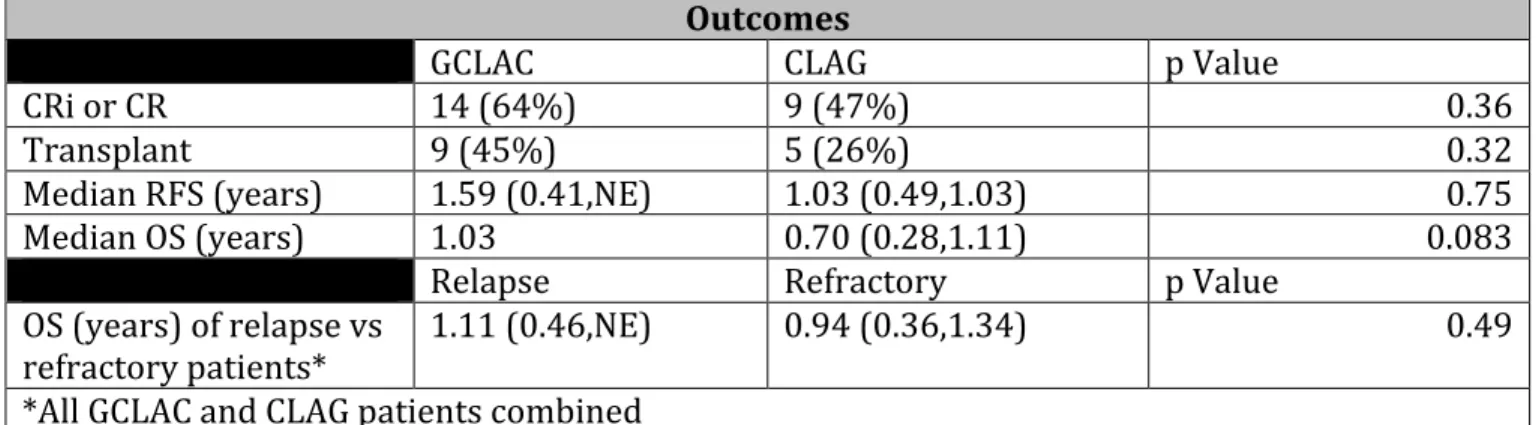
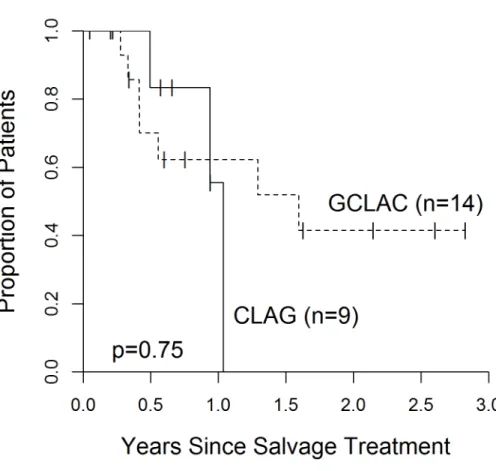
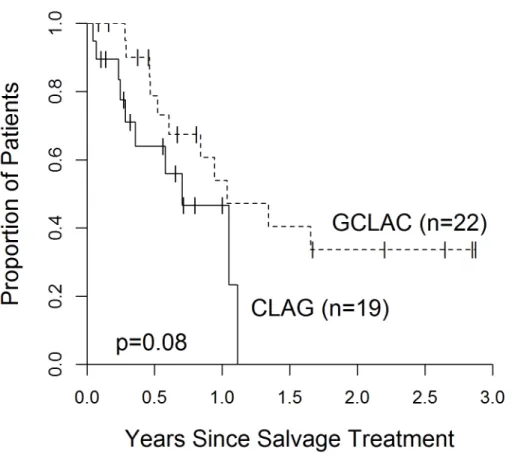
The outcomes with these two regimens were also not significantly different. Patients treated with GCLAC had a 64% CR/CRi rate compared with 47% for CLAG patients (p= 0.36). 45% GCLAC patients underwent allogeneic stem cell transplant compared with 26% of CLAG patients (p= 0.32). The median RFS on GCLAC and CLAG respectively was 1.59 years [0.41, non-‐estimable (NE)] and 1.03 years [0.49, 1.03], (p= 0.75). The median OS was 1.03 years [0.52, NE] and 0.70 years [0.28, 1.11], (p= 0.08).
Given the similarities of these regimens, we combined the data sets to compare the OS for patients with refractory AML to relapsed AML. The OS for patients with refractory AML was not significantly worse than patients with relapsed AML (0.94 years [0.36, 1.3] vs.1.11 years [0.46, not evaluable]; p=0.49).
Conclusion: We find no significant differences in outcomes using GCLAC or CLAG for relapsed/refractory AML patients. The trends in outcome that favored GCLAC are likely
Introduction
Acute myeloid leukemia (AML) is the most common type of acute leukemia in adults,
contributing to the largest number of leukemia-‐related deaths in the United States annually.1
While 60-‐80% of patients achieve a complete response (CR), AML is associated with a high rate of relapse2. To date, the only reliable cure in relapsed/refractory AML is salvage chemotherapy
followed allogeneic stem cell transplantation. There currently is not a preferred salvage induction regimen in relapsed/refractory AML patients. Anthracycline and/or antimetabolite containing chemotherapy regimens have been evaluated. Two of these regimens that have been evaluated in separate phase 2 trials are a cladribine-‐containing regimen (CLAG)3 and a
clofarabine-‐containing regimen (GCLAC)4. Both regimens were given in combination with high-‐
dose cytarabine and granulocyte colony-‐stimulating factor (GCSF). Although these are both effective salvage regimens, they have never been compared to each other. Our medical center has used both regimens to treat patients with relapsed/refractory AML. This single-‐institution
retrospective evaluation was performed to compare efficacy and safety of GCLAC vs. CLAG in relapsed/refractory AML patients.
Methods
The University of North Carolina Chapel Hill Investigational Review Board approved this study.
Study design
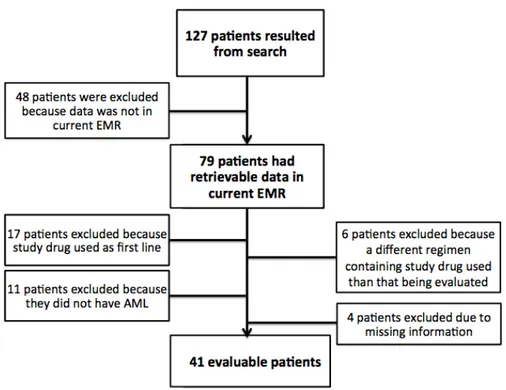
This retrospective, single cohort study took place at the University of North Carolina Medical Center (UNCMC). The UNCMC electronic medical records were queried to identify our patient cohort who had received treatment between January 2011 and December 2014. A patient list was generated by running a search with “clofarabine” and “cladribine” in patients age ≥ 18 years old. Of the 127 patients gathered from this search, 79 patients had retrievable data in the current electronic medical record and were considered for data collection. Patients were then included if they had a diagnosis of AML, treated at UNCMC, and treated with GCLAC or CLAG as salvage chemotherapy (n=41). Patients were excluded if they received either regimen for newly
diagnosed AML therapy (n=17), used either regimen for a disease other than AML (n=11), used cladribine or clofarabine as a part of a different treatment regimen than that being evaluated (n=6), or had missing information (n=4), (Figure 1).
Data Collection
The following variables were collected for each patient: sex, race, date of birth, AML type (de novo vs secondary AML), cytogenetics, first-‐line induction regimen, labs at start of induction, length of hospital stay for induction therapy, date of CRi or CR achieved post-‐induction, number of
consolidation cycles post-‐induction, transplant status post-‐induction, type of progression
(relapsed or refractory), salvage regimen used (GCLAC or CLAG), months from CR or CRi to start of salvage therapy, months from last induction, labs at start of salvage therapy, length of hospital stay for salvage therapy, date of CRi or CR post-‐salvage, number of consolidation cycles post-‐ salvage, transplant status post-‐salvage, time to transplant, time to progression (PFS), overall survival (OS). Per the European Leukemia Net (ELN) response criteria, patients who achieved CR had to have a pre-‐consolidation ANC>1,000, a pre-‐consolidation platelet count > 100,000, and a normal pre-‐consolidation bone marrow biopsy. Patients who achieved a CRi had to have met the CR criteria except for the platelet count > 100,0005. Relapsed disease was defined as holding a
remission for 6 months or more after initial reduction. Information about side effects of each regimen was collected from the progress and discharge notes as provided by the provider. As myelosuppression was seen unanimously in both treatment groups, cytopenias were not collected in the toxicity portion of this study.
Treatment
Patients treated with the GCLAC regimen received clofarabine 25 mg/m2 IV days 1-‐5, cytarabine
2000 mg/m2IV on days 1-‐5, and filgrastim 5 μg/kg starting day -‐1 until ANC was ≥2000 for/μL for
2 days. Patients treated with the CLAG regimen received cladribine 5 mg/m2 IV on days 1-‐5,
cytarabine 2000 mg/m2 IV on days 1-‐5, and filgrastim 300 mcg on days -‐1 to 5.
Statistical Analysis
Fisher’s exact and Wilcoxon Rank Sum tests were used to compare patient characteristics and response rates. The Kaplan Meier method and Log Rank testes were used to evaluate RFS and OS. All analyses were performed using SAS statistical software v9.4 (Cary, NC).
Results
Baseline Characteristics
There were 41 total patients enrolled in this study who had received salvage chemotherapy at UNC Medical Center (Table 1); 22 patients received GCLAC and 19 patients received CLAG. There was no significant difference in the percentage of relapsed patients (36% in GCLAC vs. 21% in CLAG; p=0.32). There was no significant difference in average duration of previous remission in either group (27.34 months in GCLAC vs 17.64 months in CLAG; p=0.56). 7+3 was given as initial induction to 81.8% of the GCLAC patients and 89.5% of the CLAG patients.
Baseline Characteristics
GCLAC (n=22) CLAG (n=19) p Value
Age (years) 54.75 ± 11.5 52.9 ± 12.5 0.69
Race (C vs Non C) 18 (82%) 12 (63%) 0.21
Gender (M) 11 (50%) 11 (58%) 0.76
Risk Group
Favourable 4 (19%) 2 (11%) 0.48
Int-‐1 2 (10%) 4 (22%)
Int-‐2 7 (33%) 3 (17%)
Adverse 8 (38%) 9 (50%)
Salvage Attempt
First 20 (91%) 15 (79%) 0.16
Second 1 (4.5%) 4 (21%)
Third 1 (4.5%) 0 (0%)
Relapsed vs Refractory
Relapse 8 (36%) 4 (21%) 0.32
Primary Refractory 14 (64%) 15 (79%)
Months of previous
remission 27.34 ± 23.62 17.64 ± 12.92 0.56
Induction therapy
7+3 18 (81.8%) 17 (89.5%) 0.24
FLAM 3 (13.6%) 0 (0%)
Other 1 (4.5%) 2 (10.5%)
Table 1. Baseline Characteristics
Efficacy Outcomes
Patients with GCLAC had a 64% CR and CRi rate compared with 47% for CLAG patients (p=0.36). Of patients receiving GCLAC, 45% underwent allogeneic stem cell transplant compared with 26% of CLAG patients (p=0.32). The median regression free survival (RFS) of patients using GCLAC and CLAG respectively was 1.59 years [0.41, not estimatable (NE)] and 1.03 years [0.49, 1.03], (p=0.75). The median overall survival (OS) for patients receiving GCLAC and CLAG respectively was 1.03 years [0.52, NE] and 0.70 years [0.28, 1.11], (p=0.08). OS in both cohorts was not significantly different whether patients had refractory vs. relapsed disease (0.94 years [0.36,1.3] vs. 1.1 years [0.46, NE], respectively; p=0.49) (Table 2).
Outcomes
GCLAC CLAG p Value
CRi or CR 14 (64%) 9 (47%) 0.36
Transplant 9 (45%) 5 (26%) 0.32
Median RFS (years) 1.59 (0.41,NE) 1.03 (0.49,1.03) 0.75
Median OS (years) 1.03 0.70 (0.28,1.11) 0.083
Relapse Refractory p Value
OS (years) of relapse vs
refractory patients* 1.11 (0.46,NE) 0.94 (0.36,1.34) 0.49
*All GCLAC and CLAG patients combined
Safety
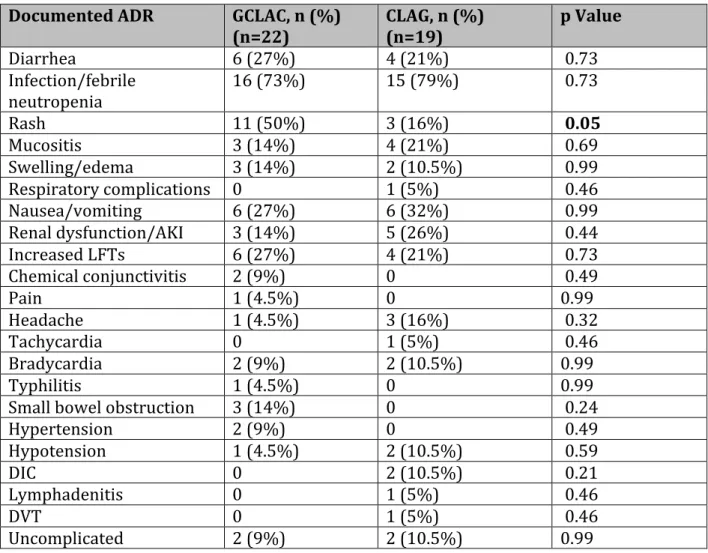
Both regimens had comparable toxicity profiles. The most common toxicities seen in both the GLAC and CLAG regimens respectively were infection/febrile neutropenia (73% and 79%), nausea/vomiting (27% and 32%), diarrhea (27% and 21%), increased LFTs (27% and 21%), renal dysfunction (14% and 26%), and mucositis (14% and 21%) (Table 3).
Documented ADR GCLAC, n (%) (n=22)
CLAG, n (%) (n=19)
p Value
Diarrhea 6 (27%) 4 (21%) 0.73
Infection/febrile
neutropenia 16 (73%) 15 (79%) 0.73
Rash 11 (50%) 3 (16%) 0.05
Mucositis 3 (14%) 4 (21%) 0.69
Swelling/edema 3 (14%) 2 (10.5%) 0.99
Respiratory complications 0 1 (5%) 0.46
Nausea/vomiting 6 (27%) 6 (32%) 0.99
Renal dysfunction/AKI 3 (14%) 5 (26%) 0.44
Increased LFTs 6 (27%) 4 (21%) 0.73
Chemical conjunctivitis 2 (9%) 0 0.49
Pain 1 (4.5%) 0 0.99
Headache 1 (4.5%) 3 (16%) 0.32
Tachycardia 0 1 (5%) 0.46
Bradycardia 2 (9%) 2 (10.5%) 0.99
Typhilitis 1 (4.5%) 0 0.99
Small bowel obstruction 3 (14%) 0 0.24
Hypertension 2 (9%) 0 0.49
Hypotension 1 (4.5%) 2 (10.5%) 0.59
DIC 0 2 (10.5%) 0.21
Lymphadenitis 0 1 (5%) 0.46
DVT 0 1 (5%) 0.46
Uncomplicated 2 (9%) 2 (10.5%) 0.99
Discussion
Comparable to Published Literature
To our knowledge, this was the first published comparison of GCLAC vs. CLAG in the setting of relapsed/refractory AML. Both regimens had similar rates of relapse-‐free survival (1.59 years vs. 1.03 years; p=0.75) (Figure 2.) and hematopoietic stem cell transplantation (45% vs. 26%,
p=0.32). Our study saw similar responses to these regimens as previous studies; Becker et al. found a CR of 46% and CRi of 61% using GCLAC (compared to our GCLAC CR+CRi of 64%)4, and
Robak et al. found a CR of 50% using CLAG (compared to our CLAG CR+CRi of 47%)2.
Notable Findings
There were similar toxicities seen in both regimens with the exception of more rash with GCLAC compared to CLAG (Table 3). This is not surprising as clofarabine is generally associated with a higher incidence of dermatologic toxicities compared with cladribine (38% vs. 16%)6,7 Only non-‐
hematologic toxicity was collected as both regimens were associated with, not surprisingly, high rates of pancytopenia. Although there was a slight trend favoring GCLAC in terms of overall survival, there was no statistical significance (p=0.083) (Figure 3). Because post-‐salvage
treatment was highly variable, an OS endpoint is unlikely to accurately reflect the efficacy of one regimen vs. another. Due to our small sample size, we were unable to control for the variability in post-‐salvage treatment approaches to better analyze OS. Another notable finding was the similarities in survival between relapsed and refractory AML. It had been generally accepted that refractory AML patients had poorer outcomes than relapsed AML patients; however, our study showed no statistical difference in overall survival between relapsed and refractory patients (Figure 4.).
Cost Comparisons
Due to our limited sample size, we were not able to perform formal pharmacoeconomic analysis. However, we were able to compare raw drug costs per patient for GCLAC and CLAG regimen. Using Average Wholesale Price (AWP), we found a 12.4 fold difference in drug costs per patient between GCLAC and CLAG (Table 4). This analysis, in light of non-‐significant findings in efficacy or safety between the two regimens, could allow clinicians to recommend CLAG over GCLAC specifically due to the cost differences. Nonetheless, we recognize that a prospective trial would be necessary in order to truly draw conclusions about comparative efficacies between these two regimens for relapsed/refractory AML.
GCLAC CLAG
Dose1 Price Per
Dose2
Price Per
Cycle2 Dose1
Price Per
Dose2
Price Per
Cycle2
Clofarabine
25 mg/m2
43.25 mg
x 5 days $10,565.103 $52,825.503
Cladribine
5 mg/m2
8.65 mg
x 5 days $4204 $2,1004
Cytarabine
2 g/m2
3.46 g
x 5 days $147.285 $736.405 Cytarabine 2 g/m2
3.46 g
x 5 days $147.285 $736.405
Filgrastim 5 mcg/kg
300 mcg x21 days6,8
$345.70 $7,259.70 Filgrastim 300 mcg x6 days300 mcg 7,8 $345.70 $2,074.20
Total $11,058.08 $60,821.60 Total $912.98 $4,910.60
Total Cost Difference: $55,911 per patient, per cycle. (12.4 fold difference)
1Dosages based on BSA of 1.73 m2 and weight of 70 kg
2All pricing based on AWP (average wholesale price)
3Cost of one 20mg/20mL vial = $3521.70
4$420 is cost of one 10mg/10mL vial
5Cost of one 500 mg/25mL vial = $18.41
6In the GLCAC regimen, filgrastim was continued until ANC ≥2000 x2 days; estimated average of 21 days for
count recovery.
7In the CLAG regimen, filgrastim was only given for a total of 6 days.
8Cost of filgrastim based on pricing for our formulary product, tbo-‐filgrastim.
GCLAC = clofarabine, cytarabine, and granulocyte colony-‐stimulating factor; CLAG = cladribine, cytarabine,
granulocyte colony-‐stimulating factor; mg = milligrams; g = grams; mcg = micrograms; mg/m2 = milligrams per
squared meter
Table 4: Drug Cost Comparison Per Patient, Per Cycle of GCLAC vs CLAG
Conclusions
We find no significant difference in outcomes using GCLAC or CLAG for relapsed/refractory AML patients. Though the sample size hampers the ability to detect small differences in this
retrospective analysis, the trends in outcomes that favored GCLAC are likely explained by trends in patient populations (e.g. longer first remission for GCLAC patients) and variabilities in post-‐ salvage therapy. Although both regimens are active in relapsed/refractory AML, we recognize that, ultimately, the preferred approach for relapsed/refractory patients continues to be entry into clinical trials. Since our efficacy results are similar to prior data, we would recommend relying on cost differences in favoring CLAG over GCLAC.
Figure 3. Overall Survival.
Figure 4. Overall survival among relapsed vs. refractory patients.
References
1. Siegel R, Ma J, Zou Z, Jemal A. Cancer statistics, 2014. CA Cancer J Clin. 2014 Jan-‐ Feb;64(1):9-‐29.
2. Döhner H, Weisdorf DJ, Bloomfield CD. Acute Myeloid Leukemia. N Engl J Med. 2015 Sep 17;373(12):1136-‐52.
3. Wrzesien-‐Kus A, Robak T, Lech-‐Maranda E, et al. A multicenter, open, noncomparative, phase II study of the combination of cladribine, cytarabine, and G-‐CSF and induction therapy in refractory acute myeloid leukemia—a report of the Polish Adult Leukemia Group (PALG). Eur J Hematol 2003;71:155–62..
4. Becker PS, Kantarjian HM, Appelbaum FR, et al. Clofarabine with high dose cytarabine and granulocyte colony-‐stimulating factor (G-‐CSF) priming for relapsed and refractory acute myeloid leukaemia. Br J Haematol. 2011;155(2):182-‐9.
5. Robak T, Wrzesień-‐Kuś A, Lech-‐Marańda E, et al. Combination regimen of cladribine (2-‐ chlorodeoxyadenosine), cytarabine and G-‐CSF (CLAG) as induction therapy for patients with relapsed or refractory acute myeloid leukemia. Leuk Lymphoma. 2000 Sep;39(1-‐2):121-‐9. 6. Clorar(R) [package insert]. Genzyme Corporation, Bridgewater, NJ; 2014.
7. Leustatin(R) [package insert]. Centocor Ortho Biotech Products, L.P., Raritan, NJ; 2012.
Acknowledgements
Thank you to the UNC Eshelman School of Pharmacy Honor’s Program
This project’s abstract was submitted and accepted to the American Society of Hematology (ASH) and was presented as a poster at the December 2015 annual conference in Orlando, FL thanks to the help of the following people:
Benyam Muluneh, PharmD, BCOP, CPP
Hendrik Van Deventer, MD
Allison Deal, MS
Matthew Foster, MD
Josh Zeidner, MD
Katarzyna Jamieson, MD
Jill Bates, PharmD, BCOP, CPP