Analysis of Police Use of Force in the New
York Stop and Frisk Policy
By: Ishrat Zarin Alam
Honors Thesis Economics Department
The University of North Carolina at Chapel Hill
April 10, 2015
Abstract
This study analyzes the Stop and Frisk policy in New York City to see if there is any
evidence of racial profiling in force used by police officers. The study uses a logit model to
estimate the probability of having force used on an individual conditional on being stopped. The
probability of having force used on blacks and Hispanics is higher. A model specification with
an interaction term between race of the suspect and crime rate of the precinct where the
individual stopped further suggests that the difference in probability of force between blacks,
Hispanics and whites is highest in low crime rate precincts. For precincts with higher crime rates
Acknowledgement
I would like to thank my thesis advisor William R. Parke for not giving up on me when I
almost did and putting up with my struggles and doubts every day. I am ever grateful to my
faculty advisor Klara Peter for pushing me to work hard and saying that she believes in me even
when I thought I was disappointing her. Thank you Elizabeth and Kristin from the UNC Odum
Institute for helping me figure out all those countless Stata commands. I would like to thank the
faculties of the UNC Department of Economics, particularly Geetha Vaidyanathan for
encouraging me to take this honors thesis course when I thought I wasn’t ready. Thank you
Tiago Pires for just listening to me talk about my thesis when I needed to vent. I would like to
thank my friends for being there for me. I may not be able to name all of you here, but you know
who you are. Last but not the least, thank you to my parents and dearest brother for being patient
with me when I was stressed and being okay with my numerous mood swings. I could not have
1.
Introduction
One of the most controversial issues facing the United States law enforcement community is
the police use of force against racial minorities. High profile incidents of police violence against
racial minorities such as the Rodney King, Abner Louima, and Amadao Diallo cases have led to
increased tension between law enforcement and minorities. The most recent case was that of
Michael Brown, an 18 year-old African American male, who was shot by Darren Wilson, a 28
year old white police officer on August 9, 2014. The shooting, the subsequent protests and later
the grand jury decision not to indict Officer Wilson for any criminal charges have led to a
nationwide uproar and raised important questions about police brutality and racial
discrimination. The death of Eric Garner in Staten Island after a NYPD police officer put him on
a chokehold have similarly raised questions about racial bias in police behaviour. Similar to
these high profile incidents of police violence, controversial policies such as the Stop and Frisk
policy in New York City have worsened the relationship between law enforcement and racial
minorities. The purpose of this study is to analyze the police use of force during a Stop and Frisk
encounter in New York City and to evaluate if there is any evidence of racial profiling.
The paper is important for several reasons. First, it aims to answer whether or not the
probability of force used on individuals during a Stop and Frisk encounter in New York City
varies by race. The Stop and Frisk policy has been highly criticized by civil rights advocates for
violating constitutional rights. Recent events such as the Ferguson protests have placed a greater
strain on police-community and it is important that issues such as racial profiling, excessive
force on minorities and harassment are addressed vigorously.
Second, research on police use of force has traditionally focused on sociological,
research is the role of neighbourhood context to explain police use of force. This study,
therefore, contributes to the literature on Stop and Frisk policy in New York by exploring the
neighbourhood context of police behaviour. The neighhbourhood context is described in the
“Literature Review” section of the paper.
Third, the study can have some meaningful implications for the controversies surrounding
the Stop and Frisk policy in New York City. From 2006 to 2013 approximately 4 million
individuals in New York City were stopped by the police, out of which 53% were blacks and
32% were Hispanics. Any evidence of racial bias in the police use of force raises important
questions about the Stop and Frisk policy in New York, which affected approximately 3.4
million blacks and Hispanics in 8 years.
This study uses a logit model to estimate the likelihood that force is used on an individual
controlling for encounter level, suspect level and precinct level characteristics. The study finds
that the probability of having force used on blacks and Hispanics is higher than whites. The
difference in probability of force between blacks, Hispanics and whites is highest in low crime
rate precincts. This difference in probability of force between blacks, Hispanic and whites is
smaller in high crime rate precincts.
This study makes a number of contributions to the literature. First, all other studies on the
Stop and Frisk policy in New York have worked with only one period at a time. This study
covers a period of eight years from 2006 to 2013, thereby working with a larger data set. Second,
analysis of the stop and frisk policy has almost exclusively focused on stop rates of individuals
and comparison of “hit rates”, i.e. efficiencies in the proportion of stops that yield positive
results. This study contributes to the literature by focusing solely on the police use of force
The paper is structured as follows. The next section provides some background details about
the Stop and Frisk policy. Section 3 is an extensive review of existing literature. Second 4, 5 and
6 presents the theoretical framework, data and the empirical model respectively. The paper
discusses the results and findings in section 7 and concludes in section 8.
2.
Background
The Stop and Frisk policy in New York Police Department that began in the early 1990’s was
largely influenced by the “broken windows” theory of policing. Keilling and Wilson (1982) said
that “If a window in a building is broken and is left unrepaired, all the rest of the windows will
soon be broken”. Disorder like a broken window can lead to increased fear and withdrawal from
residents and hence, generate and sustain more serious crime. The broken windows model of
policing suggests that police should focus on disorder and less serious crime so that residents can
take control and prevent serious crime from infiltrating their neighbourhood. William J. Bratton,
the NYPD police commissioner appointed in 1994 and later reappointed in 2014, is a proponent
of the broken windows theory and was largely responsible for the widespread use of the Stop and
Frisk policy in New York. Proponents of the Stop and Frisk policy strongly advocate that the
rigorous policing policy was responsible for the substantial reduction of crime rate in the city
during early 1990’s. Opponents of the policy believes that it violates two constitutional
protections. They claim that the Fourteenth amendment is violated since suspects are arrested
without any legal basis. They also make claims of racial profiling and discrimination, which once
3.
Literature Review
Werthman and Piliavin’s (1967) ecological contamination hypothesis states that police attach
the socioeconomic characteristics of the neighbourhood to an individual suspect independent of
his/her demographics. They hypothesized that the police officers’ perceptions are affected by the
environment and concluded that suspects in dangerous neighbourhood are perceived as more
dangerous. Geographic areas that are perceived as dangerous by the police have higher crime
rates, lower incomes and higher minority populations. Police do not apply excessive force to
blacks simply because they are black, but because they encounter more blacks in dangerous
neighbourhoods where the police feel more threatened.
Bailey and Mendelsohn (1969) similarly used the neighbourhood context to conclude that
low income and high crime rate neighbourhoods are subjected to more aggressive and punitive
police behaviour. Smith’s (1986) study included data from the Police Survey Study where he
used a sample of 762 encounters with non-dangerous suspects in 60 neighbourhoods in
Rochester, St. Louis, Tampa and St. Pertersbergh.i His results are similar to Werthman and Piliavin’s ecological contamination hypothesis. He further claims that police officers are more
likely to use force on Black suspects. This effect, however, was smaller when the neighbourhood
context was taken into account.
The Office of Attorney General (OAG) in New York analyzed the highly controversial Stop
and Frisk policy of the New York Police Department in response to allegations of systematic
police misconduct. The research paper analyzed more than 181,000 field interrogation cards
completed by NYPD officers from 1998 to 1999. The OAG regression analysis shows that
blacks and Hispanics were significantly more likely than whites to be “stopped” after controlling
composition by race.ii This study analyzes the same data set as the OAG report except that it works with more recent data (2006 to 2013). A comparative analysis of the more recent data
with the 1999 data set would have allowed us to analyze whether or not the appointment of a
New York Police commissioner in 2000 affected the way police behaved with minorities. Such
an analysis, however, will be not possible because the 1999 data is not available publicly for
legal reasons. Unlike the OAG research paper, my paper focuses on racial profiling in the use of
force instead of the “stops” encounters. Despite the difference, this paper was very useful since it
worked with precinct level data.
The then New York Police Commissioner Howar Saffi stated that “the racial distribution of
the subject of the Stop and Frisk reflects the demographics of known violent crime suspects as
reported by crime victims” (Saffi, 1999).iii A more recent study addresses such claims by
performing a multi level analysis of New York’s 75 precincts (Gelman et al., 2006). By taking
into account the precinct level characteristics, the study is consistent with theories of policing
such as “broken windows” that strongly emphasizes local and neighborhood strategies. Gelman
et al. (2006) finds that blacks and Hispanics are stopped more often than whites, both in
comparison to the population of these groups and to the best estimates of the rates of crimes
committed by each group.iv After controlling for precinct level characteristics, the pattern still
holds.
4.
Theoretical Model
The purpose of this study is to analyze the police use of force during a stop and frisk
encounter. In the theoretical model the economic agents are the police officers who stop and frisk
individuals in New York City. The choice variable is whether or not to apply force on the
The police face a budget constraint where departmental budget is the difference between
government funds and expenses. Other than resource and time constraints, there are political
constraints in this model. The police cannot stop everyone in the street because people in NY are
not necessarily tolerant towards the Stop and Frisk policy.
The study aims to analyze if the use of police force varies by race of the individuals stopped
after controlling for other variables. It hypothesizes that there is evidence of racial profiling in
the use of force in the New York Stop and Frisk policy.
5.
Data
The primary data source for this research will be the Stop and Frisk data from New York
Police Department website. This dataset is compiled and recorded from the UF 250 form, an
administrative form filed by police officers after a stop and frisk is initiated. The UF 250 form
records several aspects of the stop including suspect demographics, time and location of the stop,
suspect crime, rationale for the stop, etc. Other characteristics of the stop such as whether the
suspect was frisked, arrested, issued summon, etc. are also recorded in the form. The New York
Police Department compiles and annually releases information from the UF 250 forms in a
standardized manner.
The study works with the stop and frisk data from the time period 2006-2013 (8 years). The
original data set is publicly available in the New York Police Department (NYPD) website. For
the purpose of this study, a cleaned data was collected from Sharad Goel, an Assistant professor
at Stanford University who has worked on Racial Disparities in New York City’s Stop-and-Frisk
Policy. The data set includes approximately 4 million observations. For practical and technical
The crime rate data by each precinct is also obtained from the New York Police Department
website. The NYPD records reported crime and offense data based upon the New York State
Penal Law and other New York State Laws. The tabular data summarizes the law categories by
law class, Felony, Misdemeanor and Violation. There is a further subdivision into broad crime
and offense categories, e.g. Felonious Assault, Grand Larceny, Misdemeanor Criminal Mischief,
etc. There are separate tables for Seven Major Felonies, Non-Seven Major Felony Crimes,
Misdemeanors and Violations. The crime rate data is for the period 2000 to 2013.
The precinct level characteristics such as unemployment rate, percentage of black in the
population were obtained from the American Community Survey (ACS) 2008 -2012 (5 year
estimates). The New York Census tract and block level data was converted to precinct level with
the use of specific GIS (Graphical Information System) software. The New York City precinct
level data set was compiled with the assistance and expertise of the Odum Institute and Research
Hub at the University of North Carolina at Chapel Hill
Figure 1 shows the total number of individuals stopped during a stop and frisk encounter
from the period to 2006 to 2013. The bar charts show that number of pedestrians stops gradually
increased from 2007 to 2011, fell slightly in 2012 and by 2013 dropped to one third of its
previous year’s stops. One of the major reasons behind this drop is the mounting and public
scrutiny of the NYPD practices, including a federal judge’s 2013 ruling that they were
unconstitutional.
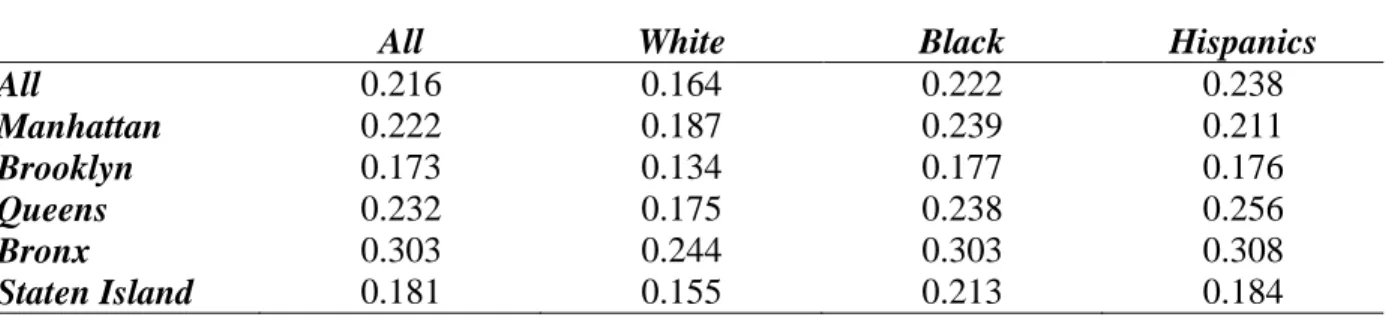
Table 1 shows the probability of force being applied on an individual broken down by race
for each borough of the five boroughs and for the whole city of New York. The probability of
force is 23.8%, 22.2% and 16.4% for Hispanics, blacks and whites respectively. Therefore, the
five boroughs in New York City the probability of force is higher for blacks and Hispanics than
whites. However, the probability of force being applied on each race varies according to the
location where the individual was stopped. For instance, the differential probability of force
between whites and blacks (6.3%) and whites and Hispanics (8.1%) is highest in Queens. It is
lowest in Staten Island where the differential probability between white and blacks and white and
Hispanics is 5.8% and 2.9% respectively. It is possible that the police officers’ perception are
affected by the socioeconomic characteristics of the borough and as a result, the probability of
force varies by the borough where the individual is located.
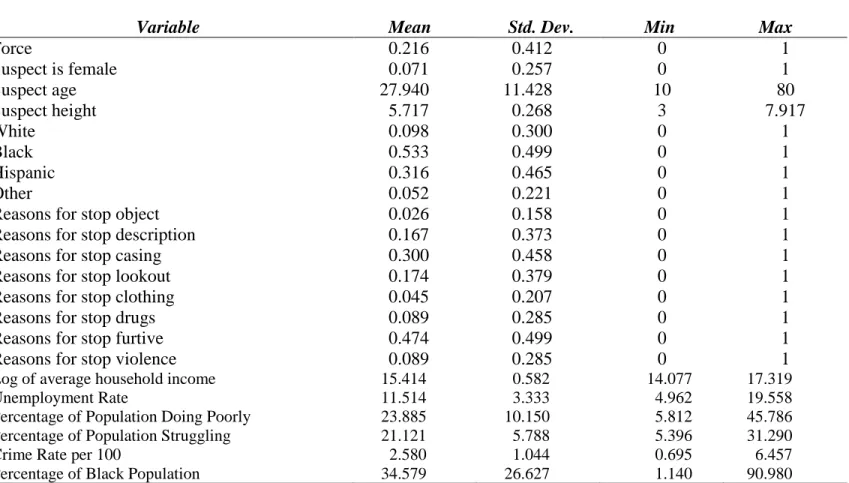
Table 2 shows the summary statistics for each variable in the base specification model. On
the average 21.6% of the individuals stopped in the sample data set had some kind of force used
on them. From henceforth in the paper, this average would be referred to as mean force. Among
the individuals who had force used on them, 53.3% were black, 31.6% Hispanic, 9.8% white and
5.2% other race. Casing a victim or location is the most commonly cited reason to stop an
individual (30% share of the reasons of stop). The table further shows that the average crime rate
and percentage of black population is 2.58 and 34.579 respectively.
Figure 2 shows the racial composition of individual stopped by police. According to the
Figure, percentage of black stopped by the police was highest over the 8 years, followed by
Hispanics, whites and other race. During the period from 2006 to 2013 the percentage share of
black, Hispanic, white and other race is approximately 53%, 32%, 10% and 7%.
Figure 3 shows the incidence of force applied by police from 2006 to 2013. According to
Figure mean force reaches its peak in 2009. The mean force decreases from 2009 to 2012.
However, the mean force increases from 2012 to 2013 which is unexpected because the total
Figure 4 shows the incidence of force applied by police on each race from 2006 to 2013.
Similar to figure 3, each of the graphs in figure 4 reaches its peak in 2009, then decreases from
2009 to 2012 and then increases from 2012 to 2013. The mean force on Hispanics is the highest
throughout the 8 years, followed by blacks, other race and white.
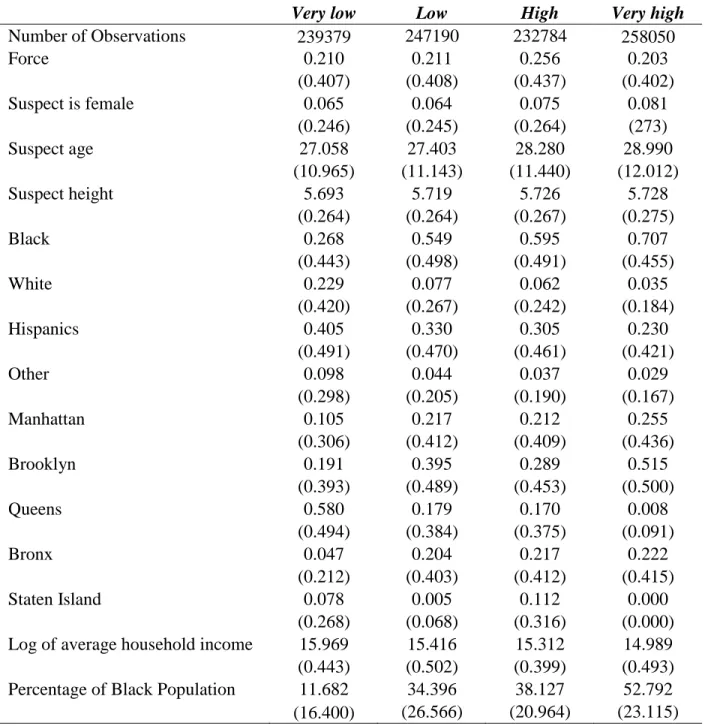
Table 3 shows the summary statistics of key variables by crime rate level in the sample. The
mean force in precincts with very low crime rates is 21.0% and it increases to 25,6% in high
crime rate precincts. The increase in mean force from low to high crime rate intuitively makes
sense since it is possible that police are more aggressive and willing to apply force in high crime
rate precincts where they might feel more threatened. The average age and height of the
individuals stopped and share of female stopped do not vary much across very low, low, high
and very high crime rates. However, the share of individuals stopped by race vary significantly
across precincts with different crime rates. The share of blacks stopped in precincts with very
low and low crime rates are 26.8% and 54.9% respectively. The percentage of black population
in precincts with very low and low crime rates are 11.9% and 34.4% respectively. The share of
blacks stopped in these precincts is much greater than the percentage of black population. This
suggests that police are stopping more blacks without taking into account the representative
black population in that area.
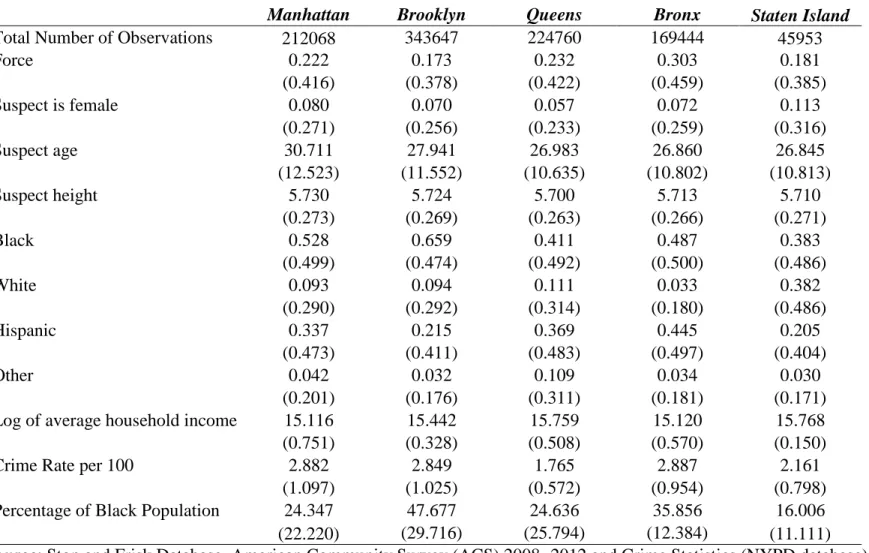
Finally, Table 4 shows the summary statistics of key variables by geographic area. Similar to
Table 3, average age and height of the individuals stopped and share of female stopped do not
vary much across the five boroughs in New York City. In Brooklyn the mean force is as low as
17.3% while in Bronx it is as high as 30.3%. This suggests there is a geographic variability in
police behaviour. Blacks are the highest share across all geographic areas, followed by
However, the share of blacks stopped in Manhattan is 52.8%, which is more than twice the
percentage of black population in Manhattan. A similar discrepancy can be seen in Staten Island
where the share of blacks stopped is 38.3% and percentage of black population is only 16.0%.
6.
Empirical Model
A logit model is used to analyze whether or not there is any evidence of racial profiling in the
use of police force in the stop and frisk policy in New York City. The following equation is used
for my estimation:
𝐹𝑖𝑡 = 𝛽0+ 𝛽1𝑅𝑖𝑡+ 𝛽2𝑆𝐶𝑖𝑡+ 𝛽3𝑅𝑆𝑖𝑡+ 𝛽4𝑌𝑖 + 𝛽5𝐺𝐴𝑖𝑡+ 𝛽6𝐶𝑅𝑖𝑡+ 𝛽7𝑃𝐶𝑖𝑡+ 𝜀𝑖𝑡
In this equation, 𝐹𝑖𝑡 is a binary variable that indicates whether or not any force is used on
individual i in time t. The following are nine types of physical force used by officers: suspect
against wall, weapon pointed, hands, handcuffs, suspect on ground, weapon drawn, baton, and
pepper spray. The dependent variable force is 1 if any type of force is used and 0 otherwise.
𝑅𝑖𝑡 is a vector of the race of individual i in time t. Suspect race includes black, white, Hispanics
and other.
𝑆𝐶𝑖𝑡 is a vector of the individual level characteristics of individual i in time t. The suspect
characteristics include suspect sex, age and height.
𝑅𝑆𝑖𝑡 is a vector of the reasons that the police use to stop individual i in time t. The following are
the eight reasons for stop: carrying a suspicious object, fits a relevant description suspect acting
as a lookout, casing a victim or location, actions indicative of a drug transaction, wearing clothes
𝑌𝑖𝑡 is the year of stop for individual i. The period is from 2006 to 2013.
𝐺𝐴𝑖𝑡 is a vector of the geographic area of stop for individual i in time t.
𝐶𝑅𝑖𝑡 is the crime rate of the precinct where individual i was stopped in time t. It is measured as
crimes per 100 people in the population.
𝑃𝐶𝑖𝑡 is a vector of the characteristics of the precinct where individual i was stopped. The precinct
characteristics include log of average household income, unemployment rate for civilian
population in labour force, percentage in the population doing poorly, percentage in the
population struggling, percentage of black in the population.
𝜀𝑖𝑡 is the error term for individual i in time t.
In this model, suspect characteristics such as sex, age, and height are the encounter level
variables. Other models in the literature that have analyzed police-suspect encounters have
included officer characteristics such as race and experience to better understand the relationship
between encounter level variables and use of force (Terill et Al., 2006). However, such variables
are unavailable in the Stop and Frisk database and may lead to the problem of omitted variable
bias.
The reasons for stop are independent variables that are typically used for research that
relies on the direct observation of police behaviour. However, one of the limitations of typical
administrative dataset such as the Stop and Frisk database is that the reasons officers used to
articulate their actions are vulnerable to numerous validity threats.
As previously mentioned in the literature review the ecological contamination hypothesis
suspect independent of his/her demographics (Werthman et al., 1926). In order to analyze this
neighbourhood context of police behaviour, the study includes precinct level characteristics such
as log of average household income, unemployment rate, percentage in the population doing
poorly, percentage in the population struggling, percentage of black in the population in my
model. The log transformation of average household income is necessary because income is
positively skewed. It also leads to easier interpretation of the coefficients.
7.
Results and Findings
7.1. Base Specification
Table 5 shows the logit results and marginal effects of the base specification model. As
described in the empirical model, the logit model is used to estimate the likelihood of force being
applied on individuals during a stop and frisk encounter in New York City. The estimation
suggests that suspect race, suspect characteristics, reasons for stop, geographic area, year, crime
rate and precinct level characteristics are determinants of force. . The logit results suggests
Hispanics are more likely to have force used on them, followed by blacks. The coefficient signs
of the base model are as expected. For instance, females are less likely to have force used on
them male. Likelihood of force decreases as age of the suspect increases. The probability of
force also increases as crime rate and percentage of black population of the precinct where the
suspect was located increases. The probability decreases if the income of the precinct increases.
The marginal effects is calculated to interpret the results of the baseline specification. The
marginal effect for categorical variables shows how the likelihood of force changes as the
categorical variable changes from 0 to 1. Intuitively, the average marginal effect is calculated as
individual’s race is, leave all the variables as is and compute the probability that individual will
have forced used on him/her. The same computation is then done, treating the individual as
black. The marginal effect for that individual is the difference between the two probabilities just
computed. The process is repeated for every individual in the sample. The average marginal
effect of black is the average of all the marginal effects computed.
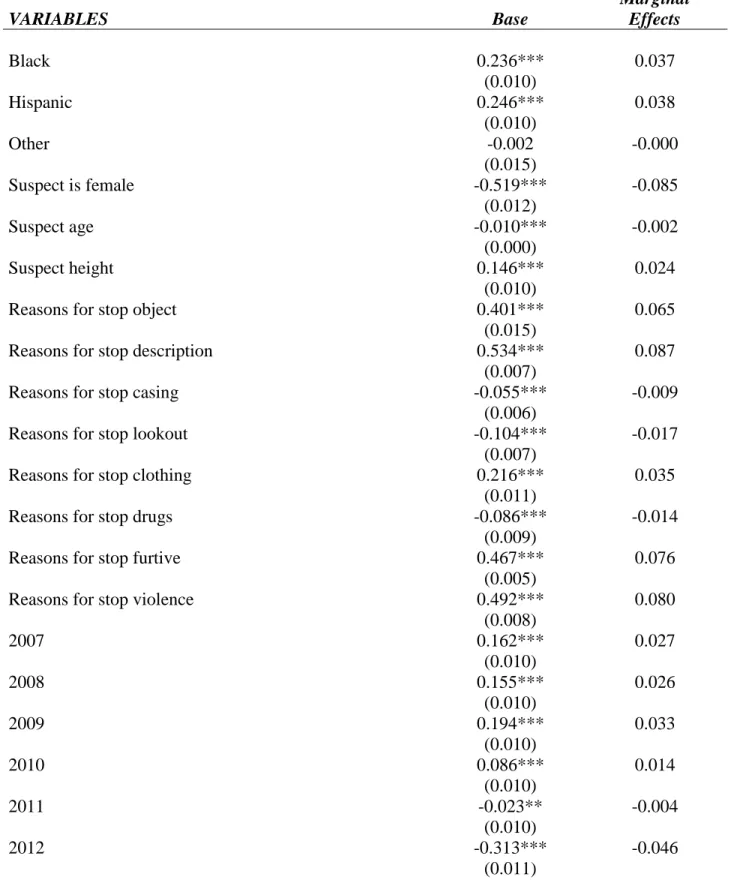
The results of the marginal effects of the baseline specification are shown in Table 5. On
average the probability of having force used on blacks and Hispanics is respectively 3.7 and 3.8
percentage points higher than it is for whites. The average marginal effects for continuous
variables such as crime rate tells us the instantaneous rate of change for crime rate. Therefore, for
every 1 crime per 100 in the population the probability of force increases by 0.1 percentage
points. The probability of force increases by 1.1 percentage points for every 1 unit increase in the
percentage of black population (scaled by 100). Similarly, for every one unit increase in
unemployment rate and percentage in population doing poorly the likelihood of force increases
by 0.3 and -0.3 percentage points respectively. Furthermore, for every 1% increase in average
household income the probability of force increases by 0.4 percentage points. Compared to
individuals stopped in 2006, those stopped in 2009 are 3.3 percentage points less likely to have
forced used on them. However, individuals stopped in 2013 are 2.8 percentage points less likely
to have forced used on them compared to 2006. Individuals stopped in Manhattan have a 6.2
percentage points higher likelihood of force being used on them compared to those stopped in
Brooklyn. Similarly, in Staten Island the likelihood of force is lower by 4.3 percentage points.
The next sub section describes a model specification that analyzes the interaction between
7.2. Model Specification 1: Interaction of Suspect Race with Crime Rate
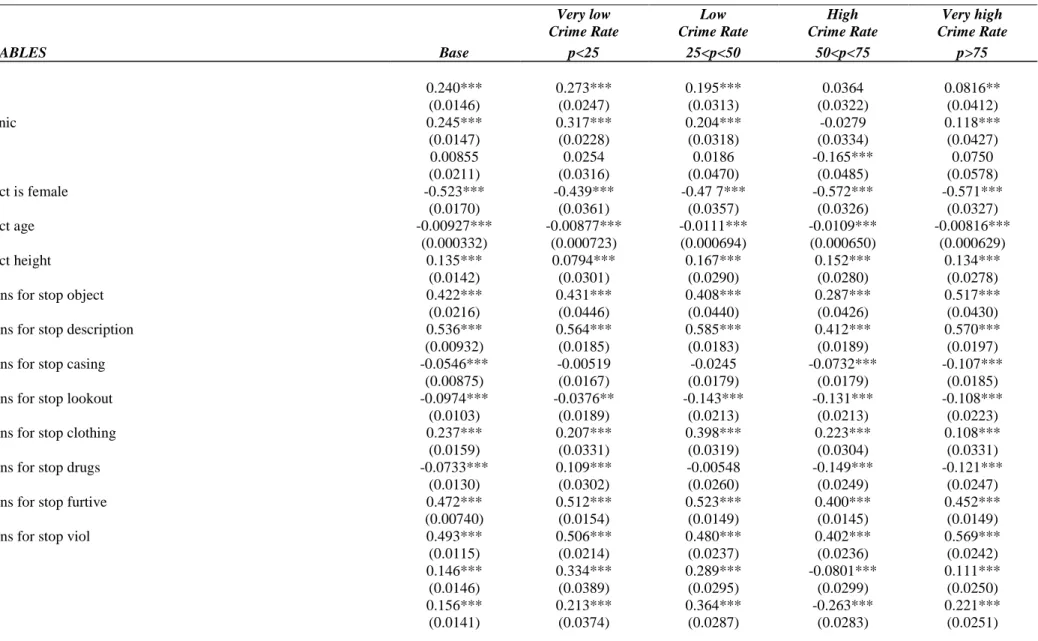
The motivation for this model specification was derived from the models in Table 6
where the sample was split into four crime rate levels and the base model was run for each of
these stratified samples. The levels are low, very low, high and very high crime and they
represent crime rates below the 25th percentile, between 25th and 50th, between 50th and 75th and above 75th respectively. According to the results in Table 6, it can be seen that the coefficients on suspect race Black and Hispanic vary across the four models. The coefficient for black and
Hispanic is highest in the model for very low crime rate, followed by the model for low crime
rate. The coefficient on these suspect races is lowest in the model for very high crime rate. These
results suggest an interaction between race of the suspect and crime rate of the precinct where the
suspect was stopped. In order to understand this interaction, I have developed model
specification 1 which is essentially the same as the base specification, except that I have added
an interaction term between suspect race and crime rate. The results of model specification 1 can
be found in Table 7.
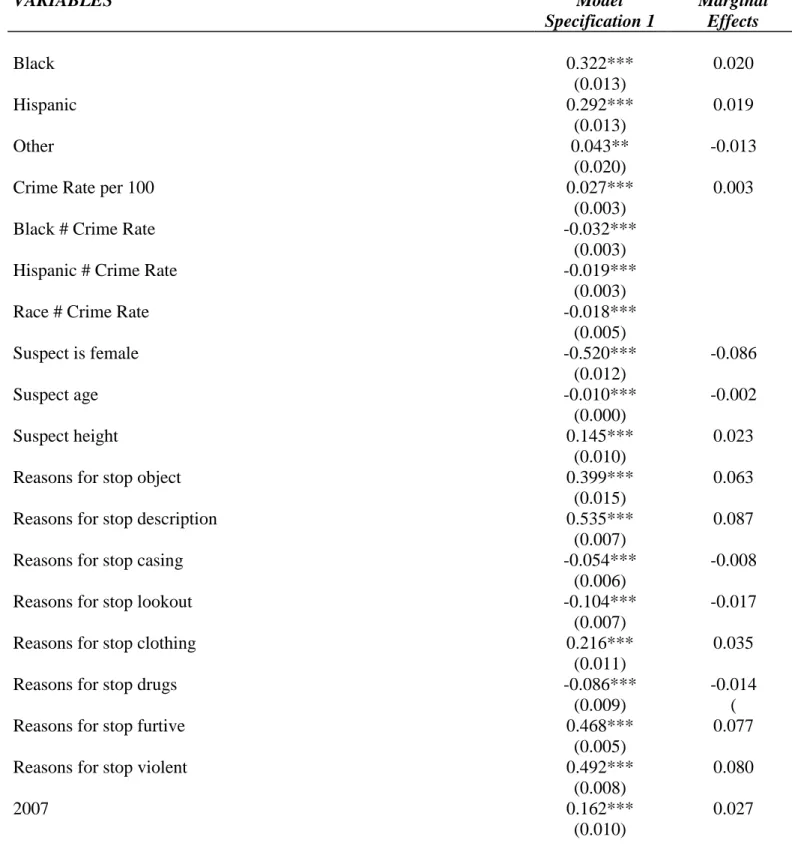
Table 7 shows that for whites the probability of force increases as crime rate
increases. When crime rate in the precinct where the individual is stopped is zero the coefficients
on black and white are 0.322 and 0.292 respectively. Blacks are more likely to have force used
on them in low crime rate precincts, followed by Hispanics. Moreover, the coefficients on the
interaction terms for black and crime rate, Hispanic and crime rate are -0.032 and -0.019, the
decrease being higher for blacks. This implies that the difference in the probability of force
between blacks, Hispanics and whites is highest in low crime rate precincts and this difference
Table 7 also shows the marginal effects for the model specification with the interaction
term. Individuals stopped in 2013 are 2.9 percentage points less likely to have force used on
them compared to those stopped in 2006. The magnitude of the marginal effects for Black and
Hispanics are still positive. However, the magnitude of the marginal effect for blacks and
Hispanics decreases after taking into account the interaction between suspect race and crime rate.
According to this model specification, on average the probability of having force used on blacks
and Hispanics is respectively 2.0 and 1.9 percentage points higher than it is for whites. For every
one unit increase in unemployment rate and percentage in population doing poorly the likelihood
of force increases by 0.3 and decreases by 0.3 percentage points. The likelihood of force
increases by 0.5 percentage points for every 1 unit increase in the percentage in the population
struggling. For the base model specification this magnitude was zero. Furthermore, for every 1%
increase in average household income the probability of force decreases by 1 percentage point.
Like the base model’s parameter, this model specification has a negative sign for the marginal
effect on income and the negative sign is consistent with the intuition that the likelihood of force
is lower in rich neighbourhoods. . Last but not the least, for every 1 crime per 100 in the
population the probability of force increases by 0.3 percentage points, the magnitude of marginal
7.3. Model Specification 2
The model specification 2 is a multinomial logit that aims to analyze if the extent to
which force is used on individuals varies by race. Previous research has ranked force in different
ways, such as excessive vs non-excessive, impact vs non-impact, and no, low, moderate and high
force. In this study force is categorized as no, low and high force. The independent variables for
the multinomial logit is the same as the base specification model described in the empirical
section.
Force is categorized as 0 if no force is used. It is categorized as low force 1 if only
handcuffs and/or hands are used. It is categorized as high force 2 if at least one of the following
types of force was used: suspect against wall, weapon pointed, suspect on ground, weapon
drawn, baton and pepper spray. Police often used more than the one force on a suspect. For this
analysis, force is high as long as any of the above mentioned types of force is applied. The
dynamics of force within an encounter is beyond the scope of this research.
Table 8 shows the results of the model specification 2. The multinomial logit for black
relative to whites is 0.264 higher for being in low force relative to no force given all other
predictor variables in the model are held constant. The magnitude of the multinomial logit for
Hispanics relative to whites for being in low force relative no force is the same. Furthermore, the
multinomial logit for black relative to whites is 0.193 higher for being in high force relative to no
force. Similarly the multinomial logit for Hispanics relative to whites for being in high force
relative no force is 0.219.
Table 8 also shows the relative risk ratio of the model specification 2. These figures are
option in STATA. According to the relative risk ratio results, for blacks relative to white, the
relative risk for low force relative to no force would be expected to increase by a factor of 1.302
given the other variables in the model are held constant. For Hispanics relative to white, the
relative risk for low force relative to no force 1.303. For blacks relative to white, the relative risk
for high force relative to no force would be expected to increase by a factor of 1.213 given the
other variables in the model are held constant. For Hispanics relative to white, the relative risk
for high force relative to no force 1.245. The results from this multinomial logit shows that black
and Hispanics are more likely to have both low and high force used on them compared to white.
However, the relative risk for high force relative to no force is not significantly higher than low
force relative to no force.
7.4. Model Specification 3
This model specification is a multinomial logit with the same categorical force as the
multinomial logit described above. The dependent variable is the same as the previous model
specification, except an interaction term is added between crime rate and suspect race.
Table 9 shows the relative risk ratio of the model specification 3. When crime rate is zero, for
blacks the relative risk for low force relative to no force increases by a factor of 2.117 given the
other variables in the model are held constant and for Hispanics the relative risk for low force
relative to no force increases by 1.964. If crime rate per 100 increases by 1 unit, for white the
relative risk for low force relative to no force increases by 1.230 given the other variables in the
model are held constant. When crime rate increases, for blacks the relative risk for low force
relative to no force decreases by a factor of 0.791 given the other variables in the model are held
The relative risk ratio results for high force relative to no force are as follows. When crime
rate is zero, for blacks the relative risk for high force relative to no force increases by a factor of
1.895 given the other variables in the model are held constant and for Hispanics the relative risk
for high force relative to no force increases by 1.596. If crime rate per 100 increases by 1 unit,
for white the relative risk for high force relative to no force increases by 1.222 given the other
variables in the model are held constant. When crime rate increases, for blacks the relative risk
for high force relative to no force decreases by a factor of 0.816 given the other variables in the
model are held constant and for Hispanics the relative risk for high force relative to no force
decreases by 0.878.
8.
Conclusion
The probability of having force used on an individual during a Stop and Frisk policy is
16.4%, 22.2% and 23.8% for whites, blacks, and Hispanics. So there is a difference of 5.8% and
7.4% between black and whites and Hispanics and whites respectively. This study finds that after
controlling for encounter level characteristics such as reasons for stop, suspect level
characteristics such as age, height and precinct level characteristics such as crime rate,
percentage of black population, etc the differential probability of force between whites and
blacks and whites and Hispanics is still 3.8% and 3.9% respectively. This implies there is some
evidence of racial profiling in the police use of force in the New York Stop and Frisk policy.
Furthermore, this evidence of racial profiling is higher in precincts with the low crime rates.
The results of this study contradict with that of Smith’s (1986) who claim that police
officers are more likely to use force on black suspects and this effect was reduced when the
neighbourhood context was taken into account. In this study, the effect of race is not mitigated
the interaction of crime rate and race is taken into account. Police officers are more likely to use
force on black and Hispanics in precincts with low crime rate. This could be because they
believe that that these individuals are up to something bad and this level of suspicion is enhanced
since the suspect do not belong in the area. Officers may reason that this person may be in this
area to score his or her next high or to meet with someone engaged in the illegal behaviour.
Another explanation of this result is that high crime rate areas are mostly policed by black and
Hispanic officers. These officers are more familiar with the area and the people living in the
neighbourhood. So they are less likely to use force on black and Hispanics based solely on the
race of the suspect. This claim could be investigated if the race of the police officers during each
Stop and Frisk policy were available.
From 2006 to 2013 approximately 4 million individuals in New York City were stopped
by the police, out of which 53% were blacks and 32% were Hispanics. Some of the social costs
of the Stop and Frisk policy are increased cultural strife between police and minorities, mistrust
of institutions, psychological effects such as humiliation and alienation, and decreased sense of
citizenship. Any evidence of racial bias in the police use of force raises important questions
about the Stop and Frisk policy in New York that affected approximately 3.4 million blacks and
Hispanics in 8 years. This study can have some meaningful implications for the debate
Bibliography
Andrew Gelman, Alex Kiss, Jeffrey Fagan. “An Analysis of the NYPD's Stop-And-Frisk Policy in the Context of Claims of Racial Bias” Columbia Public Law Research Paper No. 05-95.
(2006): http://ssrn.com/abstract=846365 or http://dx.doi.org/10.2139/ssrn.846365
Goel, Sharad, Justin M. Rao, and Ravi Shro. 2012 “Precinct or Prejudice?: Understanding Racial Disparities in New York City’s Stop-and-Frisk Policy”. Accessed November 2, 2014,
https://5harad.com/papers/frisky.pdf
Ridgeway, G. 2007. “Analysis of Racial Disparities in the New York Police Department’s Stop, Question and Frisk Policy Practices”. Technical report prepared for the New York Police Department. Accessed November 2, 2014,
http://www.rand.org/content/dam/rand/pubs/technical_reports/2007/RAND_TR534.pdf
Smith, Doughlas A. 1986. "The Neighbourhood Context of Police Behaviour." Communties and Crime, editedby Albert J. Reiss, Jr., and Michael Tonry. Chicago: Universiyt fo Chicago Press. New York State Office of Attorney General, An Investigation into NYPD’s “Stop and Frisk”
Investigation, 1999. Accessed November 2, 2014,
http://www.oag.state.ny.us/sites/default/files/pdfs/bureaus/civil_rights/stp_frsk.pdf
William Terrill, Michael D. Reisig. “Neighbourhood Context and Police Use of Force”
Short name Variable name Long definition Sources
force=1 if applied force force There are nine types of physical force used by officer. They are as follows as suspect against wall, weapon pointed, hands, handcuffs, suspect on ground, weapon drawn, baton, pepper spray and other. Force is 1 if any type of force is used and 0 otherwise.
Stop and Frisk Database
force categorical=0 if no force,=1 if low,=2 high
force_categorical Force is categorized as 0 if no force is used. It is
categorized as low force 1 if only handcuffs and/or hands are used. It is categorized as high force 2 if at least one of the following types of force was used: suspect against wall, weapon pointed, suspect on ground, weapon drawn, baton and pepper spray.
Stop and Frisk Database
Suspect is female female Sex of suspect. Stop and Frisk Database Suspect age Age Age of suspect in years Stop and Frisk Database Suspect height suspectheight Height of suspect in feet Stop and Frisk Database Suspect race is black race_black Race of suspect is black Stop and Frisk Database Suspect race is white race_white Race of suspect is white Stop and Frisk Database Suspect race is
Hispanic
race_hisp Race of suspect is Hispanic, includes both white and black Hispanics
Stop and Frisk Database
Suspect race is other race_oth Race of suspect is other race, includes Asian, Native American and other
Stop and Frisk Database
Reason for stop object stoppedbcobject carrying a suspicious object as reason to stop individual Stop and Frisk Database Reason for stop
description
stoppedbcdesc fits a relevant description as reason to stop individual Stop and Frisk Database
Reason for stop casing stoppedbccasing casing a victim or location as reason to stop individual Stop and Frisk Database Reason for stop
lookout
stoppedbclookout suspect acting as a lookout as reason to stop individual Stop and Frisk Database
Reason for stop clothing
stoppedbcclothing wearing clothes commonly used as a lookout as reason to stop individual
Stop and Frisk Database
Reason for stop drugs stoppedbcdrugs actions indicative of a drug transaction as reason to stop individual
Stop and Frisk Database
Reason for stop furtive stoppedbcfurtive furtive movements as reason to stop individual Stop and Frisk Database Reason for stop
violence
stoppedbcviolent actions of engaging in a violent crime as reason to stop individual
Stop and Frisk Database
Geographic Area geoarea Geographic area of stop. The locations of stop are the following five boroughs of New York City: Manhattan, Brooklyn, Queens, Bronx and Staten Island
Stop and Frisk Database
Log of Average Household Income
log_average_household_ income
Log of average household income in 2012 inflation adjusted dollars in precinct
American Community Survey (ACS) 2008 -2012 Unemployment Rate unemployment_rate Unemployment rate for civilian population in labor force
16 years And over
American Community Survey (ACS) 2008 -2012 Percentage in
Population Doing Poorly
poverty_doing_poorly Percentage of population for whom poverty status is determined: Under 1.00 (Doing Poorly). Here poverty status is determined by ratio of income in 2012 to poverty level.
American Community Survey (ACS) 2008 -2012
Percentage in
Population Struggling
poverty_struggling Population for whom poverty status is determined: 1.00 to 1.99 (Struggling). Here poverty status is determined by ratio of income in 2012 to poverty level.
American Community Survey (ACS) 2008 -2012
Crime Rate per 100 crime_rate_14_major Crime rate per 100 people in each precinct. It is calculated by adding the total number of seven major felonies and non-seven major felony crimes of each precinct, dividing it by the respective population of the precinct and multiplying it by 100. The seven major felonies include man slaughter and non-negligent murder, rape, robbery, felony assault, burglary, grand larceny and grand larceny of motor vehicles. The non-seven major felony crimes include felony possession stolen property, forgery/theft-fraud/identity-theft, arson, felony sex crimes, felony dangerous drugs, felony dangerous crimes, felony criminal mischief and related offenses, and other felonies.
Crime Statistics (NYPD database) and American Community Survey (ACS) 2008 -2012
Percentage of Black Population /100
Table 1: Probability of force being applied on an individual broken down by race for each borough and for the whole city
All White Black Hispanics
All 0.216 0.164 0.222 0.238
Manhattan 0.222 0.187 0.239 0.211
Brooklyn 0.173 0.134 0.177 0.176
Queens 0.232 0.175 0.238 0.256
Bronx 0.303 0.244 0.303 0.308
Table 2: Summary Statistics for Each Variable in the Base Specification Model
Variable Mean Std. Dev. Min Max
Force 0.216 0.412 0 1
Suspect is female 0.071 0.257 0 1
Suspect age 27.940 11.428 10 80
Suspect height 5.717 0.268 3 7.917
White 0.098 0.300 0 1
Black 0.533 0.499 0 1
Hispanic 0.316 0.465 0 1
Other 0.052 0.221 0 1
Reasons for stop object 0.026 0.158 0 1
Reasons for stop description 0.167 0.373 0 1
Reasons for stop casing 0.300 0.458 0 1
Reasons for stop lookout 0.174 0.379 0 1
Reasons for stop clothing 0.045 0.207 0 1
Reasons for stop drugs 0.089 0.285 0 1
Reasons for stop furtive 0.474 0.499 0 1
Reasons for stop violence 0.089 0.285 0 1
Log of average household income 15.414 0.582 14.077 17.319
Unemployment Rate 11.514 3.333 4.962 19.558
Percentage of Population Doing Poorly 23.885 10.150 5.812 45.786 Percentage of Population Struggling 21.121 5.788 5.396 31.290
Crime Rate per 100 2.580 1.044 0.695 6.457
Percentage of Black Population 34.579 26.627 1.140 90.980
Source: Stop and Frisk Database, American Community Survey (ACS) 2008 -2012 and Crime Statistics, NYPD database,
Table 3: Summary Statistics by Crime Rate
Very low Low High Very high
Number of Observations 239379 247190 232784 258050
Force 0.210 0.211 0.256 0.203
(0.407) (0.408) (0.437) (0.402)
Suspect is female 0.065 0.064 0.075 0.081
(0.246) (0.245) (0.264) (273)
Suspect age 27.058 27.403 28.280 28.990
(10.965) (11.143) (11.440) (12.012)
Suspect height 5.693 5.719 5.726 5.728
(0.264) (0.264) (0.267) (0.275)
Black 0.268 0.549 0.595 0.707
(0.443) (0.498) (0.491) (0.455)
White 0.229 0.077 0.062 0.035
(0.420) (0.267) (0.242) (0.184)
Hispanics 0.405 0.330 0.305 0.230
(0.491) (0.470) (0.461) (0.421)
Other 0.098 0.044 0.037 0.029
(0.298) (0.205) (0.190) (0.167)
Manhattan 0.105 0.217 0.212 0.255
(0.306) (0.412) (0.409) (0.436)
Brooklyn 0.191 0.395 0.289 0.515
(0.393) (0.489) (0.453) (0.500)
Queens 0.580 0.179 0.170 0.008
(0.494) (0.384) (0.375) (0.091)
Bronx 0.047 0.204 0.217 0.222
(0.212) (0.403) (0.412) (0.415)
Staten Island 0.078 0.005 0.112 0.000
(0.268) (0.068) (0.316) (0.000)
Log of average household income 15.969 15.416 15.312 14.989
(0.443) (0.502) (0.399) (0.493)
Percentage of Black Population 11.682 34.396 38.127 52.792
(16.400) (26.566) (20.964) (23.115)
Source: Stop and Frisk Database and American Community Survey (ACS) 2008 -2012
Table 4: Summary Statistics by Geographic Area
Manhattan Brooklyn Queens Bronx Staten Island
Total Number of Observations 212068 343647 224760 169444 45953
Force 0.222 0.173 0.232 0.303 0.181
(0.416) (0.378) (0.422) (0.459) (0.385)
Suspect is female 0.080 0.070 0.057 0.072 0.113
(0.271) (0.256) (0.233) (0.259) (0.316)
Suspect age 30.711 27.941 26.983 26.860 26.845
(12.523) (11.552) (10.635) (10.802) (10.813)
Suspect height 5.730 5.724 5.700 5.713 5.710
(0.273) (0.269) (0.263) (0.266) (0.271)
Black 0.528 0.659 0.411 0.487 0.383
(0.499) (0.474) (0.492) (0.500) (0.486)
White 0.093 0.094 0.111 0.033 0.382
(0.290) (0.292) (0.314) (0.180) (0.486)
Hispanic 0.337 0.215 0.369 0.445 0.205
(0.473) (0.411) (0.483) (0.497) (0.404)
Other 0.042 0.032 0.109 0.034 0.030
(0.201) (0.176) (0.311) (0.181) (0.171)
Log of average household income 15.116 15.442 15.759 15.120 15.768
(0.751) (0.328) (0.508) (0.570) (0.150)
Crime Rate per 100 2.882 2.849 1.765 2.887 2.161
(1.097) (1.025) (0.572) (0.954) (0.798)
Percentage of Black Population 24.347 47.677 24.636 35.856 16.006
(22.220) (29.716) (25.794) (12.384) (11.111)
Source: Stop and Frisk Database, American Community Survey (ACS) 2008 -2012 and Crime Statistics (NYPD database)
Table 5: Logit Results and Marginal Effect for Base Specification Model
VARIABLES Base
Marginal Effects
Black 0.236*** 0.037
(0.010)
Hispanic 0.246*** 0.038
(0.010)
Other -0.002 -0.000
(0.015)
Suspect is female -0.519*** -0.085
(0.012)
Suspect age -0.010*** -0.002
(0.000)
Suspect height 0.146*** 0.024
(0.010)
Reasons for stop object 0.401*** 0.065
(0.015)
Reasons for stop description 0.534*** 0.087
(0.007)
Reasons for stop casing -0.055*** -0.009
(0.006)
Reasons for stop lookout -0.104*** -0.017
(0.007)
Reasons for stop clothing 0.216*** 0.035
(0.011)
Reasons for stop drugs -0.086*** -0.014
(0.009)
Reasons for stop furtive 0.467*** 0.076
(0.005)
Reasons for stop violence 0.492*** 0.080
(0.008)
2007 0.162*** 0.027
(0.010)
2008 0.155*** 0.026
(0.010)
2009 0.194*** 0.033
(0.010)
2010 0.086*** 0.014
(0.010)
2011 -0.023** -0.004
(0.010)
2012 -0.313*** -0.046
2013 -0.186*** -0.028 (0.014)
Manhattan 0.398*** 0.062
(0.009)
Queens 0.308*** 0.047
(0.008)
Bronx 0.674*** 0.113
(0.009)
Staten Island 0.282*** 0.043
(0.014)
Log of Average Household Income -0.068*** -0.011
(0.008)
Unemployment Rate 0.020*** 0.003
(0.001)
Percentage in Population Doing Poorly -0.018*** -0.003
(0.001)
Percentage in Population Struggling 0.027*** 0.004
(0.001)
Crime Rate per 100 0.004*** 0.001
(0.001)
Percentage of Black Population /100 0.070*** 0.011
(0.014)
Constant -2.076***
(0.146) Robust Standard errors in parentheses
*** p<0.01, ** p<0.05, * p<0.1
Very low Crime Rate Low Crime Rate High Crime Rate Very high Crime Rate
VARIABLES Base p<25 25<p<50 50<p<75 p>75
Black 0.240*** 0.273*** 0.195*** 0.0364 0.0816**
(0.0146) (0.0247) (0.0313) (0.0322) (0.0412)
Hispanic 0.245*** 0.317*** 0.204*** -0.0279 0.118***
(0.0147) (0.0228) (0.0318) (0.0334) (0.0427)
Other 0.00855 0.0254 0.0186 -0.165*** 0.0750
(0.0211) (0.0316) (0.0470) (0.0485) (0.0578)
Suspect is female -0.523*** -0.439*** -0.47 7*** -0.572*** -0.571***
(0.0170) (0.0361) (0.0357) (0.0326) (0.0327)
Suspect age -0.00927*** -0.00877*** -0.0111*** -0.0109*** -0.00816***
(0.000332) (0.000723) (0.000694) (0.000650) (0.000629)
Suspect height 0.135*** 0.0794*** 0.167*** 0.152*** 0.134***
(0.0142) (0.0301) (0.0290) (0.0280) (0.0278)
Reasons for stop object 0.422*** 0.431*** 0.408*** 0.287*** 0.517***
(0.0216) (0.0446) (0.0440) (0.0426) (0.0430)
Reasons for stop description 0.536*** 0.564*** 0.585*** 0.412*** 0.570***
(0.00932) (0.0185) (0.0183) (0.0189) (0.0197)
Reasons for stop casing -0.0546*** -0.00519 -0.0245 -0.0732*** -0.107***
(0.00875) (0.0167) (0.0179) (0.0179) (0.0185)
Reasons for stop lookout -0.0974*** -0.0376** -0.143*** -0.131*** -0.108***
(0.0103) (0.0189) (0.0213) (0.0213) (0.0223)
Reasons for stop clothing 0.237*** 0.207*** 0.398*** 0.223*** 0.108***
(0.0159) (0.0331) (0.0319) (0.0304) (0.0331)
Reasons for stop drugs -0.0733*** 0.109*** -0.00548 -0.149*** -0.121***
(0.0130) (0.0302) (0.0260) (0.0249) (0.0247)
Reasons for stop furtive 0.472*** 0.512*** 0.523*** 0.400*** 0.452***
(0.00740) (0.0154) (0.0149) (0.0145) (0.0149)
Reasons for stop viol 0.493*** 0.506*** 0.480*** 0.402*** 0.569***
(0.0115) (0.0214) (0.0237) (0.0236) (0.0242)
2007 0.146*** 0.334*** 0.289*** -0.0801*** 0.111***
(0.0146) (0.0389) (0.0295) (0.0299) (0.0250)
2008 0.156*** 0.213*** 0.364*** -0.263*** 0.221***
(0.0141) (0.0374) (0.0287) (0.0283) (0.0251)
2009 0.188*** 0.314*** 0.265*** -0.280*** 0.330***
(0.0139) (0.0356) (0.0305) (0.0282) (0.0262)
2010 0.0806*** 0.254*** 0.0377 -0.169*** 0.0419
(0.0140) (0.0354) (0.0305) (0.0274) (0.0290)
2011 -0.0282** 0.0719** -0.0761*** -0.196*** -0.0301
(0.0138) (0.0357) (0.0293) (0.0273) (0.0268)
2012 -0.317*** -0.182*** -0.432*** -0.442*** -0.265***
(0.0151) (0.0380) (0.0321) (0.0298) (0.0293)
2013 -0.193*** -0.0718 -0.135*** -0.607*** -0.135***
(0.0204) (0.0452) (0.0385) (0.0485) (0.0432)
Manhattan 0.407*** 0.635*** -0.111*** 0.693*** 0.730***
(0.0127) (0.0354) (0.0254) (0.0319) (0.0373)
Queens 0.307*** 0.445*** -0.0342 0.154*** 0.0401
(0.0119) (0.0223) (0.0243) (0.0379) (0.105)
Bronx 0.675*** 0.815*** 0.212*** 1.037*** 0.511***
(0.0126) (0.0395) (0.0231) (0.0288) (0.0498)
Staten Island 0.289*** 0.794*** 0.279*** 0.287***
(0.0203) (0.0450) (0.107) (0.0296)
Log of Average Household Income -0.0589*** 0.158*** -0.124*** 0.493*** -0.112***
(0.0111) (0.0238) (0.0250) (0.0357) (0.0311)
Unemployment Rate 0.0201*** -0.00978* 0.0611*** 0.0744*** 0.0754***
(0.00208) (0.00505) (0.00395) (0.00626) (0.00547)
Percentage of Population Doing Poorly -0.0191*** 0.0404*** -0.00607*** -0.0275*** -0.0150***
(0.000948) (0.00268) (0.00174) (0.00285) (0.00292)
Percentage of Population Struggling 0.0282*** 0.0270*** -0.0207*** 0.0261*** 0.00229
(0.00126) (0.00303) (0.00277) (0.00325) (0.00419)
Crime Rate per 1000 0.00219***
(0.000601)
Percentage of Black Population 0.000673*** 0.00739*** 0.000907** -0.000297 -0.00274***
(0.000213) (0.000603) (0.000366) (0.000508) (0.000748)
Constant -2.207*** -6.391*** -0.838* -10.47*** -1.459***
(0.208) (0.454) (0.447) (0.623) (0.556)
Observations 488,766 119,742 123,557 116,476 128,991
Robust standard errors in parentheses *** p<0.01, ** p<0.05, * p<0.1
Table 7: Logit results and Marginal Effects for Model Specification with Interaction Term between Race and Crime Rate (Model Specification 1)
VARIABLES Model
Specification 1
Marginal Effects
Black 0.322*** 0.020
(0.013)
Hispanic 0.292*** 0.019
(0.013)
Other 0.043** -0.013
(0.020)
Crime Rate per 100 0.027*** 0.003
(0.003)
Black # Crime Rate -0.032***
(0.003)
Hispanic # Crime Rate -0.019***
(0.003)
Race # Crime Rate -0.018***
(0.005)
Suspect is female -0.520*** -0.086
(0.012)
Suspect age -0.010*** -0.002
(0.000)
Suspect height 0.145*** 0.023
(0.010)
Reasons for stop object 0.399*** 0.063
(0.015)
Reasons for stop description 0.535*** 0.087
(0.007)
Reasons for stop casing -0.054*** -0.008
(0.006)
Reasons for stop lookout -0.104*** -0.017
(0.007)
Reasons for stop clothing 0.216*** 0.035
(0.011)
Reasons for stop drugs -0.086*** -0.014
(0.009) (
Reasons for stop furtive 0.468*** 0.077
(0.005)
Reasons for stop violent 0.492*** 0.080
(0.008)
2007 0.162*** 0.027
2008 0.155*** 0.026 (0.010)
2009 0.193*** 0.033
(0.010)
2010 0.084*** 0.014
(0.010)
2011 -0.024** -0.004
(0.010)
2012 -0.314*** -0.047
(0.011)
2013 -0.187*** -0.029
(0.014)
Manhattan 0.395*** 0.059
(0.009)
Queens 0.307*** 0.046
(0.008)
Bronx 0.670*** 0.111
(0.009)
Staten Island 0.286*** 0.045
(0.014)
Log of Average Household Income -0.067*** -0.010
(0.008)
Unemployment Rate 0.020*** 0.003
(0.001)
Percentage of Population Doing Poorly -0.018*** -0.003
(0.001)
Percentage of Population Struggling 0.027*** 0.005
(0.001)
Percentage of Black Population /100 0.062*** 0.006
(0.015)
Constant -2.139***
(0.146)
Observations 995,871 977,407
Robust standard errors in parentheses *** p<0.01, ** p<0.05, * p<0.1
Table 8: Multinomial Logit Results and Relative Risk Ratios for Model Specification 2
mlogit
results
mlogit results
Relative risk ratio
Relative risk ratio VARIABLES Low force High force Low force High force
Black 0.264*** 0.193*** 1.302*** 1.213***
-0.0116 -0.022 -0.015 -0.027
Hispanic 0.264*** 0.219*** 1.303*** 1.245***
-0.0115 -0.022 -0.015 -0.027
Other 0.0374** -0.135*** 1.038** 0.873***
-0.0163 -0.0337 -0.017 -0.029
Suspect is female -0.552*** -0.545*** 0.576*** 0.580***
-0.0133 -0.0277 -0.008 -0.016
Suspect age 0.00844*** -0.0171*** 0.992*** 0.983***
-0.000251 -0.000542 0 -0.001
Suspect height 0.130*** 0.231*** 1.139*** 1.260***
-0.011 -0.0223 -0.012 -0.028
Reasons for stop object 0.338*** 0.639*** 1.402*** 1.894***
-0.017 -0.0308 -0.024 -0.058
Reasons for stop description 0.431*** 1.019*** 1.539*** 2.769***
-0.00728 -0.0127 -0.011 -0.035
Reasons for stop casing -0.0359*** -0.131*** 0.965*** 0.877***
-0.0066 -0.0137 -0.006 -0.012
Reasons for stop lookout -0.130*** 0.000995 0.878*** 1.001
-0.00782 -0.0157 -0.007 -0.016
Reasons for stop clothing 0.198*** 0.334*** 1.219*** 1.397***
Reasons for stop drugs -0.121*** 0.119*** 0.886*** 1.126***
-0.0102 -0.0193 -0.009 -0.022
Reasons for stop furtive 0.475*** 0.549*** 1.608*** 1.732***
-0.00568 -0.0116 -0.009 -0.02
Reasons for stop violence 0.431*** 0.812*** 1.538*** 2.251***
-0.00888 -0.0159 -0.014 -0.036
2007 0.196*** 0.0437** 1.217*** 1.045**
-0.0112 -0.0217 -0.014 -0.023
2008 0.202*** -0.0245 1.224*** 0.976
-0.0109 -0.0212 -0.013 -0.021
2009 0.241*** 0.0278 1.272*** 1.028
-0.0107 -0.0209 -0.014 -0.021
2010 0.122*** -0.0299 1.129*** 0.971
-0.0108 -0.0209 -0.012 -0.02
2011 0.00899 -0.192*** 1.009 0.826***
-0.0106 -0.0209 -0.011 -0.017
2012 -0.297*** -0.495*** 0.743*** 0.610***
-0.0117 -0.0233 -0.009 -0.014
2013 -0.162*** -0.233*** 0.851*** 0.792***
-0.0158 -0.0304 -0.013 -0.024
Manhattan 0.313*** 0.678*** 1.368*** 1.970***
-0.0102 -0.019 -0.014 -0.037
Queens 0.361*** 0.0403** 1.434*** 1.041**
-0.00923 -0.02 -0.013 -0.021
Bronx 0.628*** 0.916*** 1.873*** 2.499***
-0.00954 -0.0189 -0.018 -0.047
Staten Island 0.345*** 0.159*** 1.413*** 1.173***
Log of Average Household Income -0.0641*** -0.119*** 0.938*** 0.888***
-0.00889 -0.0176 -0.008 -0.016
Unemployment Rate 0.0197*** 0.0189*** 1.020*** 1.019***
-0.00162 -0.00308 -0.002 -0.003
Percentage in Population Doing Poorly -0.0187*** -0.0228*** 0.982*** 0.977***
-0.000724 -0.00142 -0.001 -0.001
Percentage in Population Struggling 0.0342*** 0.0116*** 1.035*** 1.012***
-0.00097 -0.00194 -0.001 -0.002
Percentage of Black Population/100 0.201*** -0.646*** 1.222*** 0.524***
-0.0168 -0.0343 -0.021 -0.018
Crime Rate per 100 0.00437 0.0488*** 1.004 1.050***
-0.00477 -0.0088 -0.005 -0.009
Constant -2.478*** -2.916*** 0.084*** 0.054***
-0.165 -0.329 -0.014 -0.018
Observations 972,931 972,931 972,931
50607.500***
1.16E+06
Robust standard errors in parentheses *** p<0.01, ** p<0.05, * p<0.1
Table 9: Multinomial Logit Results and Relative Risk Ratios for Model Specification 3
mlogit results mlogit results Relative Risk Ratio
Relative Risk Ratio VARIABLES Low force High force Low force High force
Black 0.750*** 0.639*** 2.117*** 1.895***
-0.0246 -0.0459 -0.052 -0.087
Hispanic 0.675*** 0.468*** 1.964*** 1.596***
-0.0251 -0.0469 -0.049 -0.075
Other 0.259*** -0.0837 1.296*** 0.92
-0.0372 -0.0745 -0.048 -0.069
Crime Rate per 100 0.207*** 0.200*** 1.230*** 1.222***
-0.01 -0.0172 -0.012 -0.021
Black # Crime Rate -0.235*** -0.203*** 0.791*** 0.816***
-0.0102 -0.0184 -0.008 -0.015
Hispanic # Crime Rate -0.210*** -0.130*** 0.811*** 0.878***
-0.0107 -0.0193 -0.009 -0.017
Other # Crime Rate -0.121*** -0.039 0.886*** 0.962
-0.0158 -0.03 -0.014 -0.029
Suspect is female -0.557*** -0.552*** 0.573*** 0.576***
-0.0133 -0.0278 -0.008 -0.016
Suspect age -0.00857*** -0.0173*** 0.991*** 0.983***
-0.0003 -0.0005 0 -0.001
Suspect height 0.127*** 0.227*** 1.136*** 1.255***
-0.011 -0.0223 -0.012 -0.028
Reasons for stop object 0.333*** 0.634*** 1.395*** 1.886***
-0.017 -0.0308 -0.024 -0.058
Reasons for stop description 0.430*** 1.018*** 1.538*** 2.767***
Reasons for stop casing -0.0339*** -0.128*** 0.967*** 0.880***
-0.0066 -0.0137 -0.006 -0.012
Reasons for stop lookout -0.128*** 0.00353 0.880*** 1.004
-0.0078 -0.0157 -0.007 -0.016
Reasons for stop clothing 0.196*** 0.332*** 1.217*** 1.394***
-0.0123 -0.0228 -0.015 -0.032
Reasons for stop drugs -0.122*** 0.118*** 0.885*** 1.125***
-0.0102 -0.0193 -0.009 -0.022
Reasons for stop furtive 0.476*** 0.550*** 1.609*** 1.733***
-0.0057 -0.0116 -0.009 -0.02
Reasons for stop violence 0.430*** 0.811*** 1.537*** 2.250***
-0.0089 -0.0159 -0.014 -0.036
2007 0.198*** 0.0451** 1.219*** 1.046**
-0.0113 -0.0217 -0.014 -0.023
2008 0.203*** -0.024 1.225*** 0.976
-0.0109 -0.0212 -0.013 -0.021
2009 0.240*** 0.0266 1.271*** 1.027
-0.0107 -0.0209 -0.014 -0.021
2010 0.119*** -0.0322 1.127*** 0.968
-0.0108 -0.0209 -0.012 -0.02
2011 0.00714 -0.193*** 1.007 0.824***
-0.0106 -0.0209 -0.011 -0.017
2012 -0.298*** -0.496*** 0.742*** 0.609***
-0.0117 -0.0233 -0.009 -0.014
2013 -0.164*** -0.236*** 0.849*** 0.790***
-0.0158 -0.0304 -0.013 -0.024
Manhattan 0.298*** 0.665*** 1.347*** 1.944***
-0.0102 -0.019 -0.014 -0.037
Queens 0.356*** 0.0399** 1.428*** 1.041**
Bronx 0.611*** 0.893*** 1.842*** 2.442***
-0.0097 -0.019 -0.018 -0.046
Staten Island 0.360*** 0.178*** -0.023 -0.037
-0.0158 -0.0311 0.937*** 0.890***
Log of Average Household Income -0.0646*** -0.116*** -0.008 -0.016
-0.0089 -0.0177 1.021*** 1.020***
Unemployment Rate 0.0211*** 0.0197*** -0.002 -0.003
-0.0016 -0.0031 0.982*** 0.978***
Percentage in Population Doing Poorly -0.0184*** -0.0223*** -0.001 -0.001
-0.0007 -0.0014 1.035*** 1.012***
Percentage in Population Struggling 0.0343*** 0.0122*** -0.001 -0.002
-0.001 -0.0019 1.203*** 0.517***
Percentage of Black Population/100 0.185*** -0.659*** -0.02 -0.018
-0.0168 -0.0342 0.057*** 0.039***
Constant -2.861*** -3.256*** -0.009 -0.013
-0.166 -0.329
972931
Observations 972,931 972,931 51259.970***
1.16E+06
Robust standard errors in parentheses *** p<0.01, ** p<0.05, * p<0.1
Figure 1: Trend of Total Number of Individuals Stopped by Police
Source: Stop and Frisk Database
Figure 2: Racial Composition of Individuals Stopped by Police.
Figure 3: Incidence of Force applied by Police
Figure 4: Incidence of Force Applied by Police on Each Race
iSmith, Doughlas A. 1986. "The Neighbourhood Context of Police Behaviour." Communties and Crime, editedby Albert J. Reiss, Jr., and Michael Tonry.
Chicago: Universiyt fo Chicago Press.
iiNew York State Office of Attorney General, An Investigation into NYPD’s “Stop and Frisk” Investigation, 1999. Accessed November 2, 2014,
http://www.oag.state.ny.us/sites/default/files/pdfs/bureaus/civil_rights/stp_frsk.pdf
iiiAndrew Gelman, Alex Kiss, Jeffrey Fagan. “An Analysis of the NYPD's Stop-And-Frisk Policy in the Context of Claims of Racial Bias” Columbia Public Law
Research Paper No. 05-95. (2006): http://ssrn.com/abstract=846365 or http://dx.doi.org/10.2139/ssrn.846365
iv Ibid.