Understanding Developmental Plasticity in Coloration Among Playa
Populations of S. bombifrons
Dylan Gerard Carroll
Principle Investigator: David Pfennig, Ph. D.
A thesis submitted to the faculty at the University of North Carolina at Chapel Hill in partial fulfillment of the requirements for graduating with Honors in the Department of Biology in the College of Arts and
Sciences
Chapel Hill 2014
Approved by:
Abstract
Developmental plasticity can lead to genetically similar organisms displaying drastically different
phenotypes in direct response to environmental cues. This research examined whether phenotypic
plasticity in coloration occurs among spadefoot toad tadpoles, Spea bombifrons. In the wild, S. bombifrons tadpoles inhabit ponds exhibiting a wide range of color environments, and previous observations had suggested that these tadpoles might engage in background color matching. I
specifically evaluated whether these tadpoles can alter their coloration in direct response to background
coloration or light intensity. I found that substrate coloration influences the coloration of spadefoot
tadpoles and metamorphs, as those raised on a lighter substrate developed a lighter coloration than
those raised on a darker substrate. Furthermore, this plasticity was found to be indeterminate, as
juvenile toads not subjected to substrate or light treatments for a month lost the coloration differences
found between them at the tadpole and metamorph stages. The results of this experiment could help
display how developmental plasticity evolves to respond to environmental cues and its role in aiding the
way organisms adapt to novel environments.
Introduction
Developmental plasticity is the ability of an organism to alter its phenotype in response to
environmental cues. Increasingly, such developmental flexibility is viewed as an important mechanism
for creating diversity both within species and among them (WestEberhard 2003; Pfennig et al. 2010;
Moczek et al. 2011). Clades in which developmental plasticity is observed tend to have more species,
suggesting that plasticity may play a major role in speciation (Pfennig and McGee 2010).
that usually accompany directional selection (Price et al. 2003). This ability to respond to environmental
conditions and avoid having to evolve through an evolutionarily unfit intermediate stage can allow
organisms to survive in habitats where conditions and resources are unpredictable and differ greatly
from generation to generation or season to season. Developmental plasticity can either be determinate
or indeterminate. Determinate plasticity occurs when the phenotype becomes fixed after the initial
period of exposure to the determining environmental cue. Indeterminate plasticity occurs when the
phenotype is flexible and can continue to change the environmental conditions to which the organism is
subjected.
In recent decades, spadefoot toads of the genus Spea has been shown to have an incredible amount of developmental plasticity (reviewed in LedonRettig and Pfennig 2011). Spea are predominately found in the American southwest and northern Mexico where they resides in dry,
unpredictable desert environments. Adults burrow in the sand for large periods of time, coming up to
find food and breed. The tadpoles of this clade develop in temporary ponds and must take advantage
of what little resources are available. During their tadpole stage, Spea develop into one of two morphs, an omnivorous or a carnivorous morph (figure 1, bottom right). The two morphs express different
morphological features, such as long snouts in carnivores and significantly longer intestinal tracts in
omnivores, which help the tadpole specialize in uptake of different types of food. This significant
difference in morphology is a response to the availability of shrimp in the pond, as tadpoles that eat a
large amount of this shrimp develop morphology that aids in carnivorous activities while tadpoles which
do not eat a significant
Figure 1: Top Left—a typical Blue Sky pond with its unique white sand substrate. Bottom Left—a tadpole with the white coloration phenotype found in Blue Sky populations. Top Right—a typical pond in which Spea tadpoles live.
Bottom Right—a carnivore tadpole (left) and an omnivore tadpole (right) of normal coloration phenotypes
amount of these shrimp develop a morphology which gives them a benefit in eating detritus at the bottom
of the pond. Spea can also regulate their metamorphosis in response to factors such as pond level and food availability. If Spea tadpoles find themselves in an environment where either there is a low pond level, indicating that their pond is drying up, or an environment with very little food, the endocrine system
involved in their metamorphosis will activate early to allow the tadpole to become a toad before the
pond dries up or food runs out (Boorse, 2003).
A unique example of this developmental plasticity occurs in the Blue Sky population of Spea. Blue Sky contains unique playa habitats, which have a substrate of much lighter sand (figure 1, top left)
response to the unique conditions of their habitat, the S. bombifrons found near these ponds have evolved a derived white coloration in their tadpoles, most likely as a form of crypsis. However, when
toads from Blue Sky are removed from their environment and mated in the laboratory, the resulting
offspring display the normal coloration phenotype of Spea tadpoles, indicating that this white coloration is likely a plastic trait which is environmentally induced by some factor in the playa ponds. Because the
unique white phenotype is only observed in tadpoles from playa ponds, it is expected that either a lighter
substrate or a darker light intensity environment could play a role in inducing this white coloration
phenotype. An understanding of this phenomenon, how it is induced, and subsequently how it has
evolved, could be significant to further our understanding of plasticity in the Spea genus of spadefoot toads and its role in the process of evolution.
Materials and Methods
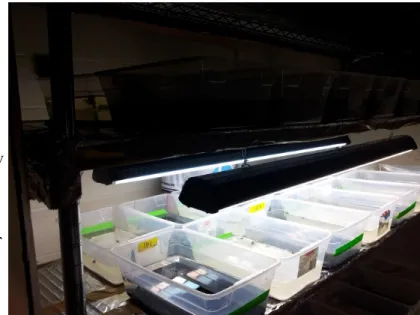
In order to detect the effects of light intensity and sand coloration on Blue Sky tadpoles, an
experiment was set up on two racks, each with five shelves. Each shelf was lined with aluminum foil to
keep light conditions contained to each individual shelf, and a cardboard box was placed over the top
and hanging out over the side of the second rack to keep the light from each rack from reaching the
other rack. On the bottom four shelves of each rack, two rows of aquaria were placed, each containing
seven aquaria and alternating between black and white sand as the substrate used in the aquarium.
Above the bottom and third shelf on each rack, two long light fixtures were hung, one above each row
of aquaria. Each light fixture contained both a 10
Figure 2: The experimental setup. Left—the relationship of the two racks relative to one another, with the
cardboard blocking light from reaching the other shelf.
Right—the experiment alternated dark and light shelves, as well as black and white sand aquaria on each shelf.
UVB Reptiloglow light and a 2 UVB Reptiloglow
light. Through these lighting fixtures, a light
treatment was created on shelves one and three of
each rack and a dark treatment was created on
shelves two and four of each rack, with each rack containing seven black substrate aquaria and seven
white substrate aquaria for its respective treatment (Figure 2). Once the experimental room was set up,
female toads from the Blue Sky populations were examined for their gravidity. Female LF1/LF3 from
cage 7225 and male RF2/RF3/RF4 from cage 7214, both from the Blue Sky population, were then
given injections and placed in a mating tank to obtain the Blue Sky tadpoles which were used in the
experiment. After these tadpoles were four days old, they were moved into the experimental aquaria.
Eight tadpoles were placed in each tank, with slightly over half of the tanks containing nine tadpoles to
account for extra tadpoles from the breeding. On the first day, each aquarium was fed 30 mg of ground
cichlid food which was then increased to 45 mg for each day afterwards. Over the course of the
experiment, dead tadpoles were placed in ethanol in groups by treatment, shelf, and date of death.
The goal of the experiment was originally to continue the treatments over fourteen days from the
breeding. However, data collection from the main experimental group began twelve days into the
experiment, on November 8th, because of the large numbers of tadpoles in the light treatments that were
dying. On day twelve the tadpoles from the front of the first shelf were photographed, on day thirteen
the tadpoles on the back of the first shelf and front of the second shelf were photographed, and on day
two pictures of the dorsal side was obtained by a camera in aperture priority mode with settings at an F
of 11 and an ISO of 200. The two tadpoles with the most significant and representative phenotype
from each aquarium, except for those from the dark treatment on the back of shelf two, were also flash
frozen for later study of their RNA expression levels.
After the photography, the lights on the individual shelves were turned off and the overhead full
spectrum lights were turned on. The tadpoles were raised in a similar manner as before until they
became metamorphs. When each tadpole sprouted forelimbs they were moved into a beach tank
based off of the treatment in which they were raised where half of the tank contained water and the
other half contained regular beach sand. These metamorphs were not fed as they obtained nutrients
from absorption of their own tail. The tadpoles started becoming metamorphs on November 23rd and
the last metamorphs became juvenile toads on January 8th. Of the metamorphs, 20 from each of the
dark treatments, 18 from the light black, and 15 from the light white treatments were photographed
under the conditions and settings previously described for the tadpoles between December 5th and
December 12th.
Once each metamorph had absorbed its tail, it was moved to a juvenile toad cage based on the
treatment in which it had been raised. The juveniles were fed ¼ inch crickets. On February 18th,
twenty four toads from the light white and each of the dark treatments, as well as twenty three toads
from the light black treatment, were photographed under the same conditions and settings as the
tadpoles.
Results
each raw picture, the photograph was white balanced to the third shade of grey on a standard six shade
greyscale. The gamma level was set at 1.00 to standardize the colors against one another, the
compression level was set to 100, and each photograph was then saved to be analyzed using ImageJ.
In ImageJ, the pictures of the tadpoles were outlined by using a polygon tool to outline the frame of the
tadpole and excluding any bright spot that resulted from light reflected from the flash of the camera.
This was used to obtain an RGB mean value for each tadpole. RGB is a
Figure 3: Aquarium average tadpole RGB value by treatment. Diamonds show ANOVA analysis with averages and lower and upper 95% brackets. Circles show the TurkeyKramer HSD analysis. The table shows RGB means for each treatment and the TurkeyKramer group(s) which each treatment falls into. A treatment is insignificant from all others with which it shares a TurkeyKramer group. D means the tadpole was raised in the dark, L means the tadpole was raised in the light, B means the tadpole was raised on black sand, and W means the tadpole was raised on white sand.
and upper 95% brackets. Circles show the TurkeyKramer HSD analysis. The table shows RGB means for each treatment and the TurkeyKramer group(s) which each treatment falls into. A treatment is insignificant from all others with which it shares a TurkeyKramer group. D means the tadpole was raised in the dark, L means the tadpole was raised in the light, B means the tadpole was raised on black sand, and W means the tadpole was raised on white sand.
measurement of color where lower numbers are equivalent to a darker color and higher numbers are
equivalent to a lighter color. The RGB values from each picture were averaged for each tadpole,
metamorph, and juvenile toad. Furthermore, the RGB averages of each tadpole were then averaged by
the aquaria in which the tadpole was raised. These values were then analyzed using ANOVA and a
TurkeyKramer honest significant difference test to determine significance between the RGB values of
each treatment.
The TurkeyKramer HSD test showed an interesting set of results for tadpole coloration.
Tadpoles raised in white sand and light were found to be significantly lighter than those raised in either
black sand treatment, but not those raised in white sand and the dark (Figure 3). Similarly, tadpoles
raised in white sand and the dark were significantly lighter than those raised in black sand and light, but
not significantly different from tadpoles raised in white sand and light or black sand and the dark (Figure
3). Turkey Kramer analyses showed a similar coloration affect amongst the metamorphs as amongst
the tadpoles. Metamorphs raised in the light and white
Figure 5: Juvenile toad average RGB value by treatment. Diamonds show ANOVA analysis with averages and lower and upper 95% brackets. Circles show the TurkeyKramer HSD analysis. The table shows RGB means for each treatment and the TurkeyKramer group(s) which each treatment falls into. A treatment is insignificant from all others with which it shares a TurkeyKramer group. D means the tadpole was raised in the dark, L means the tadpole was raised in the light, B means the tadpole was raised on black sand, and W means the tadpole was raised on white sand.
sand treatment showed significantly lighter coloration than those raised in either of the black sand
treatments, but were not significantly lighter than those raised in the dark and black sand treatment
(Figure 4). However, similar analysis of the juvenile toads showed similar average RGB values and no
statistically significant difference in coloration between toads raised in any of the four treatments after
being removed from that treatment for at least a month and a half (Figure 5).
Discussion
The results of this experiment revealed many interesting trends in coloration plasticity of the
playa S. bombifrons populations of spadefoots. As tadpoles and metamorphs raised in the white sand treatments tended to be significantly lighter than those in the black sand treatments, this experiment
indicates that sand coloration was rather important in influencing tadpole and toad coloration. Among
black sand populations, for all three life stages, there was no significant difference, indicating that light
intensity does not play a major role in influencing tadpole and toad coloration. However, light and white
sand treatment tended to be the most significantly different treatment in both the tadpoles and
metamorphs, being lighter than both black sand treatments. Because the dark and white sand treatment
did not show this degree of significance from the black sand treatments, the difference between the
coloration of tadpoles and metamorphs raised on the two white sand treatments is due to light
conditions. In this light, it is hypothesized that the playa spadefoots use their visual system to influence
whether they will become lighter or darker depending on the substrate on which they are raised. In the
the white sand treatments, the substrate was appeared brighter in the light than in the dark. In the light
and white sand treatment, the tadpoles’ visual system likely reacted to this apparently brighter substrate
coloration and influenced the tadpoles’ coloration to become lighter for a greater degree of crypsis.
This pattern continued to the metamorphs, indicating that the coloration plasticity continues into the toad
stage of the spadefoot’s life.
The data on the toads indicates another important quality of this coloration plasticity in the playa
spadefoots. Because none of the treatments were significantly different in coloration after being
removed from the treatments for at least a month and a half, this coloration plasticity is indeterminate
and the tadpoles and toads are constantly reacting to their environment and adjusting their coloration.
This is important as it allows the study of this coloration plasticity at any stage in the spadefoot’s life.
While these findings are promising in determining how playa spadefoots obtain their unique form
of coloration plasticity, there is still a large amount of work to do in determining exactly how this
coloration plasticity occurs. While sand color may play a role in determining this phenotype, it is likely
only a small part of this process if at all. While the tadpoles and metamorphs did display differences in
coloration after being raised in white sand, none of these tadpoles displayed the unique white phenotype
of the playa spadefoots. The next step in the research of the coloration plasticity of the playa spadefoots
is to determine the qualities of the plasticity displayed in this experiment. We will run a similar
experiment to this with nonplaya S. bombifrons to determine whether the coloration plasticity found in this experiment is unique to playa spadefoots or is a common plastic response amongst all S.
likely some other factor, either from a predator or naturally occurring in the playa ponds, involved in
determining the white playa phenotype. Such a factor is likely correlated with the white sand of the
playa environment and thus would be a good predictor of the usefulness of the white phenotype for
purposes of crypsis. We hypothesize that such a factor could have coopted the visual coloration
plasticity pathway and allowed this pathway to display a much more extreme phenotype. Such a
mechanism would indicate an instance in evolution where a previously present plasticity was coopted in
a unique environment to plastically display a more extreme phenotype which would be helpful in the
unique playa environment.
While many of the results of this experiment are inconclusive at this point, they are also
promising for future research on the white playa phenotype in the tadpoles of these populations of S. bombifrons. The experiment shows that playa spadefoots have a form of indeterminate coloration plasticity that responds to substrate coloration. It is highly likely that this pathway is influenced by the
spadefoot’s visual pathway, thus giving the tadpole a manner in which to respond to its environment and
develop a form of crypsis to blend with the substrate found in playa ponds. Furthermore, it is likely that
this pathway evolved in the playa environment and eventually became coopted by an environmental
predictor in these ponds which is highly correlated with the white sand of the playa environment. Such
results display the important role in which plasticity can play in evolution and indicate in instance in which
plasticity can evolve to create unique and extreme phenotypes in clades with plastic organisms. Such an
understanding of plasticity can help explain rapid evolution of novel phenotypes and the start of
speciation among organisms with developmental plasticity.
References
Boorse, Graham C., and Robert J. Denver. "Endocrine Mechanisms Underlying Plasticity in Metamorphic Timing in
Spadefoot Toads." Integrative and Comparative Biology43.5 (2003): 64657. Print.
Denver, Robert J. "Hormonal Correlates of Environmentally Induced Metamorphosis in the Western Spadefoot
Toad,Scaphiopus Hammondii." General and Comparative Endocrinology 110.3 (1998): 32636. Print.
Fernandez, Philip J., Jr., and James P. Collins. "Effect of Environment and Ontogeny on Color Pattern Variation in
Arizona Tiger Salamanders (Ambystoma tigrinum nebulosum Hallowell)." Copeia 1988.4 (1988): 92838.
Print.
LedónRettig†, C. and Pfennig, D. W. 2011. Emerging model systems in ecoevodevo: the environmentally
responsive spadefoot toad. Evolution and Development 13: 391400.
Leichty, Aaron R., David W. Pfennic, Corbin D. Jones, and Karin S. Pfennig. "Relaxed Genetic Constraint Is Ancestral
to the Evolution of Phenotypic Plasticity." Integrative and Comparative Biology 52.1 (2012): 1630. Print.
Licht, Lawrence E., and Karen P. Grant. "The Effects of Ultraviolet Radiation on the Biology of
Amphibians." Integrative and Comparative Biology 37.2 (1997): 13745. Print.
Moczek AP, Sultan SE, Foster S, LedonRettig C, Dworkin I, Nijhout HF, Abouheif E, Pfennig DW. 2011. The role of
developmental plasticity in evolutionary innovation. Proceedings of the Royal Society B: Biological
Sciences 278: 27052713.
Pfennig DW, McGee M. 2010. Resource polyphenism increases species richness: a test of the hypothesis.
Philosophical Transactions of the Royal Society of London, Series B 365: 577591.
Pfennig, David W., Matthew A. Wund, Emilie C. SnellRood, Tami Cruickshank, Carl D. Schlichting, and Armin P.
Moczek. "Phenotypic Plasticity’s Impacts on Diversification and Speciation." Trends in Ecology and
Pfennig DW, Wund MA, SnellRood EC, Cruickshank T, Schlichting CD, Moczek AP. 2010. Phenotypic plasticity’s
impacts on diversification and speciation. Trends in Ecology and Evolution 25: 459–467.
Price TD, Qvarnstrom A, Irwin DE. 2003. The role of phenotypic plasticity in driving genetic evolution. Proceedings
of the Royal Society of London, Series B 270: 14331440.
Rosenblum, Erica B., and Luke J. Harmon. "“Same But Different”: Replicated Ecological Speciation At White
Sands." Evolution 65.4 (2010): 94660. Print.