! ! !
QUALITY TEACHERS WANTED: AN EXAMINATION OF STANDARDS-BASED EVALUATION SYSTEMS AND SCHOOL STAFFING PRACTICES IN NORTH
CAROLINA MIDDLE SCHOOLS
Shanyce L. Campbell
A dissertation submitted to the faculty of the University of North Carolina at Chapel Hill in partial fulfillment of the requirements for the degree of Doctor of Philosophy in the Department of Public Policy
Chapel Hill 2014
Approved by:
©2014
! ! !
ABSTRACT
SHANYCE L. CAMPBELL: Quality Teachers Wanted: An Examination of Standards-Based Evaluation Systems and School Staffing Practices in North Carolina Middle Schools
(Under the direction of Dr. Gary T. Henry)
A quality education has substantial returns such as higher wages, improved health,
reduced incarceration rates and increased civic engagement. While there are long-term benefits
to obtaining an education, research continues to highlight disparities in the educational
opportunities students receive. Recent, policy efforts to improve education for all students has
focused on teachers, because they are the most influential school-level factor to student success.
This dissertation examines the ways in which school leaders recruit, allocate, and
evaluate beginning teachers across North Carolina’s middle schools in efforts to improve student
success. Understanding these dynamics can help policy makers create and implement policies
geared towards improving the quality of teachers in classrooms. In the first chapter, I use
administrative data to examine whether principals’ evaluation ratings of teachers validly reflect
teachers’ effectiveness, as measured by value-added scores. This chapter also examines whether
principals fairly evaluate teachers based on teachers’ race, ethnicity, and gender. In the second
chapter, I assess how principals evaluate teachers based classroom and school characteristics.
Analyses suggest that there are marginal differences in evaluation ratings based on teachers’
ascriptive characteristics – race, ethnicity, and gender. However, classroom and school
characteristics has little to no relationship on teachers’ evaluation ratings.
In the third chapter, I employ a qualitative case study design to understand how
! ! !
(English language arts, math, science, social studies) middle grade teachers and principals from a
large district, show little evidence that beginning teachers hold specific preferences when
applying for and accepting teaching positions. Conversely, school leaders do not intentionally
seek out beginning teachers in staffing their schools. As it relates to how teachers are assigned to
the classroom, school leaders use of a “spread the wealth” philosophy and strategy among ELA
and math teachers to ensure all teachers teach a heterogeneous group of students.
This dissertation addresses an important but often overlooked area in education policy –
equitable evaluation and assessment of beginning teachers. Much of the research on improving
student achievement has focused on how best to measure teacher effectiveness – credentials or
value-added estimates. As school leaders continue to improve the quality of education for
students, the results presented here suggest several possible ways achieve this goal. In these
analyses, classroom and school characteristics are not associated with evaluations ratings;
however, there is an association between evaluation ratings and the race/ethnicity and gender of
teachers, after controlling for teachers’ performance. This underscores the need for North
Carolina to develop a rigorous statewide training on the proper use of the evaluation rubric.
Furthermore, the findings indicate that school leaders use an equity-based approach to ensure
that no teacher is assigned to all high performing or low performing students. This strategy
assumes that all teachers have the knowledge, skills, and dispositions to teach all students;
however, if this hypothesis is inaccurate school leaders may want to reconsider the weight placed
! ! !
This dissertation is dedicated to my late grandmother, A. Nadine Williamson, who spent
over 25 years in service as an educator and all educators who tirelessly work to educate our
#"!
ACKNOWLEDGMENTS
I am grateful to formally express my deep appreciation and gratitude to those who have
helped me complete this journey. First and foremost, I would like to thank my co-author, the one
who created my innermost being, who knit me together in my mother’s womb, and fearfully and
wonderfully made me in your image – my Abba. This journey could not and would not have
been completed without your grace, mercy, joy, peace, assurance, and protection. Your works
are wonderful and I know this very well (Psalms 139:13). In those dark places, where I felt like
giving up you constantly reminded me that you started this journey and would complete it
(Philippians 1:6). You were there many of days when this journey seemed unbearable, but you
guided me through it your mighty right hand (Psalms 73:23, 139:10). Through the process of
becoming Dr. Campbell, you have taught me to persevere, fight, listen, trust, and completely
surrender my life’s work to glorify you. Although, I am not all the way perfected, everyday I am
learning to seek you for my daily bread, not leaning on my own limited understanding, and
acknowledging that you are where my help comes from.
Thank you Gary T. Henry, my Chair, for your guidance and support even before
becoming my chair. You provided several opportunities for me to grow as an independent
scholar and challenged me to think outside of my box and explore new ideas. On a personal
level, thank you for allowing me a safe space to share my struggles and my frustrations.
I thank each of my committee members, Doug Lauen, Karolyn Tyson, Steve Hemelt, and
Lora Cohen-Vogel, for their contribution to the rigor of your research by sharing their expertise
#""!
not only as a committee member, but as a mentor. Thank you for pushing me
intellectually, but doing so with such humility. Your candid advice and support definitely helped
me persist on this journey.
Many thanks to all of the staff, faculty, and doctoral students in the Department of Public
Policy for your instruction, support, and laughs through the doctoral program. Gail Corrado,
what would I have done without you???!! You are an amazing mentor, advocate, and friend,
who constantly assured me that ‘I know enough, I’m good enough, and I am enough.’ You have
taught me to think outside of box of normalcy in order to instigate real change. You have given
me an arsenal of strategies and ideas to use in advocating for marginalized populations. Christine
Durrance, thank you for being a wonderful econ professor and allowing me the space to be
completely vulnerable, lost, and confused. More importantly, thank you for allowing the space to
vent and share my life issues.
Much thanks to my original cohort members – Kevin Bastian, Shelley Golden, Jade Marcus Jenkins, Jaehee Park, and Roderick Rose. Since our first day at math camp (excluding
Rod because he was too smart for that nonsense !), we became not only a cohort, but a family. As a family we have had some great experiences such as seeing kids start walking and talking,
marriages, and new jobs. Together, we have also experienced some not so good events such as
deaths of loved ones and animals, and job/research frustrations. Thank you all of always helping
me think through concepts, teaching me new STATA and SAS commands, and simply keeping
me sane and encouraged to along this journey. Special shout out to my cohort sisters – Shelley
and Jade. Shells, what an awesome sister I have in you. You always made sure I was fed and
brought me into the entire “GoBo” family. While I’m on the GoBo’s, Tom, thank you for being a
#"""!
was also concerned about my wellbeing. AGGIE PRIDE!!! Jade, hey boo hey! You have been
such a wonderful sister. I know that if there was anything I needed you were always there. You
both accepted me fully and authentically and I am blessed to call you both my sisters and friends.
To the doctoral students who came before me, thank you for giving me honest insights
about the process – Amber Peterman, Sanya Carley, Jon Spader, Stephanie Potochnick, and Lisa
Goble. Lisa, you gave me such hope to complete this dissertation. Thank you for your genuine
concern about me and for studying with me so that we could get those comps done! To those
who came after me thank you for allowing me to pass the insights forward – Kristina ‘Tina’
Patterson, Lauren Lanahan, Yuna Kim, and Emily Nwakpuda. Special shout out to Tina. Thank
you for always being there to help me figure out STATA and listen to me vent. Now it’s time to
coach you out of grad school, because I’m excited about all that you are about to do as a youth
civic engagement scholar.
Much thanks is also extended to the School of Education. It was in this School that I first
felt appreciated as an intellectual and scholar. Eileen Parsons, I remember walking into your
class on the first day and being able to “breathe”. You gave me the space to thrive as a scholar.
Thank you for being a genuine mentor and for helping me develop as a critically conscious
scholar. Thanks for also introducing me to Critical Race Theory, which has opened up so many
networks and supports that I didn’t know existed in academia. Thank you George Noblit for
having confidence in my scholarly work and entrusting me to lead the quantitative strand of two
evaluation projects. More than you may know, your affirming words encouraged me many days
when I questioned myself as a researcher. Your mentorship and honesty has been invaluable.
Thank you to Dana Griffin for being a mentor and big sister. Thanks also for all of your advice
"$!
Thank you to the Education Policy Initiative at Carolina for providing me with a research
assistantship that allowed me to acquire technical and professional skills.. A special thank you to
Elizabeth D’Amico for your constant support and encouragement. You so selflessly gave your
time to edit my dissertation and conference presentations. You made sure that I had everything I
needed to get through this journey…chocolate rock candy, bars, books, a listening ear, the list
can go on and on. Thank you somehow doesn’t seem like enough for all that you did over the
past 4 years, but know nothing went unnoticed and EVERYTHING was appreciated. To Heather
Higgins Lynn and Aubrey Comperatore, you ladies have allowed me to grow and develop as a
scholar, leader, and friend. Truly honored to get to spend the past couple of years developing
such genuine friendships with you both. Look forward to years of publishing, vacays, and laughs.
Rhonda Vonshay Sharpe, my mentor, thank you, thank you, thank you! Not many times
do you meet someone who you don’t initially get along with, but later develop such a close bond.
LOL! Rhonda, thank you so much for believing in my potential even before I entered into grad
school. Throughout this journey, you supported and opened so many doors for me to grow and
develop as a scholar. Thank you for also being such a strong advocate and going above and
beyond to ensure that I finished this process. Just as I owe my first single-authored publication to
you, I also honor your with this dissertation – your P.I.T. (princess-in-training).
William ‘Sandy’ Darity, thank you taking me in as one of your own students. You
provided great mentorship, provided opportunities for me to present my research, and connected
me to networks that would ultimately become key supports throughout this journey…thank you!
Thank you to my virtual village, the Black Ph.D. Network Facebook group. This group
allowed me to celebrate with other Black scholars as they completed milestones throughout the
$!
Valarie Ashby you taught me that my voice is valuable in a space that has tried many
times to marginalize and silence my voice. Thank you for your candid words of encouragement
early in this journey.
I am grateful for each of my therapist who helped get me through this process, with
minimal mental health damage. A special thank you to Wanda Tyndall White for getting me to a
place to mentally to take care of myself while sacrificing myself in service to others. Thank you
for being a part of my healing with your candid, honest, and solution-oriented advice. It all
helped carry me throughout this journey.
Thank you to Winnie Ayers, Captola Harris, Linda Holinshed, and Norma Monroe for
being my “other mothers” who genuinely loved me, corrected my grammar, provided me access
to scholarships for college.
Thank you to staff and faculty at the greatest higher ed institution in the world – North
Carolina A& T State University – for teaching me that ‘you lead by serving and you serve by
leading.’ Thank you Quiester Craig, my Dean, for your belief in me as a student, leader, and
scholar. Thank you to Gwendolyn “Dr. HQ” Highsmith-Quick for being my “other mother” and
mentor. Scott Simkins, thank you encouraging me to consider the Ph.D and economics…I didn’t
become an economist, but I got real close…
The terms family and friends are synonymous concepts to me so I will thank my capital
F, Family. Thank you to the Williamson, Hudson, Berry, and Rhodes-Sankofa Waters families.
To my mother, Ina Rhodine Hudson, thank you for life. Who would I be if we didn’t share in
life’s trials and tribulations together? Who would I be if I couldn’t be your “Precious Jewel?”
$"!
how to forgive. All of which I used to get through this journey, so I honor you with this
dissertation, because it is just as much yours as it is mine. I love you!
To my dad, Cartrell Hudson, thank you for always being a listening ear, even when you
had no idea what I was talking about. I don’t think I would have made it through this journey
without your daily calls just “to hear my voice” and laugh hysterically about the simple things.
Thank you for being an awesome dad, who wouldn’t allow me to quit when I wanted to and who
I could call wanting nothing at all. I also honor you with this dissertation. I love you!
To the Brooks family, thank you for allowing me to just be your sister and an auntie. You
all gave me a way to escape the daily grind of disseratating to enjoy skype-versations (yea I just
made up a word). Jackie Brooks, my sister, your support has always been endless, whether it was
flying to Chicago to be by my side or just allowing me to vent. I love you my big, little sister!
Thank you to my aunt, Yvette Williamson, who has always been my advocate, my
support, and my friend. Whether you realize it or not, your life has been such an example and
encouragement me along this journey. You are such a wonderful example of a beautiful and
resilient woman. Vette, you have taught me to endure, to love BIG, to hope for better, and to put
action to my words. You have proved the adage that says, “a setback is just a setup for a
comeback.” In those days when I needed encouragement to push through setbacks, I was
reminded of you. I am proud of all that you have achieved in the health field and honor you with
this dissertation. Your Beacer loves you!
Tanesha Berry, my sister, thank you living out this journey with me. You were there
before the idea of getting a Ph.D. and have been here through the entire process. You were there
to celebrate and cry with me! In those dark times, when I was frustrated and wanted to give up
$""!
along this process, you also encouraged me to keep going. Every card and gift that you sent to
simply say ‘I’m thinking of you’ always assured me that no matter what I knew I had you in my
corner. Thank you for doing life with me for over twenty years. You are such treasure and I
honor you with this dissertation.
Billye and Malari Sankofa Waters, my sister and brother, thank you both for being my
life vests throughout this process. Malari, you challenged me to think more deeply as an
intellectual, but also allowed me to not think at all and just ‘Be.’ I’m am grateful to have such a
smart, inquisitive, and hilarious brother. Billye…can I just stop there?! From the day you
accosted me with a big, invasive hug, I knew you were different, strange, full of love, and
permanent! SMH…LOL! I love you for being all those things and more…your love, prayers,
sisterhood, etc. etc. are endless. I am forever indebted to you for being such a solid rock of
support throughout this journey. Thank you for doing life with me and I honor you with this
dissertation. Thank you also to Mary Rhodes, my other mother, who’s constant prayers were
necessary and heard.
Jessie Montana Cain, my sister and twinsie, I never knew that I could share so many of
the same experiences with another person. I am grateful to you for helping me think through
ideas, for being my working partner, and for being my escape from academia. How would I have
made it through this journey without our ‘sophistaratchet’ escapades, late night random trips to
Target or Wal-Mart just to cut up and act a fool, or SB-a-thongs? Thank you for allowing me
into your Family. I honor you with this dissertation.
Thank you to Darnell and Danielle Cloud for being there with me before this process ever
began. Darnell, thank you encouraging me years ago to consider the Ph.D. You gave me my first
$"""!
my personal statements, offering advice, and assuring me that I would finish this process. You
are such a wonderful mentor, friend, and brother and I honor you with this dissertation.
A special acknowledgement goes to my Summit church family. J.D. Greear, my lead
pastor, thank you for being such a humble man of God. Thank you for always being a solid
teacher – for teaching me so much about the Gospel, about who Jesus is, about living
missionally, and pushing me to go All-In with my relationship with God. It didn’t fall on deaf
ears or rocky soil! A special thanks to all the members of my small group and the First
Impressions ‘tent ladies.’ Thank you ladies for fervently praying for me through this journey, for
helping me grow spiritually, and for keeping me accountable as I fully and completely decided to
go all-in in my relationship with God. You ladies cried when I cried, celebrated with me, and
encouraged me to remember that this dissertation is just a part of God’s journey for my life. For
all that I have become is owed to the prayers of my church family who righteously sought God
on my behalf.
It was at the Summit Church that I met two special life-long sisters, Yolanda Reed (and
family) and Yolanda Finney. Ladies, you made me know even more that God is real and that
God loves me, because God sent y’all to me when I needed it the most – the last leg of this
dissertation process. Thank you for challenging me to grow spiritually, for being a listening ear,
for calling me in those midnight hours to pray with me. Yolanda R., thank you for your endless
love! You gave me an example of what it looks like to trust God in living out your purpose. You
opened your doors and allowed me to become an aunt to Keijuane and Zion, who allowed me to
be a big kid. But also a sister to Chuck, my voice of reason and spiritual mentor. You showed
me what a Godly marriage looks like in its most authentic form. YoYo Fin, thank you for your
$"#!
and finish this dissertation. Because of you, I understand how to trust God in the unknown and
surrender my plans, ideas, and ways to Him.
To my Sleepover Sisters (S.O.S.) – Billye Sankofa Waters, Corliss Brown Thompson,
Cassandra Davis, Shannon Lewis, Jessie Cain and Danielle Parker. As you all know the doctoral
process can be isolating, stressful (even more so for scholars of color), and just down right
difficult. Thank y’all for accepting me as your sister and pushing, encouraging, laughing, eating,
shopping, conferencing, and working with me through this journey. I COULD NOT have gotten
through this process without each of you, individually and collectively. I honor you all with this
dissertation; it’s really OUR dissertation.
Joseph Atatsi, thank you for doing life with me as I studied for the GRE, for reviewing
my personal statement, for praying with me in times of celebration and frustration, and for
offering your endless love and support throughout this journey. You have taught me how to rely
on God, how to trust myself, and push past obstacles. Before I left Chicago, you gave me a card
and wrote an acrostic poem, which has hung on my bedroom mirror for the past 6 years to
always remind me that The Lord will be my Shield, Helper, Anchor, New Wine, Youth,
Comforter, and Edifier. You were absolutely right! Thank you for being such a wonderful
partner, friend, and brother. I honor you with this dissertation.
Dwayne Deloatch, thank you for walking alongside me through this journey. You were
always there the listen to me and offer your advice through the difficult times. Thank you for
always checking in on me to make sure I remained healthy – physically, mentally, and
spiritually. Thank you for being such a wonderful partner, friend, and brother. I honor you with
$#!
Thank you to all of my study participants, known and unknown. This work could not
have been done without actual individuals. As researchers, especially quantitative researchers,
we often forget that there are people behind the numbers. Teachers, principals, students, and
parents you are not forgotten and are constantly in my prayers. Be encouraged that true education
!"#$
TABLE OF CONTENTS
LIST OF TABLES ... xvii
LIST OF FIGURES ... xix
CHAPTER I: STANDARDS-BASED TEACHER EVALUATION SYSTEMS: RATINGS, PERFORMANCE MEASURES AND THE VARIATION BY RACE, ETHNICITY, AND GENDER ... 1
Introduction ... 2
Education Literature on Evaluation Systems ... 4
North Carolina’s Teacher Evaluation System ... 10
Data and Sample ... 12
Analytic Approach ... 17
Results ... 23
Additional Specifications ... 29
Discussion ... 30
References: Chapter I ... 57
CHAPTER II: THE MAKE UP TEST: AN EXAMINATION OF THE RELATIONSHIP BETWEEN CLASSROOM AND SCHOOL CHARACTERISTICS AND TEACHER PERFORMANCE ... 62
Introduction ... 63
Classroom and School-Level Characteristics of Students ... 65
Classroom and School-Level Characteristics and Instructional Quality ... 69
!"#$
North Carolina’s Teacher Evaluation System ... 73
Data and Sample ... 75
Analytic Approach ... 82
Results ... 86
Additional Specifications ... 89
Discussion ... 91
References: Chapter II ... 131
CHAPTER III: “WE SPREAD THE WEALTH”: UNDERSTANDING TEACHER STAFFING AND ASSIGNMENT OF BEGINNING TEACHERS ... 136
Introduction ... 137
Literature Review ... 140
Conceptual Framework ... 148
Data and Methods ... 149
Findings ... 155
Discussion ... 171
References: Chapter III ... 181
Appendix A: Teacher Interview Protocol ... 186
Appendix B: School Leadership Interview Protocol ... 189
List of Tables
Table 1.1. Descriptive statistics for middle school teachers, 2010-2011 ... 35
Table 1.2. Table 1.2 Relationship between Teacher Value Added Estimates
and Principals’ Evaluation Ratings ... 36
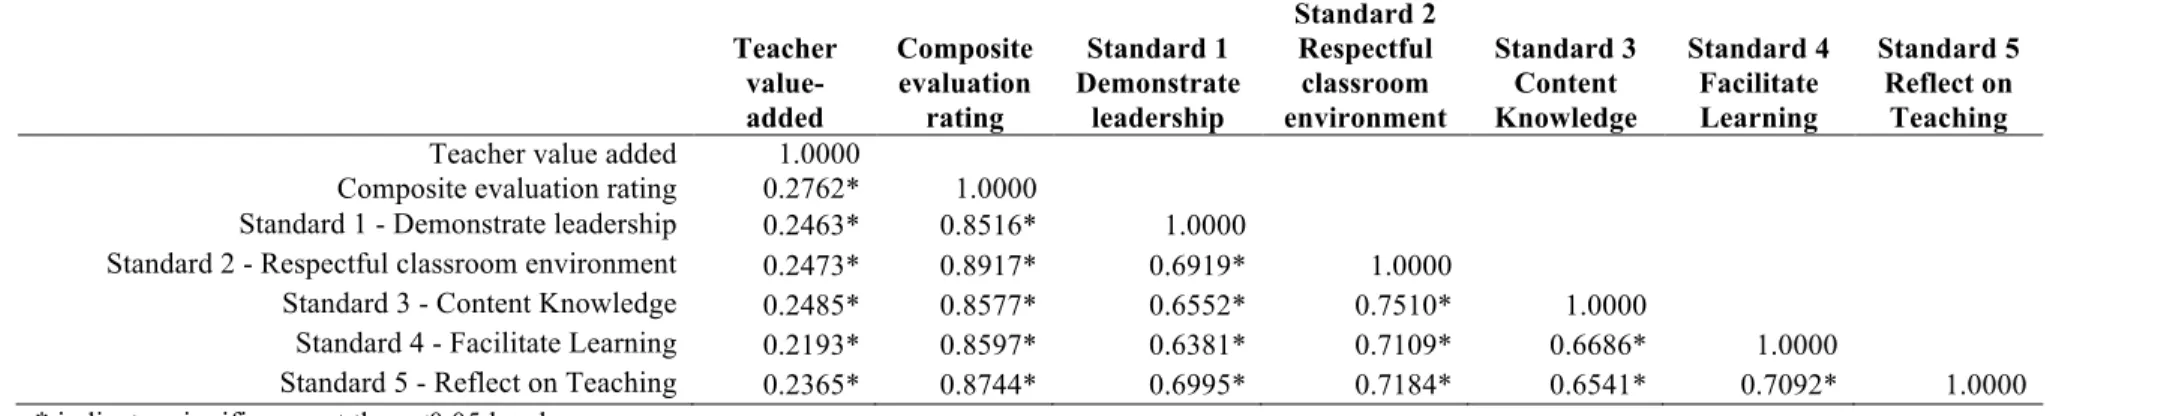
Table 1.3. Pearson’s Correlation of TVA estimates and Evaluation Ratings
in ELA ... 37
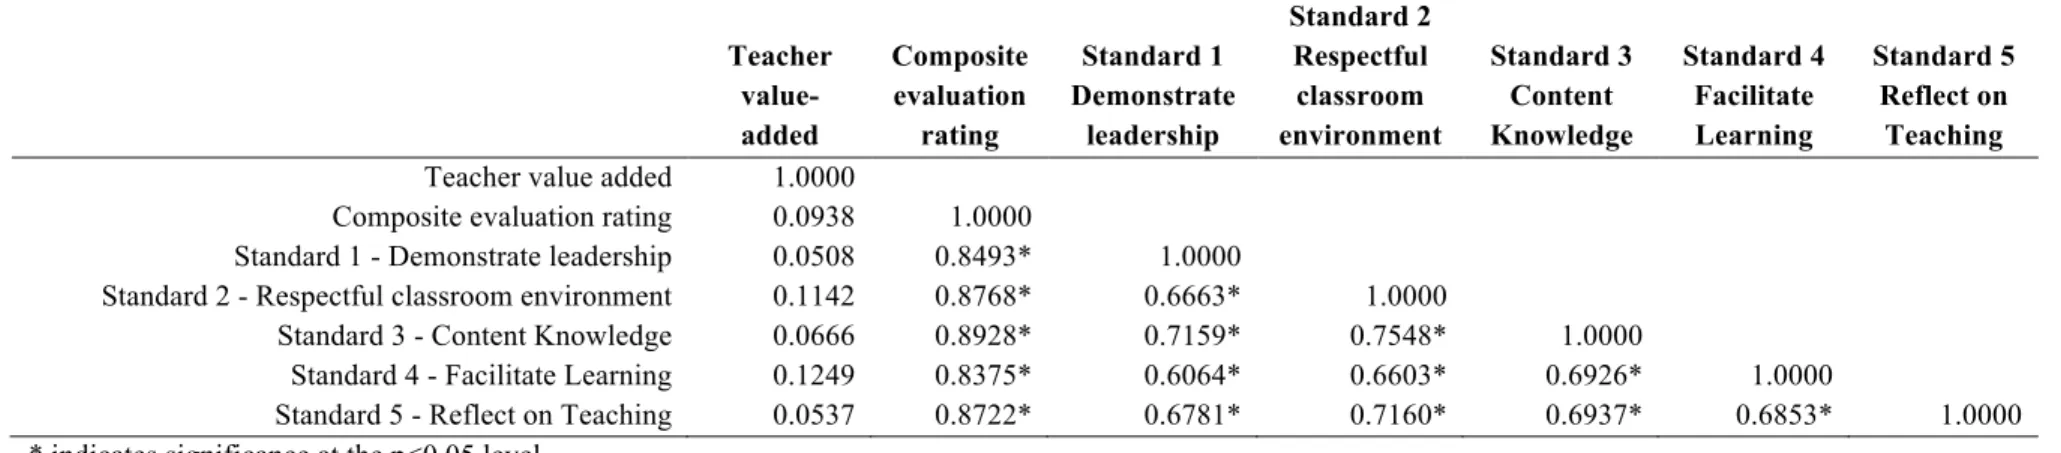
Table 1.4. Pearson’s Correlation of TVA estimates and Evaluation Ratings
in Math ... 37
Table 1.5. Pearson’s Correlation of TVA estimates and Evaluation Ratings
in Algebra I ... 38
Table 1.6. Pearson’s Correlation of TVA estimates and Evaluation Ratings
in Science ... 38
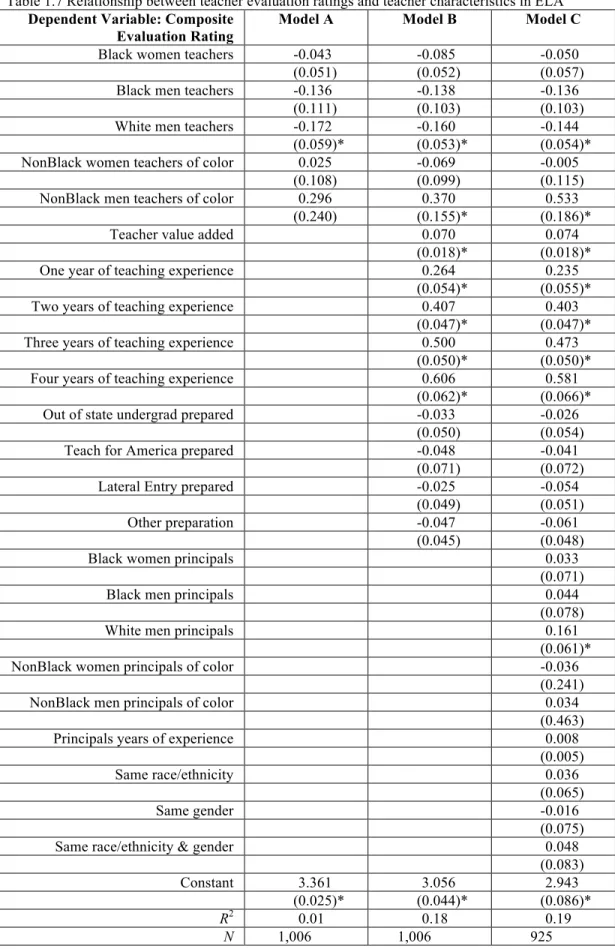
Table 1.7. Relationship between teacher evaluation ratings and teacher
characteristics in ELA ... 39
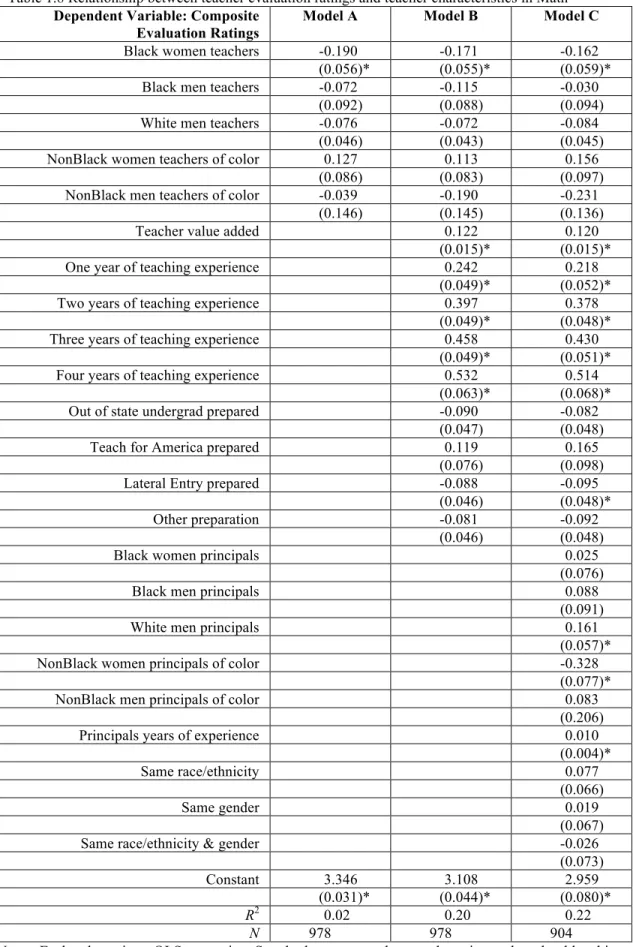
Table 1.8. Relationship between teacher evaluation ratings and teacher
characteristics in Math ... 40
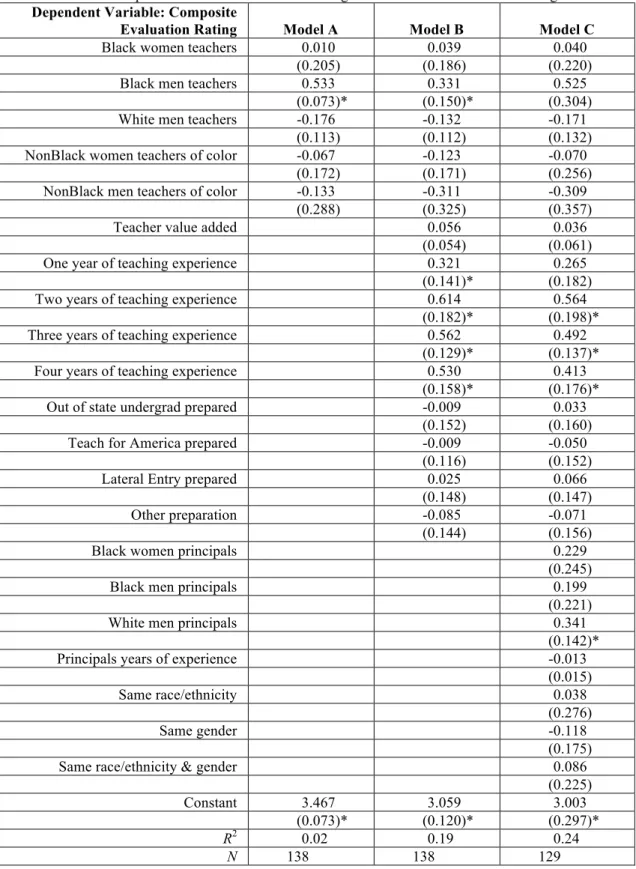
Table 1.9. Relationship between teacher evaluation ratings and teacher
characteristics in Algebra I ... 41
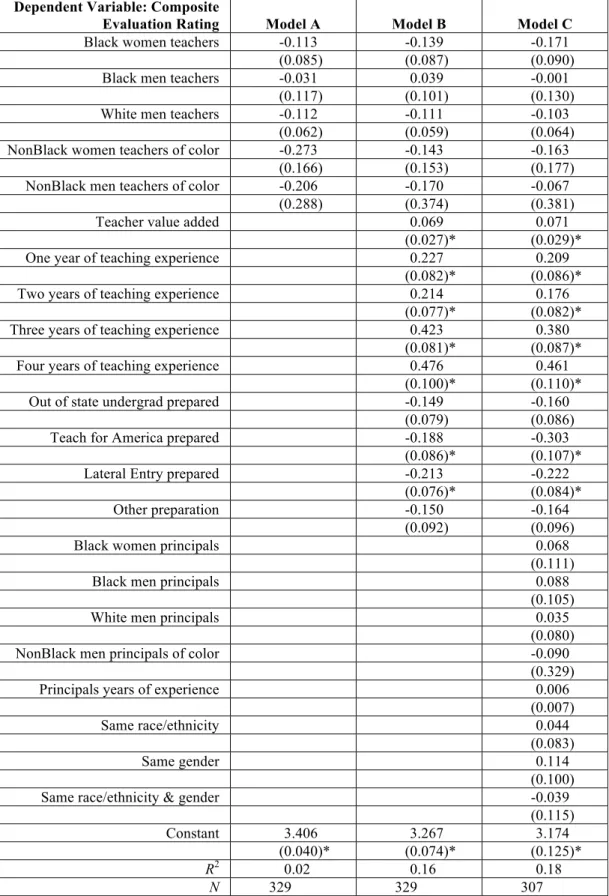
Table 1.10. Relationship between teacher evaluation ratings and teacher
characteristics in Science ... 42
Table 1.11. Relationship between teacher evaluation ratings and teacher
characteristics using school-fixed effects ... 43
Table 1.12. Relationship between teacher evaluation ratings and teacher
characteristics - ELA, by Standard ... 44
Table 1.13. Relationship between teacher evaluation ratings and teacher
characteristics - Math, by Standard ... 46
Table 1.14. Relationship between teacher evaluation ratings and teacher
characteristics – OLS Models ... 48
Table 1.15. Relationship between teacher evaluation ratings and teacher
Table 1.16. Odds ratios for being rated above proficient ... 52
Table 1.17. Relationship between teacher evaluation ratings and teacher characteristics using district-fixed effects ... 54
Table 1.18. Covariates used in the teacher value-added measurement model ... 56
Table 2.1. Summary statistics for middle school teachers, 2010-2011 ... 95
Table 2.2. Relationship between teacher evaluation ratings, classroom and school characteristics in ELA ... 102
Table 2.3. Relationship between teacher evaluation ratings, classroom and school characteristics in Math ... 101
Table 2.4. Relationship between teacher evaluation ratings, classroom and school characteristics in Algebra I ... 105
Table 2.5. Relationship between teacher evaluation ratings, classroom and school characteristics in Science ... 108
Table 2.6. Relationship between teacher evaluation ratings, classroom and school characteristics ... 112
Table 2.7. Relationship between teacher evaluation ratings, classroom, and school characteristics – ELA by Standard ... 115
Table 2.8. Relationship between teacher evaluation ratings, classroom, and school characteristics – Math by Standard ... 119
Table 2.9. Relationship between teacher evaluation ratings, classroom, and school characteristics – Algebra I by Standard ... 123
Table 2.10. Relationship between teacher evaluation ratings, classroom, and school characteristics – Science by Standard ... 127
Table 3.1. Profile of Study Schools ... 178
Table 3.2. Profile of Study Participants ... 178
Table 3.3. Bell Middle School Team Assignment – Math Teacher ... 180
Table 3.4. Burroughs Middle School Team Assignment – ELA Teacher ... 180
List of Figures
Chapter I
STANDARDS-BASED TEACHER EVALUATION SYSTEMS: RATINGS, PERFORMANCE MEASURES AND THE VARIATION BY RACE, ETHNICITY, AND GENDER
In response to federal pressure, states have developed standards-based evaluation systems that
combine principal ratings, value-added scores and in some cases, other measures of teachers’
performance, such as student surveys. School leaders and district administrators use these
evaluation systems for low and high stakes decisions (Murphy, Hallinger, & Heck, 2013). As
educational leaders and policymakers continue to use standards-based evaluations of teachers as
a strategy to reform public education, understanding the validity and fairness of standards-based
evaluation systems provide important information about the integrity of the evaluation system
and its potential to improve teacher performance.
In this manuscript, we examine the extent to which principals’ ratings appear to validly
reflect teachers’ performance as measured by value-added scores and whether principals fairly
evaluate teachers in North Carolina’s public middle schools. The data come from North Carolina
public school (NCPS) administrative data and includes middle school teachers in their first five
years of teaching during the 2010-2011 school year.
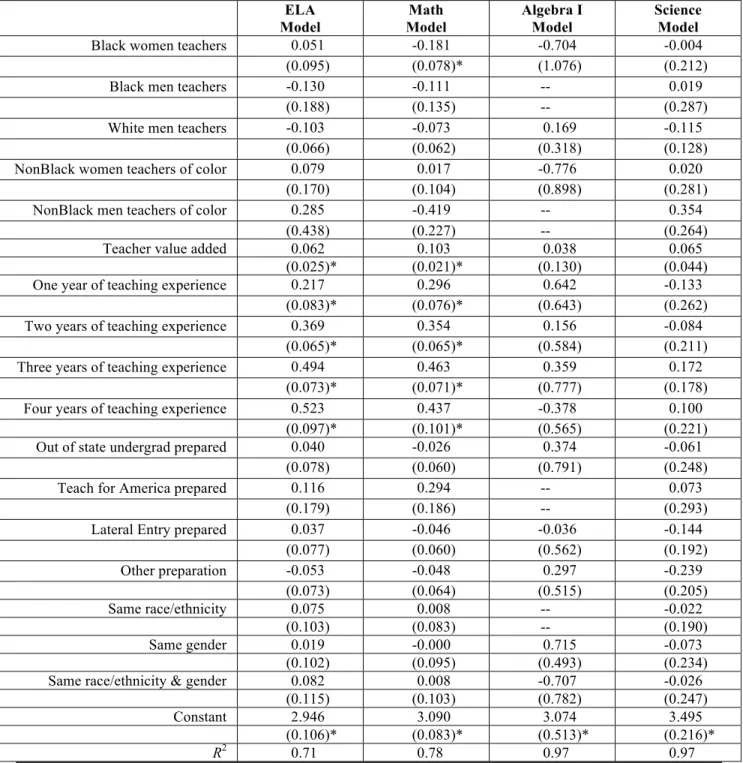
Our results suggest that principals give higher ratings to teachers who make larger
student gains. We also find that after controlling for teachers’ concurrent value-added scores,
%!
female ELA teachers. In addition, principals rate Black female math teachers systematically
lower than White female math teachers, after controlling for concurrent value-added scores.
Introduction
In recent years, federal and state education reforms have placed increased importance on
improving teacher quality. Although teachers exert the largest influence on student learning of all
school-based factors, there is significant variation in the effectiveness of teachers both between
and within school settings (Rockoff, 2004; Hanushek et al., 2005; Henry et al. 2014a; Henry et
al. 2014b). However, until recently the evaluation of teachers’ performance appears to have been
more-or-less perfunctory. In response to federal pressure, primarily from the Race to the Top
funding competition, states have developed standards-based evaluation systems that combine
principal ratings, value-added scores and in some cases, other measures of teachers’
performance, such as student surveys.
According to a September 2013 report by the National Center on Teacher Quality, only
11 states and the District of Columbia require statewide implementation of an evaluation system.
The remaining states either have no statewide specifications (2 states); states provide a model
where districts can opt out (10 states) or districts have the flexibility to design their own system
(27 states) (Doherty & Jacobs, 2013). Additionally, 44 states and the District of Columbia
require classroom observations; however, only twenty-seven require the use of student test
growth data a measure in the evaluation system (Doherty & Jacobs, 2013). States also use the
evaluation system for varying purposes including professional development, dismissal, tenure,
and compensation.
Traditional teacher evaluations, which were usually based on informal classroom
&!
for several reasons including principals’ tendency to inflate ratings, conflicting motivations and
objectives for the evaluations, and desire to maintain positive relationships with teachers (Bol,
2011; Levy & Williams, 2004). However, current education reforms sought to counter the
perceived arbitrariness of the principal evaluations of teachers by instituting standards-based
evaluation systems.
Standards-based teacher evaluation systems have incorporated two new ideas: (1) the use
of rubric-based standards on which principals evaluate teachers according to their performance in
key areas related to student learning and (2) the inclusion of value-added measures in the
evaluation of teachers. However, little is known about the extent to which principal ratings using
standards-based evaluation systems are closely related to objective measures of teachers’
performance or if the ratings might compromise the validity and fairness of teachers’
evaluations. For these evaluation systems to have the desired impact of improving and reducing
the variability of the performance of teachers, the evaluations must reflect teachers’ performance
and be fair – showing no consistent or uniform, i.e. systematic bias, differences toward any
racial, ethnic or gendered groups.
In this manuscript, we examine the extent to which principals’ ratings appear to validly
reflect teachers’ performance, as measured by value-added scores, and whether principals fairly
evaluate teachers in North Carolina’s public middle schools. We define fairness as the lack of
systematic associations between teachers’ race, ethnicity or gender and the principals’ ratings of
teacher performance after controlling for an objective measure of teachers’ performance. As
educational leaders and policymakers continue to use standards-based evaluations of teachers as
'!
evaluation systems provide important information about the integrity of the evaluation system
and its potential to affect teacher performance positively.
More generally, our findings inform the teacher quality literature by providing
preliminary evidence that standards-based evaluation systems, at least as currently implemented
in North Carolina, may not remove subjective influences on principals’ ratings of teachers. This
manuscript also contributes to the empirical literature on teacher evaluation systems by
incorporating objective measures of teachers’ effectiveness in the examination of systematic
differences in principals’ evaluation ratings. Additionally, the methods used include within
school-fixed effects to account for observable and unobservable time-invariant characteristics of
schools and school leaders, thus strengthening the validity of the systematic patterns presented in
the findings.
In the next section, we review the literature on teacher evaluations, followed by an
overview of North Carolina’s teacher evaluation system. We then describe the methodology
including the data and analytic plan. Finally, the results and discussion are presented.
Education Literature on Evaluation Systems
Similar to many industries, evaluations in the field of education serve two main
functions: improving performance of teachers and personnel decision-making by school leaders
(Arvey & Murphy, 1998; Castilla, 2008; Scriven, 1967). As a performance tool, evaluations may
provide valuable sources of information for educational administrators and teachers to improve
instructional quality. The use of the evaluation as a performance tool is especially important for
beginning teachers who often require additional guidance regarding instructional practices,
classroom management, and other aspects of teaching than experienced teachers (Peterson,
2004). Recent research using rigorous designs strongly suggests that using standards-based
(!
teachers who participated in the evaluation process, even veteran teachers (Taylor & Tyler,
2012). However, for higher stakes purposes such as performance incentives, the research to-date
finds no link between incentives and teachers’ behaviors and performance (Springer et al., 2012;
Yuan et al., 2012).
Educational administrators also use evaluations in their decision-making efforts to
continue employment, confer tenure, or determine performance pay awards.
To examine the role of evaluation systems within the field of education, we synthesize
three areas of literature: principals’ evaluations of teachers; standards-based evaluation systems;
and the relationship between evaluations and teacher characteristics.
Principal Evaluations and Teacher Effectiveness
The evaluation of teachers is a long held practice and arguably one of the most important
responsibilities of principals (Marzano, Frontier, & Livingston, 2011). However, the validity and
reliability of principal evaluations of teachers remains a source of controversy. Principal
evaluations of teachers are those in which principals enter the classroom to informally observe
teachers and often without specific observation criteria. Many researchers and practitioners call
into question principals’ knowledge and skills necessary to appropriately evaluate teachers.
Common concerns center on principals’ lack of instructional leadership such as their limited
content knowledge and understanding of the classroom environment to evaluate teachers’
performance (Soar, Medley, & Coker, 1983; Stodolsky, 1984; Epstein, 1985; Darling-Hammond,
Wise, & Pease, 1983).
To date, the majority of studies on principal evaluations focus on the relationship
between teacher evaluation ratings and student achievement. Early studies examining the effect
of principal evaluation ratings of teachers and teachers’ effectiveness, measured by student
)!
Coker, 1987 for a list of eleven studies). According to Medley and Coker (1987), these studies
suffered from threats to internal validity. However, after accounting for these threats, Medley
and Coker found consistent results and concluded, “research provides no support whatever for
the widely held belief that the average principal is a good judge of teacher performance” (p.245).
In these prior studies, student achievement gains were calculated using norm-referenced
tests, which are designed to produce a relative ranking of students compared to their peers. This
test does not attempt to measure gains in student learning in terms of the objectives that have
been set for them or a teacher’s ability to provide quality instruction. A criterion-referenced test
(CRT) measures how well students learned the content expected in the standards. This test
provides a more accurate measure of student learning, because it directly relates to teachers’
instructional practices, which principals evaluate during classroom observations. Using CRTs,
Manatt and Daniels (1990) replicated Medley and Coker’s (1987) study and found that principals
are able to accurately evaluate teacher effectiveness. The authors suggest that use of CRTs,
extensive and effective principal training on the evaluation instrument, and more advanced
methods explained the contrasting results from prior studies.
Researchers have also measured principal evaluation ratings using other instruments
other than classroom observations. Examining 360° feedback surveys from students, teachers,
and principals, Wilkerson and colleagues (2000) found that principals’ ratings of teachers were
positively correlated with student achievement in math and ELA; however, there was no
statistical correlation in reading. A more recent study, using a principal evaluation survey of
teachers, found that principals were able to distinguish between high- and low-performing
*!
Taken together, there is some evidence that principals are able to identify effective
teachers, especially at the extremes of performance. The research evidence also suggests that
principal training is a source of variation in the relationship between evaluation ratings and
student achievement. Moreover, this may indicate the need for a systematic evaluation process,
which is the basis of standards-based evaluation systems.
Standards-Based Evaluations and Teacher Effectiveness
During in the 1990s, accountability pressures began to shift school leaders’ interest from
principal evaluations of teachers to standards-based evaluations of teachers. Standards-based
evaluations of teachers are based on a comprehensive framework or rubric that defines the
expectations for teachers’ performance and are conducted by school leaders, usually principals or
assistant principals and in some cases independent observers. As a system, the evaluation
requires a thorough collection of evidence that includes observations and artifacts (i.e. lesson
plans, student work, etc.). Much of the research on standards-based teacher evaluation employed
Danielson’s Framework for Teaching. The Framework for Teaching is a set of standards that
measure instructional practices related to improving student learning (Milanowski, 2004).
Similar to research on principal evaluations of teachers, the underlying working hypothesis for
research on standards-based evaluation systems is that the ratings for teachers should have a
positive and significant relationship with teachers’ ability to raise students’ test scores. These
studies, implemented in several districts across the U.S., were conducted primarily by a group of
researchers from the Consortium for Policy Research in Education (CPRE) (Milanowski,
Kimball, & White, 2004; White, 2004; Milanowski, 2004; Kimball, White, Milanowski, &
Borman, 2004). The findings from CPREs collection of studies provide mixed evidence for the
+!
In two studies of the Cincinnati Public School district, teachers’ evaluation ratings were
positively correlated with their students’ achievement gains (Holtzapple, 2003; Milanowski,
2004). The magnitude of the correlations between composite evaluation ratings and student
achievement gains ranged from 0.26 in science to 0.43 in math. While Milanowski’s study
examined evaluation ratings using the entire four-domain Framework for Teaching rubric,
Holtzapple (2003) examined a single domain arguably most related to student achievement –
Teaching for Learning. Holtzapple (2003) also found that students taught by the lowest rated
teachers (i.e. unsatisfactory or basic rating) performed lower across two years on reading,
science, and social studies test than predicted. Only students taught by teachers who received
distinguished ratings made positive gains across all subjects and years. However, a study on
Washoe County School’s evaluation system in Nevada found no statistically significant results
between evaluation ratings and students’ math achievement or across some grade levels
(Kimball, White, Milanowski, & Borman, 2004).
Studies on standards-based evaluation suggest a large variation in the relationship
between evaluation ratings and student achievement gains across grade levels and subjects. This
variation may be explained by the interaction between evaluators’ motivation, skill, and context
(Kimball & Milanowski, 2009) or systemic issues such as misalignment between
standards-based evaluation rubrics and state standards by subject (Gallagher, 2004).
It is not clear, however, whether these findings are generalized to various geographic
locations, secondary grades, or using rigorous specifications. For instance, CPRE’s studies
examined single districts or schools within two regions of the U.S. – the Midwest and West and
focused primarily on elementary school grades. The reliance on single districts and elementary
,!
regionally, and statewide. The studies also used different types of tests to examine student gains.
For example, Kimball et al. (2004) used the Terra Nova, a norm referenced test, as a pretest for
fifth grade students and the state criterion-referenced test as the posttest. Finally, the studies
employed two-level hierarchical linear models to account for the nesting of students within
classrooms, but did not account for the nesting of classrooms within schools.
Evaluations and Teacher Characteristics
Much of the research on evaluations, both principal and standards-based, have focused on
two primary points of inquiry: the effect of teacher evaluation ratings on student achievement
and the identification of effective teachers. This research has important implications for the
broader domain of teacher quality; however, the impact of these evaluations on teachers is
missing from the conversation. While it is important that teachers improve student outcomes, it
is equally important that teachers be evaluated fairly, conditional on their performance. For
these evaluation systems to be considered fair, the ratings for teachers should be systematically
related to teachers’ performance, not ascriptive characteristics such as gender, ethnicity and race.
To our knowledge, there is only one study that directly examines the relationship between
evaluation ratings and teacher characteristics. Jacob and Walsh examined the relationship
between evaluation ratings and teacher characteristics associated with performance such as
educational credentials, experience and absences as well as race/ethnicity-gender characteristics
(Jacob & Walsh, 2011). They found that compared to first year teachers, those with 10 years of
experience were rated 0.55 standard deviations higher on evaluations. Teachers from selective
colleges and those who majored in education also received higher ratings than their peers. In
terms of ascriptive characteristics, White female teachers received higher ratings than all other
-.!
While Jacob and Walsh’s study appears to be the only examination of teacher
characteristics, other studies have examined the relationships between ethnic and gender
congruence (e.g., principals and teachers of the same racial or ethnic group) on working
conditions and evaluation ratings. The findings suggest that principals provide racially congruent
teachers with more intangible benefits (Grissom and Keiser, 2011). In addition, gender
congruence is also shown to influence working conditions and teacher retention. Specifically,
male teachers supervised by a female principal were less satisfied with their jobs and more likely
to leave their current school than female teachers (Grissom, Nicholson-Crotty, & Keiser, 2012).
While these studies were not directly related to how teachers are evaluated, they offer
empirical support for the hypothesis that congruence or incongruence in terms of racial/ethnic
and gender identification of the principal and teacher may affect evaluations of teachers.
North Carolina’s Teacher Evaluation System
In this manuscript, we focus on the standards-based evaluation system being
implemented statewide in North Carolina. This teacher evaluation system grew out of education
reform efforts of the late 1970s to improve the quality of education (Stacey, Holdzkom, &
Kuligowski, 1989; Ellett & Garland, 1987). In 1978, the General Assembly of North Carolina
developed a statewide evidence-based evaluation system, known as the Teacher Performance
Assessment Instrument (TPAI). All teachers were required to participate in the evaluation
process; however, requirements varied based on teachers’ license status (i.e. career teachers vs.
probationary). The evaluation system was later revised (name changed to TPAI-R) in response to
the implementation of the School-Based Management and Accountability Program of 1995 and
the Excellent Schools Act of 1997.
Recognizing current challenges to ensure all students have the knowledge and skills to
--!
with the Mid-continent Research for Education and Learning, developed a standards-based
evaluation system – North Carolina Educator Evaluation System (NCEES) to replace the
TPAI-R. The NCEES simultaneously serves dual purposes: professional development and personnel
decision-making (e.g., promotion) of teachers. The NCEES was implemented in three phases.
The first phase occurred during the 2008-2009 school year and included 13 voluntary districts
across North Carolina. During the 2009-2010 school year, an additional 39 districts voluntarily
participated in phase two of the evaluation process. By the 2010-2011 school year, the final
online evaluation system was launched and included the remaining 63 districts.
During the NCEES process teachers receive four classroom observations throughout the
school year, three by a school leader and one by a peer evaluator. In order to serve as a peer
evaluator, teachers must complete the training on the North Carolina Teacher Evaluation
Process. Until teachers are granted career status (commonly referred to as “tenure”), they are
required to participate in the evaluation process. Career status teachers fully participate in
NCEES (i.e. receive a summative evaluation) during their license renewal year.
The NCEES rating system is based on the North Carolina Professional Teaching
Standards created by the North Carolina Professional Teaching Standards Commission. The
rubric includes five standards and twenty-five elements that describe the knowledge, skills and
dispositions of an effective teacher. The five standards are: (Standard 1) Demonstrate leadership;
(Standard 2) Establish a respectful environment for a diverse population of students; (Standard 3)
Know the content they teach; (Standard 4) Facilitate learning for their students; and (Standard 5)
Reflect on their practice (SBE, n.d.). Within each standard, teachers are evaluated on a set of
elements, which are subdivided into descriptors. Each descriptor contains language that describes
-%!
Proficient, Developing, and Not Demonstrated. Evaluators assign ratings for individual
descriptors within an element. The overall rating for each element is based on the lowest rating
received across all descriptors. As an example, Figure 1 contains an element and descriptors for
Standard 1.
As illustrated in Figure 1, this fictional teacher would receive a rating of “Developing” on
the “Teachers lead in the classroom” element, despite receiving higher ratings on other
descriptors within this element, because “Developing” is the lowest rating in which all
descriptors are observed/marked.
The evaluation process includes seven components: training, orientation, teacher
self-assessment, pre-observation conference, classroom observations, post-observation conference,
and a summary evaluation conference. At the end of the school year, the principal conducts
summary evaluations to determine teachers’ formal summative rating on each standard. The
rating is not a simple average of observation scores. Principals use multiple evidences including
classroom observations and artifacts (lesson plans, student work, service on committees, etc.) to
determine the final ratings for each standard.
Data and Sample
The data for this manuscript come from North Carolina Department of Public Instruction
(NCDPI) administrative data on students, teachers, classrooms, and school characteristics using
personnel, school report card and classroom roster files. We supplement this data with evaluation
rating data from NCDPI and use unique individual teacher identifiers to merge the two datasets.
Complete evaluation ratings are available for 45,900 NCPS teachers across all grade levels and
subjects for the 2010-2011 school year. However, our sample only includes beginning ELA,
2010--&!
2011 school year. Our final sample consists of 2,451 unique middle school teachers across the
four subjects identified.
We focus on beginning teachers for two primary reasons. First, there is a preponderance
of evidence that effectiveness increases for teachers in their five years of teaching (Boyd,
Grossman, Lankford, Loeb, & Wyckoff, 2006; Clotfelter, Ladd, & Vigdor, 2007, 2010; Harris &
Sass, 2011; Henry, Bastian, & Fortner, 2011; Henry, Fortner, & Bastian, 2012). Therefore, it is
suspected that more variation in evaluation ratings will exist among beginning teachers. Second,
unlike career status teachers, all beginning teachers are required to undergo the full NCEES
process; as such makeup a larger portion of those evaluated.
The analysis is limited to middle school teachers for conceptual and statistical reasons.
Middle school is often an under-researched, yet crucial point in the academic future of students.
Teachers in this grade level must ensure students are prepared for rigorous high school material.
Failing to do this increases the risk that students will drop out of school (Bridgeland, Dilulio, &
Morison, 2006; Rumberger, 2001). Examining the integrity of the evaluation system for middle
schools teachers is critical in ensuring that principals’ assessment of teachers’ performance is
substantiated.
Examining middle schools also allows for a more nuanced examination of evaluation
ratings across multiple subject areas that are not possible in self-contained elementary
classrooms. 1 The isolation by subject matter helps inform larger policy issues and practices. For
example, if there are differences across subjects on Content Knowledge – Standard 3, teacher
education programs may want to examine the quality of instruction within the specialized
!!!!!!!!!!!!!!!!!!!!!!!!!!!!!!!!!!!!!!!!!!!!!!!!!!!!!!!!!!!!!
-'!
content areas. Finally, beginning teachers in middle grades teach multiple classes and are
accountable for the test performance of more students per year than elementary grade teachers.
The increased number of classes and students taught provides more statistical power in the
measurement models discussed later.
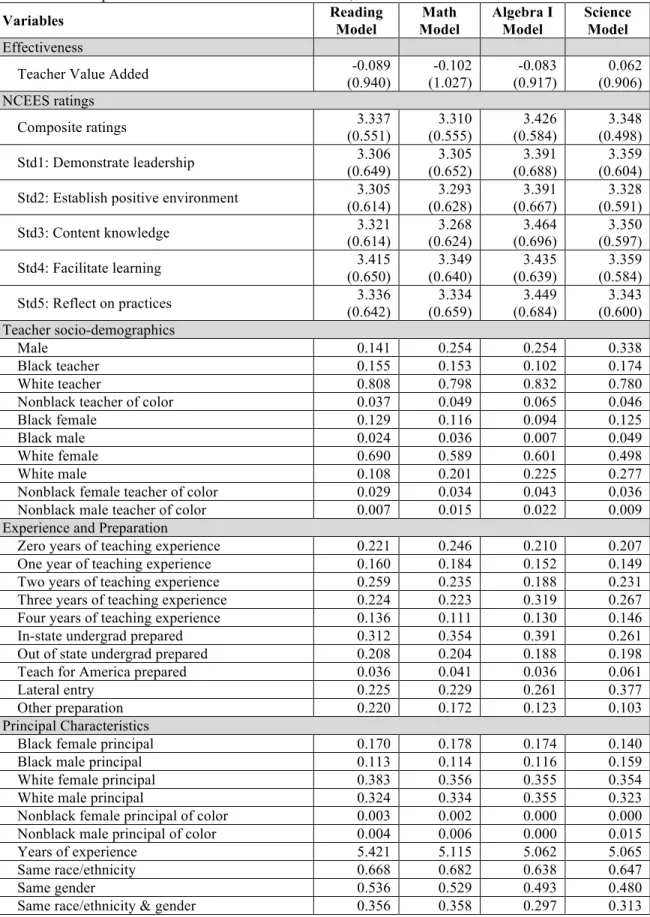
Dependent Variables and Covariates
As previously discussed, during the end of the school year principals provide teachers
with a summary evaluation rating on each of the five standards. The final ratings are converted
into a 5-point scale, where a rating of 1 indicates “Not Demonstrated” and a rating of 5 indicates
“Distinguished”. For this manuscript, we create a unit-weighted composite rating from the five
summative ratings and use this as a dependent variable along with each of the five individual
ratings.
Covariates
The focal variable of interest for the analysis of validity is the teacher effectiveness
measure estimated by teachers’ value-added scores. For the analysis of fairness, the focal
variables of interest are teachers’ race, ethnicity and gender. To isolate the effect of these
socio-demographic characteristics on evaluation ratings, we also include teachers’ effectiveness,
experience, preparation, and principal characteristics covariates.
Teacher Effectiveness. In this study, teacher effectiveness is measured by individual
teacher scores using value-added models (TVA). TVA is a statistical technique that estimates the
contribution of a teacher in a given subject, grade, and year by isolating the effects of the teacher
from other factors, such as family, student, and school characteristics. The defining characteristic
of TVA models is that students’ prior year test scores are included in the model along with the
current scores to determine the “value” or amount of learning attributed to a particular in a given
-(!
Debate surrounding the use of value-added models is a major topic of discussion as
policymakers and educational leaders seek to make high-stakes decisions using these estimates.
On one hand, scholars argue that value-added measures are unreliable over time, limited to tested
subjects and specific grades, do not account for teacher or student sorting, and do not effectively
indicate teacher quality or effectiveness (Harris, 2009; Hill, 2009). On the other hand, scholars
argue that value-added estimates explain variation in student test score gains, predict future
teacher performance, and provide meaningful information at a low cost (Nye, Konstantopoulous,
& Hedges, 2004; Gordon, Kane, & Staiger, 2006; Harris, 2009). Despite this debate, most agree
that value-added models provide the best available objective measure of teacher effectiveness at
this time.
Socio-demographics. Race, ethnicity and gender are used as key teacher characteristics of
interest in this manuscript. We use three racial and ethnic categories of teachers: Black, White,
and nonBlack teachers of color. NonBlack teachers of color are combined due to sample size
limitations and include Hispanic Americans, Asian Americans, Native Americans,
Multiracial/multiethnic Americans, and unspecified racial and ethnic groups. Traditional
approaches in addressing racial stratification include race/ethnicity and gender as individual
variables in analytic models. However, this approach ignores the intersectionality of race or
ethnicity and gender (Crenshaw, 1989, 1991; Giddings, 1984). In a study on the intersectionality
of race, ethnicity and gender in the labor market, Browne and Misra (2003) state, “race is
‘gendered’ and gender is ‘racialized,’ so that race and gender fuse to create unique experiences
and opportunities for all groups” (p. 488). To provide a more meaningful examination of teacher
evaluation systems and the policy implications, we incorporate this theoretical framework and
-)!
females, White males, nonBlack females of color, and nonBlack males of color. All groups were
dummy coded 1 or 0. White females, the modal group, are the reference category for all
analyses. We provide results with the three race/ethnicity groups; however, the six
race/ethnicity-gender groups is our preferred specification.
Experience and Preparation. Teachers’ experience is based on the total years of actual
teaching and does not include credit from related work experience gained from non-education
industries. In recent years, the type of preparation teachers enter the classroom with has become
increasingly diverse (Henry et al., 2014a). As a result, beginning teachers may exhibit
differences in their content knowledge, skills, dispositions and other important aspects of
teaching. These differences may have important implications for teachers’ evaluation ratings. For
example, in-state public undergraduate prepared teachers might receive high ratings due to their
pre-service course work and student teaching directly related to the North Carolina Professional
Teaching Standards than out-of-state undergraduate prepared teachers.
Five preparation portals, which prior research has shown to have different effects on
student achievement gains (Henry et al. 2014a; 2014b), are included as controls for this analysis:
in-state public undergraduate prepared (reference group), Teach for America (TFA), out-of-state
undergraduate prepared, lateral entry, and all other portals. All other portals include in-state and
out of state graduate prepared, in-state private undergraduate and graduate programs, visiting
international faculty, licensure only, and unclassifiable. These preparation portals are grouped
together because they individually represent a small proportion of beginning teachers and the
differences in their value-added estimates of effectiveness were relatively small. While teachers
who entered the classroom via TFA preparation also represents a small proportion of the
-*!
teachers are more effective in secondary grades and STEM subjects (Henry et al., 2014a; Xu,
Hannaway, & Taylor, 2011).
Principal Characteristics
Socio-demographics. Similar to the teacher socio-demographic controls, we include six
race/ethnicity-by-gender groupings of principals: Black females, Black males, White females,
White males, nonBlack females of color, and nonBlack males of color. All groups were dummy
coded 1 or 0. White females, the modal group, are the reference category. To examine the
influence of race/ethnicity and gender congruence on evaluation ratings, we create three
dichotomous congruence variables: racial congruence, gender congruence, and race/ethnicity –
gender congruence.
Experience. A continuous variable of years of experience as a principal is included as a
control.
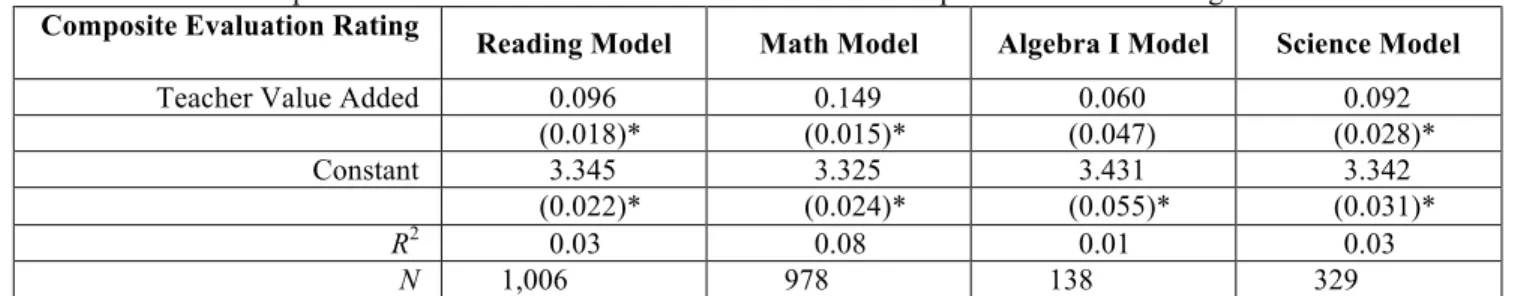
Analytic Approach
The goal of this study is twofold: to examine the validity and fairness of NCEES.
Because the goals are distinct, we employed two separate analytic approaches. To examine the
validity, we examine the relationship between teacher evaluation ratings on the NCEES with a
more objective measure of teacher effectiveness – TVA. We do not expect these measures to
perfectly correlate with another because they do in fact measure different aspects of teacher or
instructional quality. For instance, the evaluation ratings measure knowledge, skills and
dispositions that are not well represented in TVA estimates such as teachers assuming leadership
roles in the school, profession and community; establishing a respectful classroom environment;
and reflecting on teaching practices. However, we do expect a positive relationship between the
two measures since both should assess instructional quality. More concretely, we would expect
-+!
standards most directly related to student learning such as knowing the content and facilitating
student learning.
To examine this relationship, a two-step approach that includes a measurement and an
analysis model is employed. In the measurement model, we derive individual teacher
value-added estimates for a given subject using a three-level hierarchical linear model (Henry, Bastian,
& Fortner, 2011 and Henry, Fortner, & Bastian, 2012). The hierarchical linear model accounts
for the nesting of students within teachers’ classrooms that are nested within schools. The TVA
estimates, include a robust set of covariates such as students’ prior test scores and other student,
classroom, and school characteristics to adjust for factors, which are arguably outside of
teachers’ control, but affect student achievement gains (see Table 1.18 for a list of the
covariates).
Teacher characteristics are omitted from the value-added estimates because of the
possible correlation with student performance and evaluation ratings. For each teacher, we
generate TVA estimates across classrooms and subjects. The reduced form equation for the
estimation of the TVA is:
!!"#!! !!!!!!!!!"#!!!!!! !!!!"#! !!"!!"!!!!"!!!!!!"#!!!!"! !!!!!!!!!!!
where
!!"#!is the current test performance for student i taught by teacher j in school k;
!!"#!!!!!!is the prior test performance for student i, taught by teacher j in school k; !!"#!is a vector of individual characteristics for student i taught by teacher j in school k;
!!" is a vector of the teacher (classroom)-level characteristics for teacher j in school k;
!! is a vector of school level characteristics common to all students and teachers in
-,!
!!"# is the individual error term of student i taught by teacher j in school k;
!!!" is the error between teachers within schools for teacher j in school k and yields
shrunken empirical Bayes residuals that are used as the measure of teacher effectiveness
for the analysis models; and
!! is the error between schools.
The analysis model utilizes ordinary least squares (OLS) regression and includes
individual teacher value-added estimates from the measurement model. The equation is as
follows:
ERjk = !0+!1!!!"!!jk !!!! !
where
!"!"! is the composite or individual evaluation ratings of teacher j in school k and
!!!"!is the measure of teacher j’s effectiveness in school k.
The second goal of this manuscript is to explore whether NCEES is a fair instrument to
evaluate teachers’ performance. That is, are there systematic differences in teacher evaluations
based on teachers’ race, ethnicity or gender? We employ an OLS regression model to estimate
the relationship between our focal variables and evaluation ratings (see Equation 3). We also
used cluster-adjusted standard errors at the school-level to account for the clustering of teachers
within schools. The equation used to estimate the effects of race/ethnicity and gender on
evaluation ratings is as follows:
!"!"!! !! !!!!!"#$!!"!!!"!#$!"!!!!!"#$"%!"!!!"!!!!!!!!!!!
where
!"!"! is the composite or individual evaluation ratings of teacher j in school k !!"!!is
%.!
As noted by Oppler and colleagues (1992), differences in evaluation ratings based on
race, ethnicity, or gender do not necessarily imply evaluator bias; rather there may be differences
in the actual performance of the members of those groups who are evaluated. In other words,
performance may mediate the relationship between race/ethnicity and gender variables and
evaluation ratings. After controlling for teachers’ objective effectiveness, if race/ethnicity and
gender coefficients are statistically significant this provides evidence consistent with systematic
bias in the evaluation ratings. However, caution must be taken in interpreting the results because
the effects are not causal, rather they describe a relationship between evaluation ratings and
teacher characteristics after controlling for the best available objective measure of teacher
performance.
To examine whether the naïve association, presented in Equation 3, weakens after
adjusting for teachers’ effectiveness we include the TVA estimates from Equation 1 along with
other teacher covariates. As previously discussed, there may be initial differences in ratings
across race/ethnicity and gender characteristics; however, this is possibly due to differences in
teacher performance that may be correlated with membership in the racial/ethnic or gender
categories. Put crudely, compared to White female teachers, Black female teachers may receive
lower ratings as a group because they perform worse, not because of their race/ethnicity or
gender. The equation used to estimate the effects these adjustments on evaluation ratings is as
follows:
!"!"!! !! !!!!!"#$!!"!!"#"$%!"!!!!!"#$"%!"!!!!!!"!!!!"#$%!!"!!"#$%&$'($!"
!!!!"#$%&!"!!!"!!!!!!!!!
After controlling for teacher performance by including the TVA and correlates of
%-!
remain. Including correlates such as years of experience is especially important if some of the
race/ethnicity and gender groups have less experience and experience is associated with
performance in ways that are not captured by the teacher’s TVA score. We also include teachers’
preparation portals to capture the quality of teachers’ preparation. This is important if some of
the race/ethnicity and gender groups are disproportionately prepared by one type of program and
preparation programs are associated with teachers’ performance.
To further examine these differences, we explore whether race/ethnicity and gender
characteristics and experience of principals influence how they rate teachers. We include
principals’ race/gender groups, racial congruence, gender congruence, race/ethnicity – gender
congruence and experience covariates in the analysis. This model is our preferred model. The
equation is as follows:
!"!"!! !!!!!!!"#$!!"!!"#"$%!"!!!!!"#$"%!"!!!!!!"!!!!"#$%!!"!!"#$%&$'($!"
!!!!"#$%&!"!!!!"#$%#&'(!"!!!"!!!!!!!!!
where
!"#$%#&'(!"!is a vector of principal characteristics, which includes race/ethnicity,
gender, years of experience, and race and gender congruence2 with the teacher of
principal p in school k.
The covariate adjusted estimates specified to this point attempt to isolate the effect of
teacher characteristics on evaluation ratings. Although this study does not make causal claims,
there is still a potential threat to internal validity due to the nonrandom assignment of teachers
!!!!!!!!!!!!!!!!!!!!!!!!!!!!!!!!!!!!!!!!!!!!!!!!!!!!!!!!!!!!!
2 The variance inflation factor (VIF) was used in each of the models to check for possible