Both Light Intensity and Moderate-to-Vigorous Physical Activity
Measured by Accelerometry Are Favorably Associated With
Cardiometabolic Risk Factors in Older Women: The Objective Physical
Activity and Cardiovascular Health (OPACH) Study
Michael J. LaMonte, PhD, MPH; Cora E. Lewis, MD, MSPH; David M. Buchner, MD, MPH; Kelly R. Evenson, PhD, MS; Eileen Rillamas-Sun, PhD; Chongzhi Di, PhD; I-Min Lee, MD, ScD; John Bellettiere, PhD, MPH; Marcia L. Stefanick, PhD; Charles B. Eaton, MD, MS; Barbara V. Howard, PhD; Chloe Bird, PhD; Andrea Z. LaCroix, PhD, MPH
Background-—The relationship between light intensity physical activity (PA), which is common in older adults, and cardiovascular disease (CVD) risk factors is unclear. This study examined associations of accelerometer-measured PA intensity with CVD risk factors in older women of different race-ethnicities.
Methods and Results-—Cross-sectional analyses were conducted in 4832 women (mean age 78.9 years; 52.5% white, 30.5% black, 17.1% Hispanic) who were without known CVD and wore triaxial accelerometers a minimum of 4 of 7 days with≥10 hours/ d awake wear-time. Vector magnitude counts per 15-s epoch were used to define time spent in low light (19–225 counts/15 s), high light (226–518), and moderate-to-vigorous;≥519) intensity PA. Fasting CVD biomarkers, resting blood pressure, waist girth, body mass index, and 10-year predicted CVD risk (Reynolds Risk Score) were measured. After adjusting for age, wear time, race-ethnicity, and potential confounders, each PA measure was favorably associated with mean high-density lipoprotein, triglyceride, glucose, C-reactive protein, body mass index, waist girth, and Reynolds Risk Score (P<0.05, all). Associations with mean blood pressure, insulin, and total and low-density lipoprotein cholesterol were variable. A 30-minute/d increment in PA was associated, on average, with odds ratios for high predicted CVD risk (Reynolds Risk Score≥20) of 0.96 (95% confidence interval, 0.92, 1.00), 0.88 (0.83, 0.94), and 0.85 (0.79, 0.91) for low light, high light, and moderate-to-vigorous, respectively, and remained significant with further mutual control for PA intensity.
Conclusions-—PA measured by accelerometry, including light intensity PA, was associated with lower CVD risk factor levels in race-ethnically diverse older women. (J Am Heart Assoc. 2017;6:e007064. DOI: 10.1161/JAHA.117.007064.)
Key Words: aging•coronary heart disease•exercise•risk factor•women and minorities
M
ajor modifiable cardiovascular disease (CVD) risk factors account for a substantial proportion of CVD incidence,1 and impose greater population burden with increasing age, particularly in women.2At age 65, the lifetime absolute risk of experiencing a primary atherosclerotic CVD event is 2 to 3 times higher in women with 1 or more major risk factors when compared with women with optimal riskfactor levels, whereas in men of similar age risk is elevated by about 1.5-fold.2Control of modifiable CVD risk factors is the cornerstone of primary CVD prevention.3 Prominent in guidelines for improving CVD risk factors are lifestyle behaviors including regular physical activity.4
Many studies show self-reported physical activity (PA) is favorably associated with CVD risk factors.5–7Self-report data
From the School of Public Health and Health Professions, University at Buffalo—SUNY, Buffalo, NY (M.J.L.); School of Medicine, University of Alabama-Birmingham, AL (C.E.L.); University of Illinois, Urbana Champaign, IL (D.M.B.); Gillings School of Public Health, University of North Carolina, Chapel Hill, NC (K.R.E.); Fred Hutchinson Cancer Research Center, Seattle, WA (E.R.-S., C.D.); School of Medicine and Public Health, Harvard University, Boston, MA (I.-M.L.); School of Medicine, University of California, San Diego, CA (J.B., A.Z.L.); School of Medicine, Stanford University, Palo Alto, CA (M.L.S.); Warren Alpert Medical School, Brown University, Providence, RI (C.B.E.); MedStar Health Research Institute and Georgetown/Howard Universities Centers for Clinical and Translational Research, Washington, DC (B.V.H.); RAND Corporation, Santa Monica, CA (C.B.).
Correspondence to:Michael J. LaMonte, PhD, MPH, Department of Epidemiology and Environmental Health, School of Public Health and Health Professions,
University at Buffalo—SUNY, 270 Farber Hall, 3435 Main St, Buffalo, NY. E-mail: [email protected] Received June 30, 2017; accepted August 4, 2017.
on PA are prone to measurement error and reporting biases. Typically, only 10% to 20% of the variance in accelerometer-measured PA is explained by self-reported activity8; measure-ment error may be even greater in older adults.9Associations between self-reported PA and CVD risk factors, therefore, could be underestimated. Accelerometer-measured PA is becoming more cost-efficient for use in large epidemiologic cohort studies.10 These devices can improve accuracy of measuring overall PA levels, and importantly could enhance measurement of habitual light intensity activity, which is a prominent domain in older adult lives and especially difficult to assess by questionnaire. It is generally accepted that self-report and device-based PA assessments are measuring related, but different aspects of PA (Troiano, 2012).11This is not to diminish the potential utility of self-report measures in certain settings (Pettee, 2012).12However, to more precisely determine associations between PA and disease characteris-tics across the spectrum of PA intensity, accelerometer-based measures are preferable. Compared with studies using self-reported PA, fewer studies have been published in which accelerometer-measured PA has been related to CVD risk factors in adults.13–25 Previous studies often have included relatively small sample sizes,16,17,22,24,25 and few have reported results in older postmenopausal women.17,24 Pub-lished data pertaining to the relationship between light intensity PA and CVD risk factors are limited.26The purpose
of this study was to examine associations between
accelerometer-measured PA and CVD risk factors in a large cohort of older women of different race-ethnicities, with a focus on light intensity PA.
Methods
Participants
Women included in the present study were enrolled in the OPACH (Objective Physical Activity and Cardiovascular Health) Study, which is a prospective epidemiologic investi-gation of accelerometer-measured PA levels and incidence of CVD in women ages 63 to 99 years that is ancillary to the Women’s Health Initiative (WHI) Program. Details of the scientific objectives, eligibility, and implementation of the WHI27 and OPACH10 studies have been published. During 2012 to 2013, 7875 women participated in the WHI Long Life Study for which examinations were completed in their homes to collect new data on factors associated with healthy aging and changing levels of cardiovascular health. Informed consent was obtained before the home examination, which included fasting blood draw (serum, EDTA plasma), question-naires on personal health status and lifestyle habits, mea-sured height, weight, waist circumference, resting blood pressure and pulse, and a physical functioning performance test (Short Physical Performance Battery). A subset of 7048 women in the Long Life Study consented to participate in the OPACH study and were given an accelerometer, wear instructions, a sleep log, and an OPACH PA questionnaire. After the prescribed wear interval, participants mailed the accelerometer and completed forms back to the WHI coordinating center. Almost all women (95.3%) returned their accelerometer, and of these 92.4% (n=6512) had data available for analysis.
Accelerometer Measure of PA
Participants were asked to wear a triaxial accelerometer (ActiGraph GT3X+; Pensacola, FL) on their hip placed anterior to the iliac crest and secured with a belt for 7 consecutive days during waking and sleeping hours except when bathing or swimming. Acceleration data from the 3 planes were processed with ActiGraph software (ActiLife, version 6) using 15-s epochs (raw data recorded at 30 Hz) and the normal filter, and were integrated in a vector magnitude count by taking the square root of the sum of squared axes (vertical, anterior–posterior, and medial– lat-eral). The vector magnitude counts were summarized to define intensity-specific PA levels that were categorized for analysis as low light intensity (19–225 counts/15 s), high light intensity (226–518), moderate-to-vigorous intensity (MVPA; ≥519), and total PA (≥19 counts/15 s). Low light corresponds to standing activities with little movement (eg, wash/dry dishes), high light corresponds to activities such as slow walking (1.5 mph [0.7 m/s]) on level ground, and MVPA corresponds to brisk walking (2.0–2.5 mph [0.9– 1.1 m/s]) on level ground. The standard energy expenditure,
Clinical Perspective
What Is New?
• Physical activity (PA) measured by accelerometers is novel to large epidemiologic studies, and allows for more accurate classification of overall PA levels as well as lighter intensity PA that is prevalent in later life and is difficult to quantify by recall questionnaire.
What Are the Clinical Implications?
• Because several major modifiable cardiovascular disease risk factors as well as predicted 10-year cardiovascular disease risk were favorably associated with both light intensity PA and the guideline-recommended moderate-to-vigorous PA in women ages 63 to 99 years, clinicians and public health practitioners should consider the potential cardiometabolic benefits through promoting light intensity activities in an aging US population.
• Results suggest that for those older adults interested and able to do more intensive PA, greater benefits could accrue.
N
AL
RE
expressed as metabolic equivalents, corresponding to low light, high light, and MVPA are 1.6 to 2.2, 2.3 to 2.9, and ≥3.0 metabolic equivalents, when 1 metabolic equivalent is defined as 3.5 mL O2 uptake/kg body mass/min. The cut points were derived from a calibration study conducted in women of similar age and race-ethnicity as the OPACH cohort,28 which enhances sensitivity of classifying accelerometer PA levels in this study.
Accelerometer wear was identified using information from the sleep logs and a computer-based automated algorithm developed in the OPACH study.29Nonwear was defined using a standard protocol.30To be included in the present analysis, we required at least 4 of 7 days with ≥10 hours/d of accelerometer wear. In-bed time was not included in the present analysis. As the focus of the present study was on intensity-specific PA levels in relation to CVD risk factors, sedentary time was not included in this analysis. Controlling for awake wear-time in our statistical analysis does account, to an extent, for differences in sedentary time between participants.
CVD Risk Factor Measures
Fasting blood was obtained by venipuncture at the home visit. Participants were instructed to fast for 12 hours and refrain from smoking and vigorous activities before collection. Blood vials were centrifuged by data collectors within 2 hours of blood draw, and shipped overnight priority mail to the Fred Hutchinson Cancer Research Center Specimen Processing Laboratory. Aliquots were frozen and shipped to the WHI Biorepository (Fisher Bioservices, Rockville, MD) for long-term storage at 80°C until analysis. One of the serum aliquots for each participant was sent from the WHI Biorepository to the University of Minnesota Fairview ARDL Laboratory for CVD biomarker testing within 6 to 12 months of the draw date. Assays were performed using standardized Clinical Laboratory Improvement Act–approved methods. Coefficients of variation in replicate quality assurance samples for the CVD risk factors included in the present study were 2.1% total cholesterol, 3.3% low-density lipoprotein cholesterol, 2.9% high-density lipopro-tein cholesterol (HDL), 2.1% triglyceride, 1.8% glucose, 4.9% insulin, and 2.9% high-sensitivity C-reactive protein (CRP).
Resting blood pressure (BP) was measured (following 5 minutes of sitting quietly) by auscultation using an aneroid sphygmomanometer and cuff size based on measured arm circumference. The first and fifth Korotkoff sounds defined systolic and diastolic BP, respectively, and the average of 2 measures was recorded. Height (cm) and weight (kg) were measured using a portable scale and stadiometer; body mass index (BMI; kg/m2) was computed. Waist circumference (cm) was measured level with the iliac crest using an anthropometric tape measure. The Reynolds Risk Score (RRS) for 10-year
predicted CVD risk was computed as a summary measure of cardiovascular risk. The RRS is computed using age, systolic BP, CRP, total and HDL cholesterol, diabetes mellitus status, hemoglobin A1c (if diabetic), smoking status, and family history of premature myocardial infarction, and has been shown to strongly discriminate actual CVD event risk in the WHI cohort.31Hemoglobin A1c is not available in the OAPCH study and therefore not included in the RRS computation.
Statistical Analysis
Included in the present analysis were 4832 women without known CVD for whom at least 4 days of ≥10 hours/d of accelerometer wear and complete CVD risk factor measures were available. Participant characteristics were described for the entire cohort, and then compared according to quartiles of total PA using generalized linear models for continuous variables and v2 tests for proportions. Linear correlations between CVD risk factors and PA measures were evaluated using Spearman correlations controlling for awake accelerom-eter wear time and age. Mean CVD risk factors were compared according to quartiles of low light, high light PA, and MVPA using general linear models first controlling for accelerometer wear time, age, race-ethnicity, education, current smoking, alcohol intake, age at menopause, and Short Physical Performance Battery; additional adjustment for BMI was performed then. Linear trends were assessed by assigning the median to PA quartiles entered as an ordinal term in the model. Multivariable logistic regression analysis was used to estimate odds ratios and 95% confidence intervals for clinically relevant levels of CVD risk factors associated with a 30 minutes/d increment in each PA measure (separately). Cut points for the CVD measures were
total cholesterol ≥6.2 mmol/L (240 mg/dL), HDL
<1.3 mmol/L (50 mg/dL), triglyceride ≥1.7 mmol/L
(150 mg/dL), systolic BP ≥135 mm Hg, glucose
≥5.4 mmol/L (100 mg/dL), BMI≥30 kg/m2, CRP>3 mg/L, and RRS ≥20. The thresholds for HDL, triglyceride, systolic BP, and glucose correspond to those used to define metabolic syndrome, and for total cholesterol that which defines a clinically relevant high level.32 The CRP threshold has identified those with high risk of atherosclerotic CVD33; and the RRS threshold has defined women at high risk for a major CVD event during a 10-year period.31 The RRS has discrim-inated observed CHD events better than the Framingham score in the WHI31 and is, therefore, used here. Logistic regression analyses were completed for the overall cohort and according to subgroups defined by age (<80, ≥80 years; an approximate median split) and race-ethnicity (white, black, Hispanic). Lastly, linear regression was used to examine the multivariable relationship between PA and RRS, mutually adjusting for each PA measure in a single model. This provides
N
AL
RE
understanding about the relevance of PA intensity with respect to an association observed with RRS. Analyses were completed using SAS version 9.4 (SAS Institute, Cary, NC) and allPvalues are for 2-sided hypothesis tests ata0.05.
Results
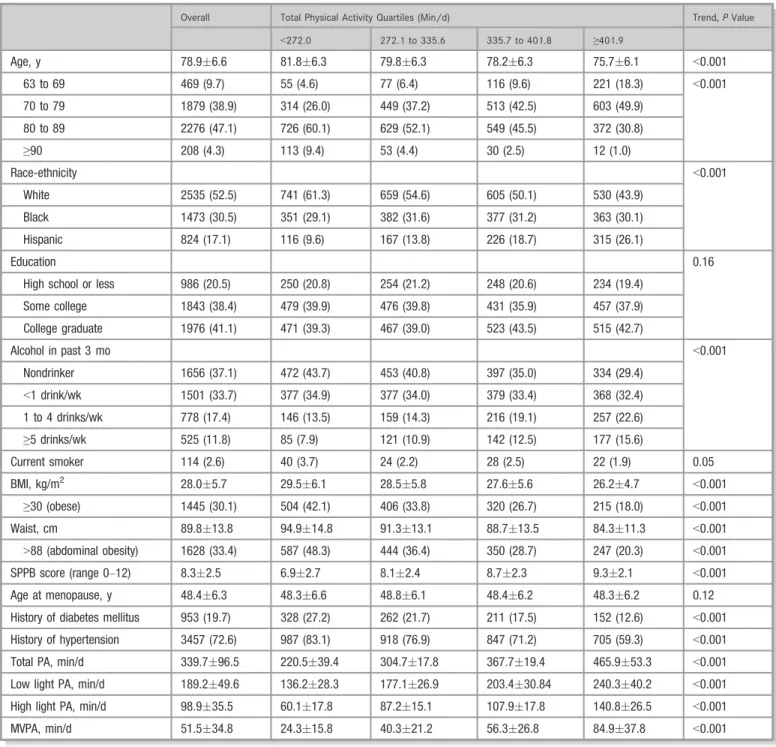
Characteristics of the overall cohort and according to total PA levels are shown in Table 1. The mean age among all women was 78.9 years, 52.5% were white, 79.5% had at least some
college education, 62.9% drank some alcohol, and 2.6% were current smokers. On average, women had Short Physical Performance Battery physical functioning scores of 8.3 out of a possible maximum of 12. About one third of women were obese (BMI ≥30 kg/m2), 33.4% were abdominally obese (waist >88 cm), and 19.7% and 72.6% had a history of diagnosed or treated diabetes mellitus and hypertension, respectively.
Compared with women in the lowest quartile of total PA, those in the highest quartile were younger, less likely to be white, current smokers, obese or abdominally obese, or have
Table 1. Participant Characteristics for the Overall Cohort and According to Quartiles of Total Physical Activity (N=4832)
Overall Total Physical Activity Quartiles (Min/d) Trend,PValue
<272.0 272.1 to 335.6 335.7 to 401.8 ≥401.9
Age, y 78.96.6 81.86.3 79.86.3 78.26.3 75.76.1 <0.001
63 to 69 469 (9.7) 55 (4.6) 77 (6.4) 116 (9.6) 221 (18.3) <0.001
70 to 79 1879 (38.9) 314 (26.0) 449 (37.2) 513 (42.5) 603 (49.9)
80 to 89 2276 (47.1) 726 (60.1) 629 (52.1) 549 (45.5) 372 (30.8)
≥90 208 (4.3) 113 (9.4) 53 (4.4) 30 (2.5) 12 (1.0)
Race-ethnicity <0.001
White 2535 (52.5) 741 (61.3) 659 (54.6) 605 (50.1) 530 (43.9)
Black 1473 (30.5) 351 (29.1) 382 (31.6) 377 (31.2) 363 (30.1)
Hispanic 824 (17.1) 116 (9.6) 167 (13.8) 226 (18.7) 315 (26.1)
Education 0.16
High school or less 986 (20.5) 250 (20.8) 254 (21.2) 248 (20.6) 234 (19.4)
Some college 1843 (38.4) 479 (39.9) 476 (39.8) 431 (35.9) 457 (37.9)
College graduate 1976 (41.1) 471 (39.3) 467 (39.0) 523 (43.5) 515 (42.7)
Alcohol in past 3 mo <0.001
Nondrinker 1656 (37.1) 472 (43.7) 453 (40.8) 397 (35.0) 334 (29.4)
<1 drink/wk 1501 (33.7) 377 (34.9) 377 (34.0) 379 (33.4) 368 (32.4)
1 to 4 drinks/wk 778 (17.4) 146 (13.5) 159 (14.3) 216 (19.1) 257 (22.6)
≥5 drinks/wk 525 (11.8) 85 (7.9) 121 (10.9) 142 (12.5) 177 (15.6)
Current smoker 114 (2.6) 40 (3.7) 24 (2.2) 28 (2.5) 22 (1.9) 0.05
BMI, kg/m2 28.05.7 29.56.1 28.55.8 27.65.6 26.24.7 <0.001
≥30 (obese) 1445 (30.1) 504 (42.1) 406 (33.8) 320 (26.7) 215 (18.0) <0.001
Waist, cm 89.813.8 94.914.8 91.313.1 88.713.5 84.311.3 <0.001
>88 (abdominal obesity) 1628 (33.4) 587 (48.3) 444 (36.4) 350 (28.7) 247 (20.3) <0.001
SPPB score (range 0–12) 8.32.5 6.92.7 8.12.4 8.72.3 9.32.1 <0.001
Age at menopause, y 48.46.3 48.36.6 48.86.1 48.46.2 48.36.2 0.12
History of diabetes mellitus 953 (19.7) 328 (27.2) 262 (21.7) 211 (17.5) 152 (12.6) <0.001
History of hypertension 3457 (72.6) 987 (83.1) 918 (76.9) 847 (71.2) 705 (59.3) <0.001
Total PA, min/d 339.796.5 220.539.4 304.717.8 367.719.4 465.953.3 <0.001
Low light PA, min/d 189.249.6 136.228.3 177.126.9 203.430.84 240.340.2 <0.001
High light PA, min/d 98.935.5 60.117.8 87.215.1 107.917.8 140.826.5 <0.001
MVPA, min/d 51.534.8 24.315.8 40.321.2 56.326.8 84.937.8 <0.001
Data are meanSD, or N (%). BMI indicates body mass index; PA, physical activity; MVPA, moderate-to-vigorous physical activity; SPPB, short physical performance battery.
N
AL
RE
histories of diabetes mellitus or hypertension (P<0.001, all except smoking, Table 1). Women with higher versus lower total PA had higher physical functioning scores and alcohol intake (P<0.001, each). Age at menopause and education were not associated with total PA levels.
The majority of daily activity time in the overall cohort was spent in low light intensity PA, the mean of which represented about 55% of total daily PA time (Table 1). High light intensity PA and MVPA accounted for the remaining 30% and 15% of total daily PA time, respectively.
When compared with women included in the present analysis, those who received but did not return accelerom-eters (n=569) were slightly older (mean 80.0 years), had somewhat lower physical function (mean Short Physical Performance Battery score 7.2), a higher proportion of racial-ethnic minorities (44.6% white, 42.9% black, and 12.5% Hispanic), were slightly more obese (31.1%), and had higher proportions of diagnosed diabetes mellitus (23.9%) and hypertension (75.8%). Women who returned accelerometers but did not meet the wear criteria for inclusion in the present analysis (n=363) were similar in the above characteristics as the women who received but did not return accelerometers, with the exception of age (mean 78.6 years).
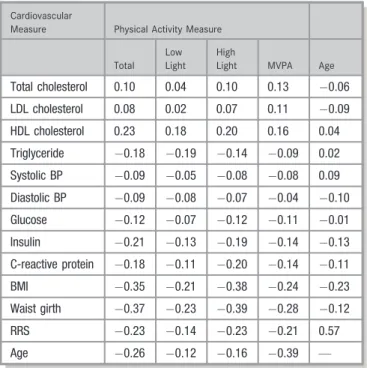
Spearman correlations between CVD risk factors and PA measures are shown in Table 2. With the exceptions of total and low-density lipoprotein cholesterol, all CVD measures were correlated with each PA measure in the expected direction. Correlations were strongest for age, HDL, BMI and waist girth and RRS. Age was significantly correlated with each CVD risk factor except for triglyceride and HDL.
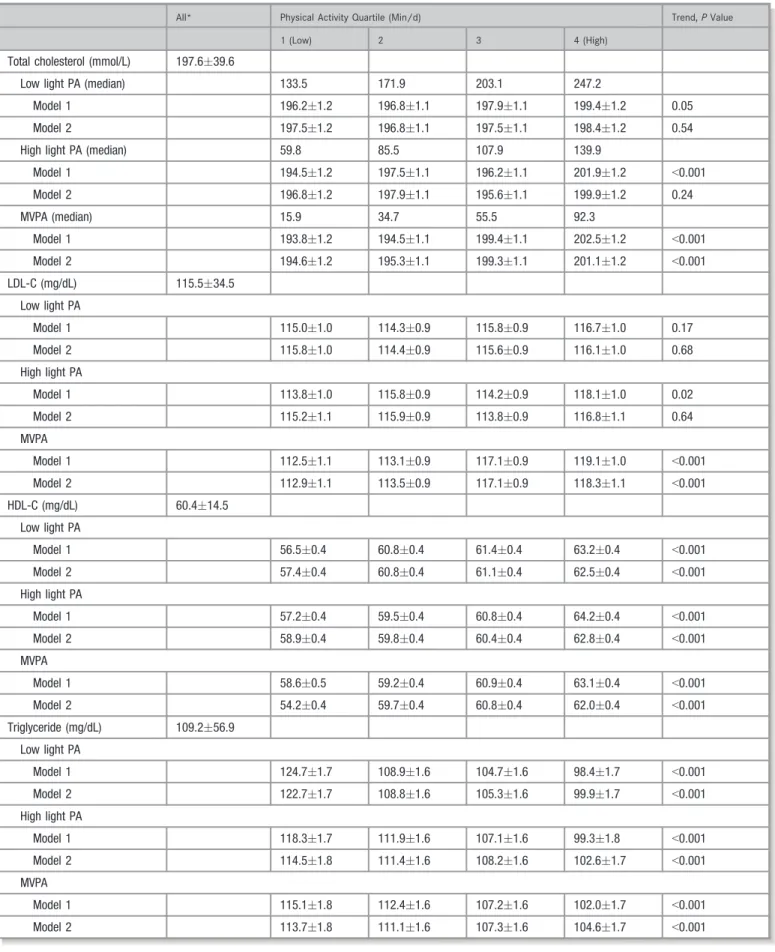
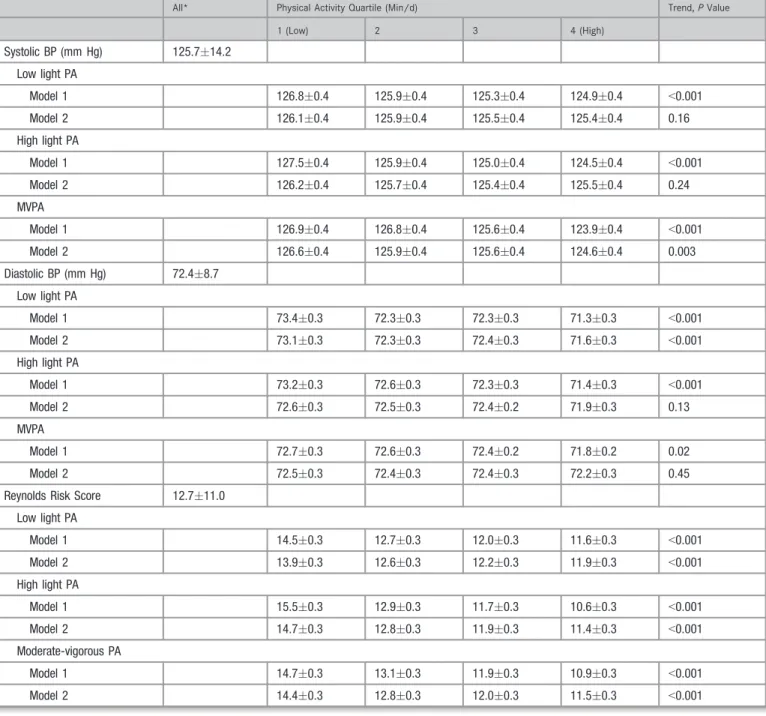
Table 3 presents mean lipids, BP, and RRS in the overall cohort, as well as adjusted means according to quartiles of each PA measure. Mean lipids and BP were within clinical limits, and the mean RRS of 12.7% indicated an intermediate level of 10-year predicted CVD risk (ie, RRS 10–20%). Multivariable adjusted mean total and low-density lipoprotein cholesterol was positively associated with high light and MVPA (P<0.05, all); further adjustment for BMI eliminated the associations with high light PA, whereas MVPA remained statistically significant (P<0.001, each). Mean HDL was positively associated, and mean triglyceride inversely associ-ated, with each PA measure when adjusted for all covariables including BMI (P<0.001, all). Adjusted means for systolic and diastolic BP were inversely associated with each PA measure (P<0.05, all); additional adjustment for BMI eliminated associations for low light and high light PA with systolic BP, and for high light and MVPA with diastolic BP. Mean RRS was inversely associated with each PA measure when fully adjusted for covariables including BMI (P<0.001, all).
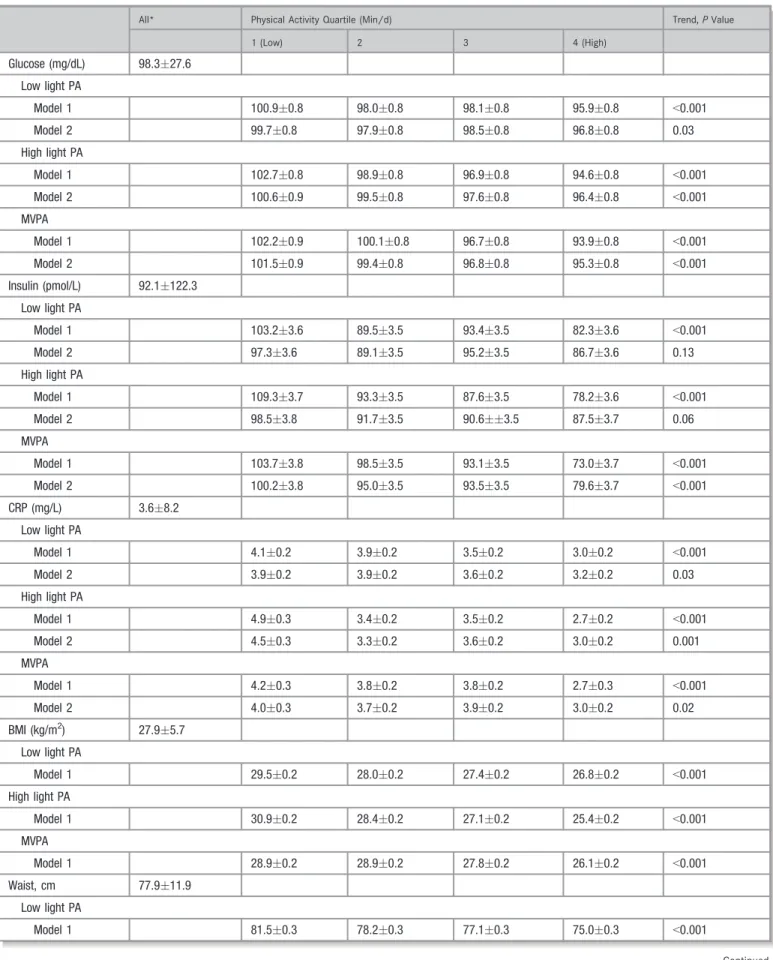
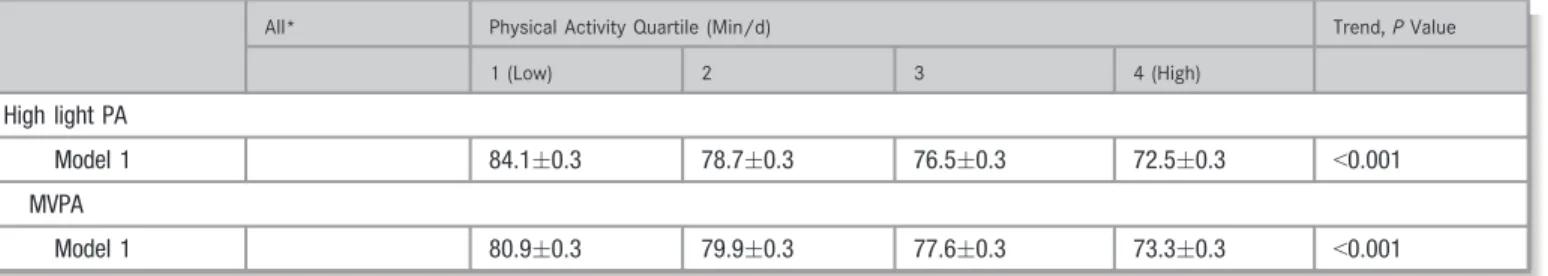
Results for measures of insulin-glucose homeostasis, CRP, and adiposity are shown in Table 4. Mean values for the cohort tended to be within clinical limits with the exception of CRP
being elevated indicating high CVD risk, and BMI indicating overweight. Mean glucose was inversely associated with each PA measure in fully adjusted models (P<0.05, all). Mean insulin was significantly inversely associated with each PA measure when adjusted for covariables (P<0.001, each), but was associated only with MVPA following additional adjustment for BMI (P<0.001). Each measure of PA was inversely associ-ated with mean BMI and mean waist (P<0.001, all), and with mean CRP including when adjusted for BMI (P<0.05, all).
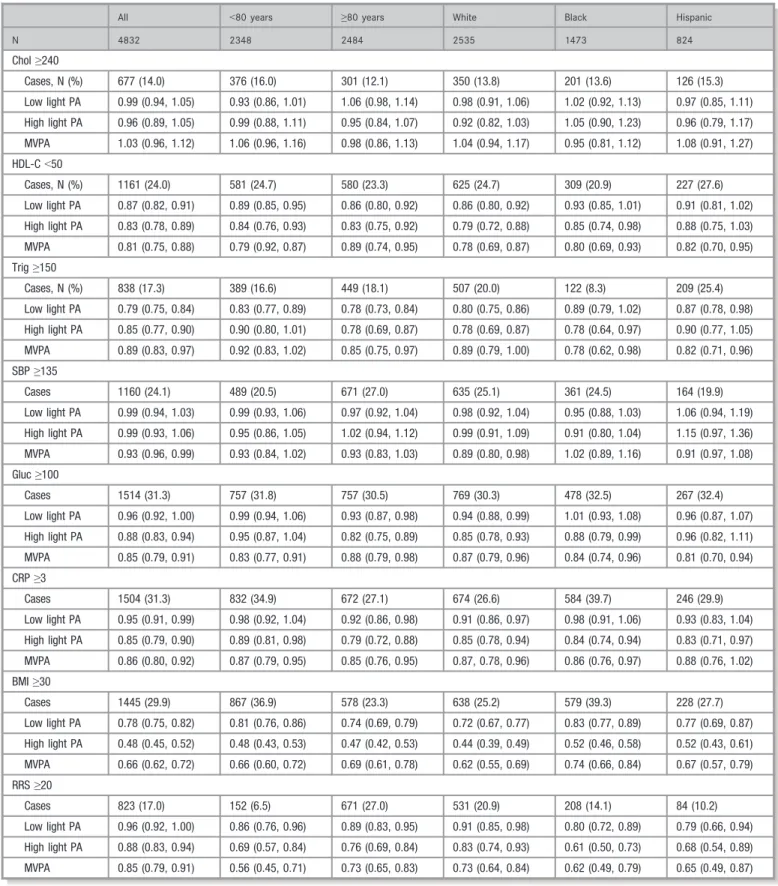
To provide more clinical context to associations with PA measures, we examined multivariable odds ratios for pres-ence of clinically relevant levels of CVD measures in relation to a 30 minute/day increment in PA measures (Table 5). Among all women, none of the PA measures were associated with presence of high total cholesterol. Significant inverse associations were observed for each PA measure with presence of low HDL and elevated triglyceride. Only MVPA was associated with lower odds of having elevated systolic BP. High light and MVPA were inversely associated with presence of elevated glucose. Each PA measure was signif-icantly inversely associated with presence of high CRP, and BMI-defined obesity. High light and MVPA were significantly inversely associated with high RRS.
We next evaluated these associations in cohort subgroups defined by age and race-ethnicity (Table 5). The same
Table 2. Age- and Accelerometer Wear-Time Adjusted Spearman Correlations* Between Physical Activity and Cardiovascular Health Measures (N=4832)
Cardiovascular
Measure Physical Activity Measure
Total Low Light
High
Light MVPA Age
Total cholesterol 0.10 0.04 0.10 0.13 0.06
LDL cholesterol 0.08 0.02 0.07 0.11 0.09
HDL cholesterol 0.23 0.18 0.20 0.16 0.04
Triglyceride 0.18 0.19 0.14 0.09 0.02
Systolic BP 0.09 0.05 0.08 0.08 0.09
Diastolic BP 0.09 0.08 0.07 0.04 0.10
Glucose 0.12 0.07 0.12 0.11 0.01
Insulin 0.21 0.13 0.19 0.14 0.13
C-reactive protein 0.18 0.11 0.20 0.14 0.11
BMI 0.35 0.21 0.38 0.24 0.23
Waist girth 0.37 0.23 0.39 0.28 0.12
RRS 0.23 0.14 0.23 0.21 0.57
Age 0.26 0.12 0.16 0.39 —
Correlations between age and CVD risk factors are unadjusted. BMI, body mass index; BP, blood pressure; HDL, high-density lipoprotein; LDL, low-density lipoprotein; MVPA, moderate-to-vigorous physical activity; RRS, Reynolds Risk Score.
*All correlations are statistically significant (P<0.01) except for LDL with low light intensity, and age with triglyceride and HDL.
N
AL
RE
Table 3. Mean Lipids, Resting Blood Pressure, and Reynolds Risk Score According to Quartiles of Physical Activity (N=4832)
All* Physical Activity Quartile (Min/d) Trend,PValue
1 (Low) 2 3 4 (High)
Total cholesterol (mmol/L) 197.639.6
Low light PA (median) 133.5 171.9 203.1 247.2
Model 1 196.21.2 196.81.1 197.91.1 199.41.2 0.05
Model 2 197.51.2 196.81.1 197.51.1 198.41.2 0.54
High light PA (median) 59.8 85.5 107.9 139.9
Model 1 194.51.2 197.51.1 196.21.1 201.91.2 <0.001
Model 2 196.81.2 197.91.1 195.61.1 199.91.2 0.24
MVPA (median) 15.9 34.7 55.5 92.3
Model 1 193.81.2 194.51.1 199.41.1 202.51.2 <0.001
Model 2 194.61.2 195.31.1 199.31.1 201.11.2 <0.001
LDL-C (mg/dL) 115.534.5
Low light PA
Model 1 115.01.0 114.30.9 115.80.9 116.71.0 0.17
Model 2 115.81.0 114.40.9 115.60.9 116.11.0 0.68
High light PA
Model 1 113.81.0 115.80.9 114.20.9 118.11.0 0.02
Model 2 115.21.1 115.90.9 113.80.9 116.81.1 0.64
MVPA
Model 1 112.51.1 113.10.9 117.10.9 119.11.0 <0.001
Model 2 112.91.1 113.50.9 117.10.9 118.31.1 <0.001
HDL-C (mg/dL) 60.414.5
Low light PA
Model 1 56.50.4 60.80.4 61.40.4 63.20.4 <0.001
Model 2 57.40.4 60.80.4 61.10.4 62.50.4 <0.001
High light PA
Model 1 57.20.4 59.50.4 60.80.4 64.20.4 <0.001
Model 2 58.90.4 59.80.4 60.40.4 62.80.4 <0.001
MVPA
Model 1 58.60.5 59.20.4 60.90.4 63.10.4 <0.001
Model 2 54.20.4 59.70.4 60.80.4 62.00.4 <0.001
Triglyceride (mg/dL) 109.256.9
Low light PA
Model 1 124.71.7 108.91.6 104.71.6 98.41.7 <0.001
Model 2 122.71.7 108.81.6 105.31.6 99.91.7 <0.001
High light PA
Model 1 118.31.7 111.91.6 107.11.6 99.31.8 <0.001
Model 2 114.51.8 111.41.6 108.21.6 102.61.7 <0.001
MVPA
Model 1 115.11.8 112.41.6 107.21.6 102.01.7 <0.001
Model 2 113.71.8 111.11.6 107.31.6 104.61.7 <0.001
Continued
N
AL
RE
patterns of associations between each PA measure and clinically relevant risk factors observed in the overall cohort were also present in younger and older women, with few exceptions. Elevated systolic BP was not associated with any PA measure in either age group, and in younger women, elevated glucose was not associated with low light or high light PA and elevated CRP was not associated with low light PA. Likewise, patterns of association seen in the overall
cohort also tended to be observed for each race-ethnic subgroup. Statistical significance was more variable across race-ethnic subgroups because sample sizes were smaller, especially for Hispanic women in whom estimates were somewhat less stable. In each race-ethnic subgroup, however, significant inverse associations for MVPA were present with presence of low HDL, elevated triglyceride, obesity, elevated CRP, and high RRS.
Table 3. Continued
All* Physical Activity Quartile (Min/d) Trend,PValue
1 (Low) 2 3 4 (High)
Systolic BP (mm Hg) 125.714.2
Low light PA
Model 1 126.80.4 125.90.4 125.30.4 124.90.4 <0.001
Model 2 126.10.4 125.90.4 125.50.4 125.40.4 0.16
High light PA
Model 1 127.50.4 125.90.4 125.00.4 124.50.4 <0.001
Model 2 126.20.4 125.70.4 125.40.4 125.50.4 0.24
MVPA
Model 1 126.90.4 126.80.4 125.60.4 123.90.4 <0.001
Model 2 126.60.4 125.90.4 125.60.4 124.60.4 0.003
Diastolic BP (mm Hg) 72.48.7
Low light PA
Model 1 73.40.3 72.30.3 72.30.3 71.30.3 <0.001
Model 2 73.10.3 72.30.3 72.40.3 71.60.3 <0.001
High light PA
Model 1 73.20.3 72.60.3 72.30.3 71.40.3 <0.001
Model 2 72.60.3 72.50.3 72.40.2 71.90.3 0.13
MVPA
Model 1 72.70.3 72.60.3 72.40.2 71.80.2 0.02
Model 2 72.50.3 72.40.3 72.40.3 72.20.3 0.45
Reynolds Risk Score 12.711.0
Low light PA
Model 1 14.50.3 12.70.3 12.00.3 11.60.3 <0.001
Model 2 13.90.3 12.60.3 12.20.3 11.90.3 <0.001
High light PA
Model 1 15.50.3 12.90.3 11.70.3 10.60.3 <0.001
Model 2 14.70.3 12.80.3 11.90.3 11.40.3 <0.001
Moderate-vigorous PA
Model 1 14.70.3 13.10.3 11.90.3 10.90.3 <0.001
Model 2 14.40.3 12.80.3 12.00.3 11.50.3 <0.001
Quartile range for PA (min/d): Low light PA:≤154.0, 154.1 to 186.8, 186.9 to 219.8,≥219.9. High light PA:≤74.1, 74.2 to 96.5, 96.6 to 121.2,≥121.3. Moderate-vigorous PA:≤25.2, 25.3 to 44.5, 44.6 to 69.8,≥69.9. Model 1: meanSE adjusted for accelerometer wear-time, age, race-ethnicity, education, smoking (except RRS model), alcohol, age at menopause, and SPPB score. Model 2: meanSE adjusted for above plus BMI. BMI indicates body mass index; BP, blood pressure; HDL-C, high-density lipoprotein cholesterol; LDL-C, low-density lipoprotein cholesterol; MVPA, moderate-to-vigorous physical activity; PA, physical activity; SPPB, short physical performance battery.
*Unadjusted meanSD for overall cohort. Reynolds Risk Score, the 10-Yr predicted probability (%) of developing CVD
N
AL
RE
Table 4. Mean Glucose, Insulin, CRP, BMI, and Waist Girth According to Quartiles of Physical Activity (N=4832)
All* Physical Activity Quartile (Min/d) Trend,PValue
1 (Low) 2 3 4 (High)
Glucose (mg/dL) 98.327.6
Low light PA
Model 1 100.90.8 98.00.8 98.10.8 95.90.8 <0.001
Model 2 99.70.8 97.90.8 98.50.8 96.80.8 0.03
High light PA
Model 1 102.70.8 98.90.8 96.90.8 94.60.8 <0.001
Model 2 100.60.9 99.50.8 97.60.8 96.40.8 <0.001
MVPA
Model 1 102.20.9 100.10.8 96.70.8 93.90.8 <0.001
Model 2 101.50.9 99.40.8 96.80.8 95.30.8 <0.001
Insulin (pmol/L) 92.1122.3
Low light PA
Model 1 103.23.6 89.53.5 93.43.5 82.33.6 <0.001
Model 2 97.33.6 89.13.5 95.23.5 86.73.6 0.13
High light PA
Model 1 109.33.7 93.33.5 87.63.5 78.23.6 <0.001
Model 2 98.53.8 91.73.5 90.63.5 87.53.7 0.06
MVPA
Model 1 103.73.8 98.53.5 93.13.5 73.03.7 <0.001
Model 2 100.23.8 95.03.5 93.53.5 79.63.7 <0.001
CRP (mg/L) 3.68.2
Low light PA
Model 1 4.10.2 3.90.2 3.50.2 3.00.2 <0.001
Model 2 3.90.2 3.90.2 3.60.2 3.20.2 0.03
High light PA
Model 1 4.90.3 3.40.2 3.50.2 2.70.2 <0.001
Model 2 4.50.3 3.30.2 3.60.2 3.00.2 0.001
MVPA
Model 1 4.20.3 3.80.2 3.80.2 2.70.3 <0.001
Model 2 4.00.3 3.70.2 3.90.2 3.00.2 0.02
BMI (kg/m2) 27.95.7
Low light PA
Model 1 29.50.2 28.00.2 27.40.2 26.80.2 <0.001
High light PA
Model 1 30.90.2 28.40.2 27.10.2 25.40.2 <0.001
MVPA
Model 1 28.90.2 28.90.2 27.80.2 26.10.2 <0.001
Waist, cm 77.911.9
Low light PA
Model 1 81.50.3 78.20.3 77.10.3 75.00.3 <0.001
Continued
N
AL
RE
To evaluate the robustness of findings for analyses conducted on each intensity-specific PA measure separately, we further evaluated their relationships with RRS, used as a summary measure of CVD risk. Thefigure shows scatterplots of the inverse age and accelerometer wear time–adjusted rela-tionships between each PA measure and RRS. We next used multivariable linear regression to evaluate the relationships between RRS and each intensity-specific PA measure control-ling for confounders, with and without mutual adjustment for each PA measure in a single model. Results are presented in Table 6 and show significant inverse relationships between RRS and each PA measure (P<0.001, each) with the strongest relationship seen for high light PA. Associations were attenu-ated but generally remained significant (P<0.01) following further mutual adjustment for each PA intensity.
It is possible that medication use could have influenced some of the associations observed in this study; however, information was not available on use of specific medications that could be relevant. We therefore conducted a sensitivity analysis excluding women reporting a history of diagnosed treated diabetes mellitus (n=954) and hypertension (n=3475). Results were consistent with the primary findings. Age- and accelerometer wear time–adjusted Spearman correlations for total PA and fasting glucose and Homeostatic Model Assess-ment-Insulin Resistance were 0.12 and 0.22 for the overall cohort, and were 0.08 and 0.21 after exclusion on diabetes mellitus. Correlations for total PA with resting systolic BP were 0.08 and 0.03 before and after excluding on hypertension;
and with RRS were 0.23 and 0.14 before and after
excluding on both diabetes mellitus and hypertension. Trends in means for these risk factors across intensity-specific PA quartiles, and associations between a 30-minutes/d increment in PA and clinical levels of these risk factors also were consistent with the primary results (data not shown).
Discussion
The mainfindings of this large cross-sectional study in race-ethnically diverse older postmenopausal women are that
greater amounts of accelerometer-measured total, light, and MVPA were associated with better levels of a number of modifiable major CVD risk factors; with lower odds of having prevalent clinically relevant risk factor levels; and with lower predicted 10-year CVD risk. The associations were observed after adjustments for several relevant confounding factors including objectively measured physical functioning and BMI, and generally were consistent when stratified across age and race-ethnic subgroups. A major novel finding of the present study is the beneficial associations of PA at intensities below MVPA, which typically is recommended for health benefits including control of CVD risk factors. Indeed, the majority of the cardiometabolic factors evaluated among these older women showed favorable associations with low- and high light intensity PA that were statistically significant when adjusted for a range of confounding influences. These results add important information to the sparse but growing evidence regarding the health benefits of light intensity PA.26 Furthermore, to our knowledge, this is one of the first large epidemiologic studies to relate accelerometer measures of intensity-specific PA with pre-dicted CVD risk (RRS) and cardiometabolic risk factors in a defined cohort of older postmenopausal women. Because the population burden of CVD will grow in parallel with the growth of the 65 and older age group in coming decades, the present results have relevance to both public health and healthy aging.
Few published studies have reported on relationships between accelerometer-measured PA and CVD risk factors specifically in older women. Gando et al17 observed a significant inverse relationship between HOMA insulin resis-tance scores and incremental quartiles of light intensity PA measured using a triaxial accelerometer, after adjusting for age, waist circumference, cardiorespiratory fitness, and accelerometer-measured MVPA in 198 women who were, on average, 59 years of age and had low fitness levels. Accelerometer cut points used to define light PA were not reported, which limits precise comparison to our results. However, the inverse relationship with light PA and insulin–
Table 4. Continued
All* Physical Activity Quartile (Min/d) Trend,PValue
1 (Low) 2 3 4 (High)
High light PA
Model 1 84.10.3 78.70.3 76.50.3 72.50.3 <0.001
MVPA
Model 1 80.90.3 79.90.3 77.60.3 73.30.3 <0.001
Quartile range (footnoted) and medians for PA min/d same as in Table 2. Model 1: meanSE adjusted for accelerometer wear-time, age, race-ethnicity, education, smoking, alcohol, age at menopause, and SPPB score. Model 2: meanSE adjusted for above plus BMI (except for BMI and waist models). BMI indicates body mass index; CRP, C-reactive protein; MVPA, moderate-to-vigorous physical activity; PA, physical activity; SPPB, short physical performance battery.
*Unadjusted meanSD for overall cohort.
N
AL
RE
Table 5. Odds Ratios and 95% Confidence Intervals for Clinically Relevant Values of Cardiovascular Health Measures Associated With a 30-Min/d Increment in Physical Activity, Among All Women and Cohort Subgroups (N=4832)
All <80 years ≥80 years White Black Hispanic
N 4832 2348 2484 2535 1473 824
Chol≥240
Cases, N (%) 677 (14.0) 376 (16.0) 301 (12.1) 350 (13.8) 201 (13.6) 126 (15.3)
Low light PA 0.99 (0.94, 1.05) 0.93 (0.86, 1.01) 1.06 (0.98, 1.14) 0.98 (0.91, 1.06) 1.02 (0.92, 1.13) 0.97 (0.85, 1.11)
High light PA 0.96 (0.89, 1.05) 0.99 (0.88, 1.11) 0.95 (0.84, 1.07) 0.92 (0.82, 1.03) 1.05 (0.90, 1.23) 0.96 (0.79, 1.17)
MVPA 1.03 (0.96, 1.12) 1.06 (0.96, 1.16) 0.98 (0.86, 1.13) 1.04 (0.94, 1.17) 0.95 (0.81, 1.12) 1.08 (0.91, 1.27)
HDL-C<50
Cases, N (%) 1161 (24.0) 581 (24.7) 580 (23.3) 625 (24.7) 309 (20.9) 227 (27.6)
Low light PA 0.87 (0.82, 0.91) 0.89 (0.85, 0.95) 0.86 (0.80, 0.92) 0.86 (0.80, 0.92) 0.93 (0.85, 1.01) 0.91 (0.81, 1.02)
High light PA 0.83 (0.78, 0.89) 0.84 (0.76, 0.93) 0.83 (0.75, 0.92) 0.79 (0.72, 0.88) 0.85 (0.74, 0.98) 0.88 (0.75, 1.03)
MVPA 0.81 (0.75, 0.88) 0.79 (0.92, 0.87) 0.89 (0.74, 0.95) 0.78 (0.69, 0.87) 0.80 (0.69, 0.93) 0.82 (0.70, 0.95)
Trig≥150
Cases, N (%) 838 (17.3) 389 (16.6) 449 (18.1) 507 (20.0) 122 (8.3) 209 (25.4)
Low light PA 0.79 (0.75, 0.84) 0.83 (0.77, 0.89) 0.78 (0.73, 0.84) 0.80 (0.75, 0.86) 0.89 (0.79, 1.02) 0.87 (0.78, 0.98)
High light PA 0.85 (0.77, 0.90) 0.90 (0.80, 1.01) 0.78 (0.69, 0.87) 0.78 (0.69, 0.87) 0.78 (0.64, 0.97) 0.90 (0.77, 1.05)
MVPA 0.89 (0.83, 0.97) 0.92 (0.83, 1.02) 0.85 (0.75, 0.97) 0.89 (0.79, 1.00) 0.78 (0.62, 0.98) 0.82 (0.71, 0.96)
SBP≥135
Cases 1160 (24.1) 489 (20.5) 671 (27.0) 635 (25.1) 361 (24.5) 164 (19.9)
Low light PA 0.99 (0.94, 1.03) 0.99 (0.93, 1.06) 0.97 (0.92, 1.04) 0.98 (0.92, 1.04) 0.95 (0.88, 1.03) 1.06 (0.94, 1.19)
High light PA 0.99 (0.93, 1.06) 0.95 (0.86, 1.05) 1.02 (0.94, 1.12) 0.99 (0.91, 1.09) 0.91 (0.80, 1.04) 1.15 (0.97, 1.36)
MVPA 0.93 (0.96, 0.99) 0.93 (0.84, 1.02) 0.93 (0.83, 1.03) 0.89 (0.80, 0.98) 1.02 (0.89, 1.16) 0.91 (0.97, 1.08)
Gluc≥100
Cases 1514 (31.3) 757 (31.8) 757 (30.5) 769 (30.3) 478 (32.5) 267 (32.4)
Low light PA 0.96 (0.92, 1.00) 0.99 (0.94, 1.06) 0.93 (0.87, 0.98) 0.94 (0.88, 0.99) 1.01 (0.93, 1.08) 0.96 (0.87, 1.07)
High light PA 0.88 (0.83, 0.94) 0.95 (0.87, 1.04) 0.82 (0.75, 0.89) 0.85 (0.78, 0.93) 0.88 (0.79, 0.99) 0.96 (0.82, 1.11)
MVPA 0.85 (0.79, 0.91) 0.83 (0.77, 0.91) 0.88 (0.79, 0.98) 0.87 (0.79, 0.96) 0.84 (0.74, 0.96) 0.81 (0.70, 0.94)
CRP≥3
Cases 1504 (31.3) 832 (34.9) 672 (27.1) 674 (26.6) 584 (39.7) 246 (29.9)
Low light PA 0.95 (0.91, 0.99) 0.98 (0.92, 1.04) 0.92 (0.86, 0.98) 0.91 (0.86, 0.97) 0.98 (0.91, 1.06) 0.93 (0.83, 1.04)
High light PA 0.85 (0.79, 0.90) 0.89 (0.81, 0.98) 0.79 (0.72, 0.88) 0.85 (0.78, 0.94) 0.84 (0.74, 0.94) 0.83 (0.71, 0.97)
MVPA 0.86 (0.80, 0.92) 0.87 (0.79, 0.95) 0.85 (0.76, 0.95) 0.87, 0.78, 0.96) 0.86 (0.76, 0.97) 0.88 (0.76, 1.02)
BMI≥30
Cases 1445 (29.9) 867 (36.9) 578 (23.3) 638 (25.2) 579 (39.3) 228 (27.7)
Low light PA 0.78 (0.75, 0.82) 0.81 (0.76, 0.86) 0.74 (0.69, 0.79) 0.72 (0.67, 0.77) 0.83 (0.77, 0.89) 0.77 (0.69, 0.87)
High light PA 0.48 (0.45, 0.52) 0.48 (0.43, 0.53) 0.47 (0.42, 0.53) 0.44 (0.39, 0.49) 0.52 (0.46, 0.58) 0.52 (0.43, 0.61)
MVPA 0.66 (0.62, 0.72) 0.66 (0.60, 0.72) 0.69 (0.61, 0.78) 0.62 (0.55, 0.69) 0.74 (0.66, 0.84) 0.67 (0.57, 0.79)
RRS≥20
Cases 823 (17.0) 152 (6.5) 671 (27.0) 531 (20.9) 208 (14.1) 84 (10.2)
Low light PA 0.96 (0.92, 1.00) 0.86 (0.76, 0.96) 0.89 (0.83, 0.95) 0.91 (0.85, 0.98) 0.80 (0.72, 0.89) 0.79 (0.66, 0.94)
High light PA 0.88 (0.83, 0.94) 0.69 (0.57, 0.84) 0.76 (0.69, 0.84) 0.83 (0.74, 0.93) 0.61 (0.50, 0.73) 0.68 (0.54, 0.89)
MVPA 0.85 (0.79, 0.91) 0.56 (0.45, 0.71) 0.73 (0.65, 0.83) 0.73 (0.64, 0.84) 0.62 (0.49, 0.79) 0.65 (0.49, 0.87)
OR and 95% CI adjusted for accelerometer wear time, age, race-ethnicity (except race-ethnicity strata), education, smoking (except RRS model), alcohol, age at menopause, SPPB score, and BMI (except BMI model). Clinically relevant values for cardiovascular health measures: Chol, Total cholesterol≥240 mg/dL; HDL-C<50 mg/dL; Trig, Triglyceride≥150 mg/dL; SBP, Systolic BP≥135 mm Hg; Gluc, Glucose≥100 mg/dL; CRP, C-reactive protein≥3 mg/L; BMI≥30 kg/m2; RRS, Reynolds Risk Score≥20%. BMI indicates body mass index; Chol, total cholesterol; CI, confidence interval; CRP, C-reactive protein; Gluc, glucose; HDL-C, high-density lipoprotein cholesterol; MVPA, moderate-to-vigorous physical activity; OR, odds ratio; RRS, Reynolds Risk Score predicted 10-y CVD risk; PA, physical activity; SBP, systolic blood pressure; SPPB, short physical performance battery; Trig, triglyceride.
N
AL
RE
glucose homeostasis is consistent with our observations for both fasting insulin and glucose. Buman et al34 reported a significant inverse relationship between BMI and both low-and high light PA measured using a uniaxial accelerometer in 482 women aged>65 years. Again, a direct contrast of these findings with ours requires caution, given differences in the type of accelerometer; however, we also observed consistent inverse associations for both BMI and waist circumference with low- and high light PA. In our study, mean RRS scores and multivariable odds of clinically relevant RRS (≥20%) were significantly and inversely related with low- and high light PA, an impressive result given that the women studied here had, on average, a relatively low RRS (mean, 12.7%). Thefinding of a relationship between accelerometer-measured PA and predicted CVD risk aligns with a recent report from the LIFE Trial in which triaxial accelerometer vector magnitude counts (100–499 counts/min), marginally above threshold defining sedentary (<100), were associated with lower predicted CVD risk based on the Framingham score in ambulatory frail adults ages 70 to 89 who were without known CVD.16 Even after mutual adjustment for PA intensity, both low- and high light PA were significantly and inversely associated with RRS in the OPACH women, which suggests that PA of sufficient volume likely contributes to CVD risk factors independent of PA intensity. This important issue requires further clarification.
The cardiometabolic benefit of lighter intensity PA among older women seen in our study and others is consistent with cross-sectional findings reported in US adults 20 years and older who participated in the 2003 to 2006 National Health and Nutrition Examination Survey.18,35 Favorable age- and sex-adjusted associations were observed for uniaxial accelerometer-measured light intensity PA with BMI, waist, systolic blood pressure, triglyceride, HDL, CRP, and insulin, and generally were consistent for both low- and high light PA, defined by splitting at the midpoint the range of accelerom-eter counts for overall light PA.18 It is possible that these relationships with light intensity PA are, in part, why lower mortality risk was observed in relation to light PA in the National Health and Nutrition Examination Survey, interest-ingly with a greater benefit among women.36 Unlike in the OPACH study that is based on age-relevant calibrated accelerometer intensity cut points, it is unclear the extent to which the approach to defining low- and high light PA in the National Health and Nutrition Examination Survey study accurately reflects the phenotype across the wide age distribution of women and men studied. Notwithstanding, there is growing evidence that supports cardiometabolic and other health benefits in women and older adults at PA levels of lower intensity than currently recommended for public health.26Given the relatively high proportion of daily PA time spent in lower-intensity activities among women and older adults,16,36,37 if confirmed, these findings have important
implications for expanding public health recommendations on PA in an aging society.
The intriguing observations pertaining to light intensity PA and cardiometabolic risk factors among older women studied herein should not overshadow the other important result of
Figure. Age- and accelerometer wear-time adjusted Spearman correlations between Reynolds Risk Score and PA measures. MVPA indicates moderate-to-vigorous physical activity; PA, physical activity.
N
AL
RE
this study reinforcing recommendations that higher MVPA is associated with better CVD risk factors and predicted short-term CVD risk. In most instances, the strongest relationship among PA variables with CVD risk factors was with MVPA, which was statistically significant (few exceptions) even with adjustment for measured physical functioning. Each 30-minute/d increment in MVPA was, for example, associated with 34%, 14%, and 15% lower multivariable odds of clinically relevant levels of BMI, CRP, and RRS predicted CVD risk, respectively. These results should be interpreted with the caveat that the relatively older OPACH cohort had, on average, low CVD risk factors (except CRP, mean 3.6 mg/L) and lower 10-year predicted risk than what might be expected in a broader population of women similar in age and
race-ethnic distribution. Associations could be even stronger in older adults with more adverse CVD risk factors.
Numerous mechanisms support the plausibility of these cross-sectional results. Laboratory and clinical studies using animal and human models have documented a variety of acute and longer-term structural and functional responses to regular PA that improve both physical performance and chronic disease risk factors.38 The influence of even small amounts of low intensity PA on skeletal muscle fiber distribution and its metabolic attributes39,40 as well as on endothelial cell function41,42 seems particularly relevant at advanced ages and is responsive to lighter intensity PA.40,41 This may be an important context in which to consider the strongfindings supporting cardiometabolic benefit associated
Table 6. Multivariable Linear Regression of Reynolds Risk Score on Physical Activity With and Without Mutual Adjustment for Physical Activity Intensity (N=4832)
Without Mutual PA Adjustment With Mutual PA Adjustment
Physical Activity b 95% CI PValue b 95% CI PValue
All (N=4832)
Low light 0.624 0.800, 0.447 <0.001 0.339 0.574, 0.104 0.002
High light 1.218 1.512, 0.924 <0.001 0.726 1.079, 0.373 <0.001
Moderate-vigorous 0.858 1.155, 0.564 <0.001 0.459 0.753, 0.165 0.004
Age<80 y (N=2348)
Low light 0.351 0.527, 0.175 <0.001 0.210 0.436, 0.015 0.067
High light 0.738 1.032, 0.444 <0.001 0.288 0.669, 0.096 0.142
Moderate-vigorous 0.667 0.901, 0.431 <0.001 0.522 0.237, 0.807 <0.001
Age≥80 y (N=2484)
Low light 0.798 1.092, 0.504 <0.001 0.504 0.153, 0.858 0.005
High light 1.473 1.885, 1.061 <0.001 0.753 0.135, 1.368 0.02
Moderate-vigorous 1.281 0.059, 0.026 <0.001 0.741 0.123, 1.362 0.02
White (N=2535)
Low light 0.675 0.969, 0.381 <0.001 0.426 0.072, 0.132 0.009
High light 1.227 1.639, 0.815 <0.001 0.663 1.192, 0.134 0.02
Moderate-vigorous 0.873 1.285, 0.461 <0.001 0.537 0.949, 0.125 0.03
Black (N=1473)
Low light 0.684 0.978, 0.390 <0.001 0.240 0.534, 0.054 0.27
High light 1.455 1.925, 0.985 <0.001 1.101 1.807, 0.395 0.002
Moderate-vigorous 0.978 1.507, 0.449 <0.001 0.300 0.888, 0.288 0.35
Hispanic (N=824)
Low light 0.411 0.764, 0.058 0.017 0.315 0.668, 0.038 0.15
High light 0.615 1.085, 0.145 0.011 0.180 0.827, 0.467 0.63
Moderate-vigorous 0.495 0.965, 0.025 0.028 0.381 0.851, 0.089 0.15
Regression coefficient (b) is the mean difference in RRS for, on average, a 30-min/d greater time spent in physical activity. All models are adjusted for accelerometer awake wear time, age, race-ethnicity (except race-ethnic strata), education, alcohol, age at menopause, SPPB score, and BMI. Mutual adjustment refers to a model that simultaneously includes all 3 PA intensity variables.bindicates linear regression coefficient; BMI, body mass index; CI, confidence interval; PA, physical activity; RRS, Reynolds Risk Score; SPPB, short physical performance battery.
N
AL
RE
with low- and high light PA observed in the OPACH study. Recent evidence also points to a role for PA to stimulate microRNA responses that, in turn, may have cardiometabolic benefit with aging.43 Resistance exercise activities likely provide important skeletal muscle stimulus that improves functional and metabolic parameters in aging, independent of ambulatory aerobic activity.44,45However, such activity would not be measured well using hip-worn accelerometers; thus, its influence in the present study is unclear. A growing body of evidence indicates that the human response to both acute and chronic PA exposures is governed to some extent by the human genome,46 and there could be age-related genotypic variation in PA effects on cardiometabolic risk.47
A major strength of this investigation is use of a triaxial accelerometer to improve measurement sensitivity to activity patterns of lower intensity that are typical among older women.10,28 Additionally, the use of accelerometer count thresholds to define PA intensity levels determined in a laboratory calibration among women of similar age as those studied here28 is a major advance in large epidemiologic studies on PA and cardiometabolic risk. The vast majority of published accelerometer studies have utilized count cut points derived from the literature, often from studies that are not sex- or age specific to the target population.48Use of calibrated intensity cut points should reduce the amount of misclassification on intensity-specific PA levels (especially reducing underestimation of MVPA) and, thus, improve the accuracy and precision of estimated associations with CVD measures. Standardized blood collection, processing, storage, and bioassays enhance confidence in the CVD biomarker measurements and lower concern about misclassification when categorized into clinically relevant levels. The large samples size and availability of information on a variety of relevant covariables allowed for use of statistical procedures to control for potential confounding and stratification to understand whether primary study results applied within cohort subgroups defined by age and race-ethnicity.
Limitations include the cross-sectional study design, which precludes interpretation of results in a cause-related context. PA intensity, as examined herein, was defined on an absolute scale. However, because of the age-related decline in aerobic capacity,49 even lighter intensity activity defined on an absolute scale may, in fact, reflect a higher relative intensity for an older as compared with a younger adult. We were unable to evaluate relative PA intensity in OPACH, and its influence on CVD risk factors in older adults requires clarification. We only had available a single accelerometer measurement to define the PA exposure variables, though a recent study in older women suggests this probably reflects reasonably well PA habits over a 1- to 3-year period.50 Cumulative PA exposure determined by repeated accelerom-eter assessments, if a better representation of usual PA
patterns, could potentially enhance associations with CVD measures. Self-selection into the study group who returned accelerometers and who met minimum wear adherence for inclusion in the present analysis could be a concern. The proportion of returned accelerometers was remarkably high (95.3%) in as large a base cohort studied here. Compliance with accelerometer wear instructions was not perfect, though it too was exceptionally high (93% meeting definition of sufficient wear days) given the age group studied. Indeed, returned devices by mail and compliance with wear instruc-tions have been lower in other studies on accelerometer-measured PA in multiethnic older US adults.51OPACH women who did not return accelerometers or who did not meet minimum wear criteria tended to be slightly older, more racially-ethnically diverse, and had less favorable health characteristics than did those included in the present study. Because the number of women who did not return devices or who did not meet wear criteria was so small relative to the large study group herein, it is unlikely that the small differences in characteristics between women included and not included meaningfully influenced the results of the present analysis. Controlling for accelerometer wear time and limiting the present study to only women with at least 4 out of 7 days with 10 or more hours/d of wear reduces the extent to which results are influenced by variation in accelerometer wear among studied women, and are recom-mended procedures for studies on older adults.52 We were not able to control for use of specific medications that could be relevant to this analysis, such as antihypertensives, insulin sensitizers, or lipid-lowering agents. However, sensitivity analyses in which we excluded women who reported a history of diagnosed treated diabetes mellitus or hypertension produced results similar to our primary analysis, although residual confounding by medication use could still have been present. Subgroup analyses, particularly in Hispanic women, may have had limited statistical power, so this should be considered when interpreting those results. The strength of associations observed in the women studied here is likely constrained by their relatively low CVD risk factor levels and low RRS predicted 10-year CVD risk. Given the older ages of the women studied in OAPCH, the presentfindings could have been influenced to an extent by survivorship effect and thus likely do not extend to younger ages. Results from additional accelerometer studies in cohorts with a broader range of adult ages and more severe risk factor profiles would provide helpful context and clarification to the presentfindings.
In conclusion, in a large cohort of ambulatory community-dwelling older postmenopausal women enrolled in the OPACH study, accelerometer-measured light intensity PA as well as MVPA were associated with better CVD risk factor levels, with lower prevalence of clinically relevant risk factors, and with lower predicted 10-year CVD risk. Findings from our mutually
N
AL
RE
PA adjusted analysis suggest that light PA contributes to better CVD risk factor levels in addition to, and independent of, MVPA. This important finding, with substantial public health relevance, needs to be confirmed by other investiga-tors in longitudinal study designs. Notwithstanding, our results not only support current PA recommendations that encourage MVPA for control of modifiable CVD risk factors, but also suggest that in older adults even lighter intensity PA may confer meaningful risk factor benefit. The extent that
these observations extend to associations between
accelerometer-measured PA and CVD incidence needs to be determined and is a forthcoming investigation in the OPACH study.
Appendix
Short List of WHI Investigators
Program Office: (National Heart, Lung, and Blood Institute, Bethesda, Maryland).
Jacques Rossouw, Shari Ludlam, Dale Burwen, Joan McGowan, Leslie Ford, and Nancy Geller; Clinical Coordinating Center: (Fred Hutchinson Cancer Research Center, Seattle, WA) Garnet Anderson, Ross Prentice, Andrea LaCroix, and Charles Kooperberg; Investigators and Academic Centers: (Brigham and Women’s Hospital, Harvard Medical School, Boston, MA) JoAnn E. Manson; (MedStar Health Research Institute/Howard University, Washington, DC) Barbara V. Howard; (Stanford Prevention Research Center, Stanford, CA) Marcia L. Stefanick; (The Ohio State University, Columbus, OH) Rebecca Jackson; (University of Arizona, Tucson/Phoenix, AZ) Cynthia A. Thomson; (University at Buffalo, Buffalo, NY) Jean Wactawski-Wende; (University of Florida, Gainesville/ Jacksonville, FL) Marian Limacher; (University of Iowa, Iowa City/Davenport, IA) Robert Wallace; (University of Pittsburgh, Pittsburgh, PA) Lewis Kuller; (Wake Forest University School of Medicine, Winston-Salem, NC) Sally Shumaker.
Women’s Health Initiative Memory Study: (Wake Forest University School of Medicine, Winston-Salem, NC) Sally Shumaker.
For a full list of all the investigators who have contributed to WHI science, please visit: https://www.whi.org/researche rs/Documents%20%20Write%20a%20Paper/WHI%20Investi gator%20Long%20List.pdf.
Sources of Funding
The OPACH Study is funded by the National Heart, Lung, and Blood Institute, National Institutes of Health, U.S. Department of Health and Human Services through RO1 HL105065 (PI: LaCroix). WHI program is funded by the National Heart, Lung,
and Blood Institute, National Institutes of Health, U.S. Department of Health and Human Services through contracts HHSN268201600018C, HHSN268201600001C, HHSN2682
01600002C, HHSN268201600003C, and HHSN268201
600004C.
Disclosures
None.
References
1. Greenland P, Knoll MD, Stamler J, Neaton JD, Dyer AR, Garside DB, Wilson PW. Major risk factors as antecedents of fatal and nonfatal coronary heart disease events.JAMA. 2003;290:891–897.
2. Berry JD, Dyer A, Cai X, Garside DB, Ning H, Thomas A, Greenland P, Van Horn L, Tracy RP, Lloyd-Jones DM. Lifetime risks of cardiovascular disease.N Engl J Med. 2012;366:321–329.
3. Smith SC Jr, Jackson R, Pearson TA, Fuster V, Yusuf S, Faergeman O, Wood DA, Alderman M, Horgan J, Home P, Hunn M, Grundy SM. Principles for national and regional guidelines on cardiovascular disease prevention: a scientific statement from the World Heart and Stroke Forum. Circulation. 2004;109:3112–3121.
4. Lloyd-Jones DM, Hong Y, Labarthe D, Mozaffarian D, Appel LJ, Van Horn L, Greenlund K, Daniels S, Nichol G, Tomaselli GF, Arnett DK, Fonarow GC, Ho PM, Lauer MS, Masoudi FA, Robertson RM, Roger V, Schwamm LH, Sorlie P, Yancy CW, Rosamond WD; American Heart Association Strategic Planning Task F and Statistics C. Defining and setting national goals for cardiovascular health promotion and disease reduction: the American Heart Association’s strategic Impact Goal through 2020 and beyond.Circulation. 2010;121:586– 613.
5. Casas RS, Pettee Gabriel KK, Kriska AM, Kuller LH, Conroy MB. Association of leisure physical activity and sleep with cardiovascular risk factors in postmenopausal women.Menopause. 2012;19:413–419.
6. Hsieh SD, Yoshinaga H, Muto T, Sakurai Y. Regular physical activity and coronary risk factors in Japanese men.Circulation. 1998;97:661–665. 7. McAuley PA, Chen H, Lee DC, Artero EG, Bluemke DA, Burke GL. Physical
activity, measures of obesity, and cardiometabolic risk: the Multi-Ethnic Study of Atherosclerosis (MESA).J Phys Act Health. 2014;11:831–837.
8. Pettee Gabriel K, McClain JJ, Lee CD, Swan PD, Alvar BA, Mitros MR, Ainsworth BE. Evaluation of physical activity measures used in middle-aged women.Med Sci Sports Exerc. 2009;41:1403–1412.
9. Bonnefoy M, Normand S, Pachiaudi C, Lacour JR, Laville M, Kostka T. Simultaneous validation of ten physical activity questionnaires in older men: a doubly labeled water study.J Am Geriatr Soc. 2001;49:28–35.
10. LaCroix AZ, Rillamas-Sun E, Buchner D, Evenson KR, Di C, Lee IM, Marshall S, LaMonte MJ, Hunt J, Tinker LF, Stefanick M, Lewis CE, Bellettiere J, Herring AH. The Objective Physical Activity and Cardiovascular Disease Health in Older Women (OPACH) Study.BMC Public Health. 2017;17:192.
11. Troiano RP, Pettee Gabriel KK, Welk GJ, Owen N, Sternfeld B. Reported physical activity and sedentary behavior: why do you ask?J Phys Act Health. 2012;9(suppl 1):S68–S75.
12. Pettee Gabriel KK, Morrow JR Jr, Woolsey AL. Framework for physical activity as a complex and multidimensional behavior.J Phys Act Health. 2012;9(suppl 1):S11–S18.
13. Atienza AA, Moser RP, Perna F, Dodd K, Ballard-Barbash R, Troiano RP, Berrigan D. Self-reported and objectively measured activity related to biomarkers using NHANES.Med Sci Sports Exerc. 2011;43:815–821. 14. Barone Gibbs B, Pettee Gabriel K, Reis JP, Jakicic JM, Carnethon MR, Sternfeld
B. Cross-sectional and longitudinal associations between objectively measured sedentary time and metabolic disease: the Coronary Artery Risk Development in Young Adults (CARDIA) study.Diabetes Care. 2015;38:1835–1843. 15. Carson V, Wong SL, Winkler E, Healy GN, Colley RC, Tremblay MS. Patterns of
sedentary time and cardiometabolic risk among Canadian adults.Prev Med. 2014;65:23–27.
16. Fitzgerald JD, Johnson L, Hire DG, Ambrosius WT, Anton SD, Dodson JA, Marsh AP, McDermott MM, Nocera JR, Tudor-Locke C, White DK, Yank V, Pahor M, Manini TM, Buford TW; LIFE Study Research Group. Association of objectively measured physical activity with cardiovascular risk in mobility-limited older adults.J Am Heart Assoc. 2015;4:e001288. DOI: 10.1161/JAHA.114.001288.
N
AL
RE
17. Gando Y, Murakami H, Kawakami R, Tanaka N, Sanada K, Tabata I, Higuchi M, Miyachi M. Light-intensity physical activity is associated with insulin resistance in elderly Japanese women independent of moderate-to vigorous-intensity physical activity.J Phys Act Health. 2014;11:266–271.
18. Howard B, Winkler EA, Sethi P, Carson V, Ridgers ND, Salmon JO, Healy GN, Owen N, Dunstan DW. Associations of low- and high-intensity light activity with cardiometabolic biomarkers. Med Sci Sports Exerc. 2015;47:2093– 2101.
19. Jefferis BJ, Parsons TJ, Sartini C, Ash S, Lennon LT, Wannamethee SG, Lee IM, Whincup PH. Does duration of physical activity bouts matter for adiposity and metabolic syndrome? A cross-sectional study of older British men.Int J Behav Nutr Phys Act. 2016;13:36.
20. Lakoski SG, Kozlitina J. Ethnic differences in physical activity and metabolic risk: the Dallas Heart Study.Med Sci Sports Exerc. 2014;46:1124–1132. 21. Murabito JM, Pedley A, Massaro JM, Vasan RS, Esliger D, Blease SJ, Hoffman U,
Fox CS. Moderate-to-vigorous physical activity with accelerometry is associ-ated with visceral adipose tissue in adults. J Am Heart Assoc. 2015;4: e001379. DOI: 10.1161/JAHA.114.001379.
22. O’Donovan G, Hillsdon M, Ukoumunne OC, Stamatakis E, Hamer M. Objectively measured physical activity, cardiorespiratory fitness and car-diometabolic risk factors in the Health Survey for England. Prev Med. 2013;57:201–205.
23. Peterson MD, Al Snih S, Stoddard J, McClain J, Lee IM. Adiposity and insufficient MVPA predict cardiometabolic abnormalities in adults.Med Sci Sports Exerc. 2014;46:1133–1139.
24. Sandbakk SB, Nauman J, Zisko N, Sandbakk O, Aspvik NP, Stensvold D, Wisloff U. Sedentary time, cardiorespiratoryfitness, and cardiovascular risk factor clustering in older adults—the Generation 100 Study. Mayo Clin Proc. 2016;91:1525–1534.
25. Stamatakis E, Hamer M, Tilling K, Lawlor DA. Sedentary time in relation to cardio-metabolic risk factors: differential associations for self-report vs accelerometry in working age adults.Int J Epidemiol. 2012;41:1328–1337. 26. Fuzeki E, Engeroff T, Banzer W. Health benefits of light-intensity physical activity: a systematic review of accelerometer data of the National Health and Nutrition Examination Survey (NHANES).Sports Med. 2017; https://doi.org/ 10.1007/s40279-017-0724-0.
27. Anderson GL, Manson J, Wallace R, Lund B, Hall D, Davis S, Shumaker S, Wang CY, Stein E, Prentice RL. Implementation of the Women’s Health Initiative study design.Ann Epidemiol. 2003;13:S5–S17.
28. Evenson KR, Wen F, Herring AH, Di C, LaMonte MJ, Tinker LF, Lee IM, Rillamas-Sun E, LaCroix AZ, Buchner DM. Calibrating physical activity intensity for hip-worn accelerometry in women age 60 to 91 years: the Women’s Health Initiative OPACH Calibration Study.Prev Med Rep. 2015;2:750–756. 29. Rillamas-Sun E, Buchner DM, Di C, Evenson KR, LaCroix AZ. Development and
application of an automated algorithm to identify a window of consecutive days of accelerometer wear for large-scale studies. BMC Res Notes. 2015;8:270.
30. Choi L, Ward SC, Schnelle JF, Buchowski MS. Assessment of wear/nonwear time classification algorithms for triaxial accelerometer.Med Sci Sports Exerc. 2012;44:2009–2016.
31. Cook NR, Paynter NP, Eaton CB, Manson JE, Martin LW, Robinson JG, Rossouw JE, Wassertheil-Smoller S, Ridker PM. Comparison of the Framingham and Reynolds Risk scores for global cardiovascular risk prediction in the multiethnic Women’s Health Initiative. Circulation. 2012;125:1748–1756, S1–11.
32. Expert Panel on the Detection, Evaluation, and Treatment of High Blood Cholesterol in Adults. Executive Summary of The Third Report of The National Cholesterol Education Program (NCEP) Expert Panel on Detection, Evaluation, And Treatment of High Blood Cholesterol In Adults (Adult Treatment Panel III).
JAMA. 2001;285:2486–2497.
33. Pearson TA, Mensah GA, Alexander RW, Anderson JL, Cannon RO III, Criqui M, Fadl YY, Fortmann SP, Hong Y, Myers GL, Rifai N, Smith SC Jr, Taubert K, Tracy RP, Vinicor F. Markers of inflammation and cardiovascular disease: application to clinical and public health practice: a statement for healthcare professionals from the Centers for Disease Control and Prevention and the American Heart Association.Circulation. 2003;107:499–511.
34. Buman MP, Hekler EB, Haskell WL, Pruitt L, Conway TL, Cain KL, Sallis JF, Saelens BE, Frank LD, King AC. Objective light-intensity physical activity associations with rated health in older adults.Am J Epidemiol. 2010;172:1155–1165. 35. Camhi SM, Sisson SB, Johnson WD, Katzmarzyk PT, Tudor-Locke C.
Accelerometer-determined moderate intensity lifestyle activity and car-diometabolic health.Prev Med. 2011;52:358–360.
36. Matthews CE, Keadle SK, Troiano RP, Kahle L, Koster A, Brychta R, Van Domelen D, Caserotti P, Chen KY, Harris TB, Berrigan D. Accelerometer-measured dose-response for physical activity, sedentary time, and mortality in US adults.Am J Clin Nutr. 2016;104:1424–1432.
37. Keadle SK, Shiroma EJ, Freedson PS, Lee IM. Impact of accelerometer data processing decisions on the sample size, wear time and physical activity level of a large cohort study.BMC Public Health. 2014;14:1210.
38. Chodzko-Zajko WJ, Proctor DN, Fiatarone-Singh MA, Minson CT, Nigg CR, Salem JG, Skinner JS. American College of Sports Medicine Position Stand: Exercise and physical activity for older adults. Med Sci Sports Exerc. 2009;414:1510–1530.
39. Frontera WR, Reid KF, Phillips EM, Krivickas LS, Hughes VA, Roubenoff R, Fielding RA. Musclefiber size and function in elderly humans: a longitudinal study.J Appl Physiol (1985). 2008;105:637–642.
40. Tikkanen O, Haakana P, Pesola AJ, Hakkinen K, Rantalainen T, Havu M, Pullinen T, Finni T. Muscle activity and inactivity periods during normal daily life.PLoS One. 2013;8:e52228.
41. Merino J, Ferre R, Girona J, Aguas D, Cabre A, Plana N, Vinuesa A, Ibarretxe D, Basora J, Buixadera C, Masana L. Even low physical activity levels improve vascular function in overweight and obese postmenopausal women.
Menopause. 2013;20:1036–1042.
42. Seals DR, Desouza CA, Donato AJ, Tanaka H. Habitual exercise and arterial aging.J Appl Physiol (1985). 2008;105:1323–1332.
43. McCarthy JJ. microRNA and skeletal muscle function: novel potential roles in exercise, diseases, and aging.Front Physiol. 2014;5:290.
44. Abbatecola AM, Ferrucci L, Ceda G, Russo CR, Lauretani F, Bandinelli S, Barbieri M, Valenti G, Paolisso G. Insulin resistance and muscle strength in older persons.J Gerontol A Biol Sci Med Sci. 2005;60:1278–1282. 45. Newman AB, Kupelian V, Visser M, Simonsick EM, Goodpaster BH, Kritchevsky
SB, Tylavsky FA, Rubin SM, Harris TB. Strength, but not muscle mass, is associated with mortality in the health, aging and body composition study cohort.J Gerontol A Biol Sci Med Sci. 2006;61:72–77.
46. Sarzynski MA, Loos RJ, Lucia A, Perusse L, Roth SM, Wolfarth B, Rankinen T, Bouchard C. Advances in exercise, fitness, and performance genomics in 2015.Med Sci Sports Exerc. 2016;48:1906–1916.
47. Pereira DS, Mateo EC, de Queiroz BZ, Assumpcao AM, Miranda AS, Felicio DC, Rocha NP, da Cruz dos Anjos DM, Pereira DA, Teixeira AL, Pereira LS. TNF-alpha, IL6, and IL10 polymorphisms and the effect of physical exercise on inflammatory parameters and physical performance in elderly women. Age (Dordr). 2013;35:2455–2463.
48. Wijndaele K, Westgate K, Stephens SK, Blair SN, Bull FC, Chastin SF, Dunstan DW, Ekelund U, Esliger DW, Freedson PS, Granat MH, Matthews CE, Owen N, Rowlands AV, Sherar LB, Tremblay MS, Troiano RP, Brage S, Healy GN. Utilization and harmonization of adult accelerometry data: review and expert consensus.Med Sci Sports Exerc. 2015;47:2129–2139.
49. Fleg JL, Morrell CH, Bos AG, Brant LJ, Talbot LA, Wright JG, Lakatta EG. Accelerated longitudinal decline of aerobic capacity in healthy older adults.
Circulation. 2005;112:674–682.
50. Keadle SK, Shiroma EJ, Kamada M, Matthews CE, Harris TB, Lee IM. Reproducibility of accelerometer-assessed physical activity and sedentary time.Am J Prev Med. 2017;52:541–548.
51. Howard VJ, Rhodes JD, Mosher A, Hutto B, Stewart MS, Colabianchi N, Vena JE, Blair SN, Hooker SP. Obtaining accelerometer data in a national cohort of black and white adults.Med Sci Sports Exerc. 2015;47:1531–1537. 52. Migueles JH, Cadenas-Sanchez C, Ekelund U, Delisle Nystrom C,
Mora-Gonzalez J, Lof M, Labayen I, Ruiz JR, Ortega FB. Accelerometer data collection and processing criteria to assess physical activity and other outcomes: a systematic review and practical considerations. Sports Med. 2017; doi: https://doi.org/10.1007/s40279-017-0716-0.
N
AL
RE