CHARACTERIZATION OF AMINO ACID AND PEPTIDE RADICALS
AND RADICAL CATIONS AND THEIR USE AS PROBES FOR THE
AQUEOUS MICROENVIRONMENT
Ryan Coleman White
A dissertation submitted to the faculty of the University of North Carolina at Chapel Hill in
partial fulfillment of the requirements of the degree of Doctor of Philosophy in the
Department of Chemistry.
Chapel Hill
2006
Approved by:
Malcolm D. E. Forbes
Marcey L. Waters
© 2006
ABSTRACT Ryan Coleman White
Characterization of Amino Acid and Peptide Radicals and Radical Cations and Their Use as Probes for the Aqueous Microenvironment
(Under the Direction of Malcolm D. E. Forbes)
Amino acid radicals and radical cations formed through oxidation are characterized
by Time-resolved Electron Paramagnetic Resonance (TREPR) spectroscopy. These
oxidation processes occur through single-electron transfer events to excited triplet state
anthraquinone photo-sensitizers, and by hydrogen atom transfer to hydroxyl radicals created
in situ. The identity of the radicals formed by electron transfer is strongly dependent on the
pH of the solution. In particular, a previously hypothesized cyclic methionine radical cation
structure is directly observed on the sub-microsecond timescale. The uncharged carbon
radicals formed by hydroxyl attack in oxygenated environments are found to form peroxyl
adducts with molecular oxygen. The structures of these radicals are deduced by computer
simulation of magnetic parameters. The radical intermediates created upon oxidation of
diglycine by anthraquinone photosensitizers are used as probes for microscopic water pools
formed in reverse micelles. A new “micro-reactor” model is used to simulate the chemically
induced dynamic electron polarization of the TREPR radical signals. Radical diffusion
coefficients are generated from these simulations from which the viscosities of the water
pools can be calculated. Also, radicals formed from direct oxidation of the reverse micelle
ACKNOWLEDGEMENTS
TABLE OF CONTENTS
Page
LIST OF TABLES AND GRAPHS ... viii
LIST OF FIGURES ... ix
LIST OF SCHEMES... xii
LIST OF CHARTS ... xiii
LIST OF ABBREVIATIONS AND SYMBOLS ... xiv
I. INTRODUCTION ...1
1.1 General Introduction ...1
1.2 Experimental Overview of TREPR ...5
1.3 CIDEP ...7
1.4 Photo-sensitizers for TREPR ...15
1.4.1 Anthraquinone Sulfonate Sodium Salts...15
1.4.2 Hydrogen Peroxide ...17
II. METHIONINE RADICAL CATION...21
2.1 Introduction...22
2.2 Background ...22
2.3 Results and Discussion ...28
2.3.2 The pH Dependent Formation of Radicals from
N-acetyl-L-Methionine Analogs...36
2.3.3 Polarization Transfer to the Aminyl Radical ...50
2.4 Conclusions and Outlook...59
2.5 Experimental...60
III. AMINO ACID AND PEPTIDE RADICALS FORMED BY ONE-ELECTRON OXIDATION...63
3.1 Introduction...64
3.2 Results and Discussion ...66
3.2.1 pH Dependent Oxidation of N-acetylglycine and Diglycine Analogs ...66
3.3 Conclusions...72
3.4 Experimental...72
IV. AMINO ACID AND PEPTIDE CARBON AND PEROXYL RADICALS FORMED BY H-ABSTRACTION BY HYDROXYL RADICAL…...75
4.1 Introduction...76
4.2 Results and Discussion ...79
4.2.1 Studies of Carbon Radicals Formed in De-oxygenated Solutions...79
4.2.2 Studies of Peroxyl Radicals Formed in Oxygen Saturated Solutions...89
4.3 Conclusions...100
4.4 Experimental...100
V. PEPTIDE RADICALS AS PROBES FOR THE AQUEOUS MICROENVIRONMENT ...103
5.1 Introduction...104
5.3 Micro-reactor Model...109
5.4 Results and Discussion ...112
5.4.1 Reverse Micelle Parameters...112
5.4.2 Time Dependence ...113
5.4.3 AQS vs. AQDS ...117
5.4.4 Reverse Micelle Size Dependence...120
5.4.5 Temperature Dependence ...123
5.4.6 Simulation of TREPR Spectra and Extraction of D Values ...123
5.5 Conclusions...129
5.6 Experimental...129
VI. TREPR AND CIDNP STUDIES OF THE OXIDATION OF AOT ...131
6.1 Introduction...132
6.2 Results and Discussion ...139
6.2.1 TREPR Spectra at Room Temperature ...139
6.2.2 CIDNP Studies...145
6.2.3 Summary of Radical Structures ...154
6.2.4 TREPR Time Dependence...156
6.2.5 Reverse Micelle Size Dependence...156
6.2.6 Temperature Dependence ...161
6.3 Conclusions...162
6.4 Experimental...162
LIST OF TABLES AND GRAPHS
Table 2.1: All observed Met+• structures and magnetic parameters obtained from
computer simulation...30
Table 3.1: All observed glycine derivative radical structures and magnetic parameters obtained from computer simulation...73
Table 4.1: Carbon-centered radicals and magnetic parameters obtained from computer simulation...82
Table 4.2: Peroxyl adduct structures and magnetic parameters obtained from computer simulation...94
Table 5.1: Diffusion coefficients in different Size RM’s ...127
Graph 5.1: Diffusion coefficients as a function of RM size ...128
LIST OF FIGURES
(all TREPR spectra are at X-band microwave frequency and shown with simulations unless otherwise noted)
Figure 1.1: Neurotoxicity in the presence of various Amyloid β peptides...3
Figure 1.2: TREPR timing sequence ...8
Figure 1.3: Triplet Mechanism ...9
Figure 1.4: Radical Pair Mechanism...11
Figure 1.5: CFN model of SCRP ...14
Figure 2.1: Time dependence of X-band TREPR spectra taken after irradiation of AQS and L-methionine in aqueous solution at pH 2.0...29
Figure 2.2: pH dependence of TREPR spectra taken after irradiation of an aqueous solution of AQS and L-methionine...32
Figure 2.3: TREPR spectra taken after irradiation of AQS and L-methionine in H2O and D2O at high pH/pD...35
Figure 2.4: pH dependence of TREPR spectra taken after irradiation of an aqueous solution of AQS and NAM ...39
Figure 2.5: TREPR spectra taken after irradiation of AQS and NAM in H2O and D2O at low pH/pD...40
Figure 2.6: TREPR spectra taken after irradiation of AQS and NAM in H2O and D2O at high pH/pD...43
Figure 2.7: High pH TREPR spectra taken after irradiation of AQS and A) NAM and B) NAM-d3 in H2O...44
Figure 2.8: Q-band TREPR spectra taken after irradiation of AQS and NAM in H2O at different pH values ...46
Figure 2.9: Aminyl radical spectrum with various TM/RPM simulations ...52
Figure 2.10: X- and Q-band aminyl radical TREPR spectra ...53
Figure 2.12: TREPR spectrum and simulation for aminyl radical...58
Figure 3.1: pH dependent TREPR spectra taken after irradiation of AQS and
GG in H2O...67
Figure 3.2: High pH/pD TREPR spectra taken after irradiation of AQS and
GG in H2O and D2O...70
Figure 3.3: TREPR spectra taken after irradiation of solutions of NAG, NAG-13C,
NAG-d3, and L-Ala-gly in the presence of AQS ...71
Figure 4.1: TREPR spectrum taken after irradiation of H2O2 and GG in
deoxygenated aqueous solution ...80
Figure 4.2: Generation of observed spectrum from the superposition of spectra
from 2 F-pairs ...85
Figure 4.3: TREPR spectra taken after photolysis of H2O2 with alanine
and valine in deoxygenated aqueous solution...87
Figure 4.4: TREPR spectrum taken after photolysis of H2O2 with serine and
threonine in deoxygenated aqueous solution ...88
Figure 4.5: TREPR spectrum taken after photolysis of H2O2 with methionine in
deoxygenated aqueous solution ...91
Figure 4.6: TREPR spectra taken after photolysis of H2O2 with L-methionine-13C(2)
and L-methionine-d3 in deoxygenated aqueous solution...92
Figure 4.7: TREPR spectra taken upon photolysis of H2O2 with NAG and
NAG-d2 in oxygen-saturated aqueous solution...95
Figure 4.8: TREPR spectra taken upon photolysis of H2O2 with serine and GG in
oxygen-saturated solution aqueous solution ...97
Figure 4.9: Time dependence of TREPR spectra taken upon irradiation of H2O2
and serine in oxygen-saturated solution...99
Figure 5.1: Time dependent TREPR spectra taken upon irradiation of AQDS and
GG inside an RM water pool ...114
Figure 5.2: TREPR spectra taken after irradiation of AQDS/GG and AQS/GG
Figure 5.3: TREPR spectra taken after irradiation of AQDS/GG inside RM’s
of different sizes...122
Figure 5.4: TREPR spectra taken after irradiation of AQDS/GG inside of an RM
obtained at different temperatures ...124
Figure 5.5: Simulations obtained using the micro-reactor model for TREPR spectra taken after irradiation of AQDS/GG on the interior or RM’s
of different sizes...125
Figure 6.1: TREPR spectrum taken after irradiation of AQDS inside of a RM
with an Rc = 30 Å...140
Figure 6.2: TREPR spectrum with same parameters as in Figure 6.1, with a
50 G sw and slower field sweep ...141
Figure 6.3: Same as Figure 6.2, but with 20 G sw...143
Figure 6.4: NMR and CIDNP spectra taken before and after irradiation of
AQDS inside of AOT RM’s ...147
Figure 6.5: CIDNP signals attributed to AOT reformation ...151
Figure 6.6: TREPR spectrum and simulation of AOT radicals formed by
oxidation by 3AQDS* ...155 Figure 6.7: Time dependent TREPR spectra taken after irradiation of
AQDS inside AOT RM’s...157
Figure 6.8: TREPR spectra taken after irradiation of AQDS inside of
AOT RM’s of different sizes ...158
Figure 6.9: Temperature dependence of TREPR spectra taken after irradiation
LIST OF SCHEMES
Scheme 1.1: AQ(D)S photo-oxidation chemistry...16
Scheme 1.2: Photolysis of H2O2 to produce hydroxyl radicals and H-atom transfer from substrate ...20
Scheme 2.1: One-electron oxidation of methionine and NAM ...23
Scheme 2.2: Suggested one-electron oxidation pathways for methionine ...25
Scheme 2.3: Simplified NAM one-electron oxidation reaction scheme at different pH values...38
Scheme 3.1: Possible one-electron oxidation pathways for NAG and GG ...65
Scheme 4.1: General peroxylation mechanism of amino acid residues at the side-chain and backbone of peptides ...78
Scheme 4.2: Formation of F-pairs from •OH and substrate ...83
Scheme 4.3: Thermal oxidation of methionine by H2O2 and subsequent addition of hydroxyl radical...90
Scheme 4.4: Summary of peroxylation of NAG, serine, and diglycine ...101
Scheme 5.1: Diagram of an AOT reverse micelle ...106
Scheme 5.2: Oxidation of GG by AQDS to form α-amidomethylene radical ...108
Scheme 5.3: Possible AOT radicals created upon oxidation by 3AQDS*...119
Scheme 6.1: Possible oxidation and photolytic pathways of AOT...136
Scheme 6.2: Desulfonation of AOT...146
LIST OF CHARTS
Chart 1.1: AQ(D)S radical structures at different pH values...19
Chart 2.1: Isotopically labeled cyclic radical cations formed from the oxidation of NAM analogs...42
Chart 2.2: R-N-H and R-S-N-H nitrogen hyperfine coupling constant comparison ...51
Chart 2.3: Deprotonation of amine radical cation to aminyl radical...55
LIST OF ABBREVIATIONS AND SYMBOLS
Abbreviations
A absorptive TREPR transition
AOT Aerosol OT
AQDS 2,6-anthraquinone disulfonate sodium salt
AQS 2-anthraquinone sulfonate sodium salt
APS anti-phase structure
CIDEP chemically induced dynamic electron polarization
CIDNP chemically induced dynamic nuclear polarization
CW continuous wave
E emissive TREPR transition
E/A combination of low field emissive and high field absorptive TREPR
transitions
E/A* combination of low field emissive and high field enhanced absorptive
TREPR transitions
E*/A combination of low field enhanced emissive and high field absorptive
TREPR transitions
EPR electron paramagnetic resonance
FT Fourier transform
G Gauss
GG diglycine
ISC intersystem crossing
MeOH methanol
Met+• methionine radical cation
NAG N-acetylglycine
NAG-d3 N-acetyl-d3-glycine
NAG-13C N-acetylglycine-13C(2)
NAM N-acetyl-L-methionine
NAM-d3 N-acetyl-L-methionine-(methyl-d3)
NMR nuclear magnetic resonance
RM reverse micelle
RP radical pair
RPM radical pair mechanism
SCRP spin correlated radical pair (mechanism)
SDS sodium dodecyl sulfate
S/N signal to noise ratio
sw sweep width
SSEPR steady state electron paramagnetic resonance
TM triplet mechanism
TREPR time-resolved electron paramagnetic resonance
Symbols
aH hyperfine coupling constant
B0 applied magnetic field
D diffusion coefficient
g isotropic electronic g-factor
∆g difference in g-factors in a radical pair
h Planck’s constant
H Hamiltonian operator
I nuclear spin angular momentum operator
J Heisenberg spin exchange parameter
J0 J at r0
kb Boltzmann constant
kre re-encounter rate constant
r0 distance of closest approach of two radical centers
Rc RM water pool radius
S electron spin angular momentum operator
T1 spin-lattice relaxation time
T2 spin-spin relaxation time
β Bohr magneton
λ fall off parameter
ω0 spectrometer frequency
Ψ wave function
CHAPTER I
1.1 General Introduction
The oxidation of biologically relevant molecules such as proteins, DNA, and lipids
has become an important topic of interest with regards to cellular function and disease.
While the controlled oxidation of substrates occurs in a myriad of enzymatic processes and is
necessary for life, uncontrolled oxidation can degrade these biological substrates, causing
cellular malfunction and death. These uncontrolled oxidative processes are also thought to
be the major pathways through which cells age. Of the three general classes of molecules
listed above, proteins make up a vast majority of the cellular bulk (50-60 % of the dry weight
of the cell,1 and hence react the most often with oxidative species en vivo. To determine the origins of disease and aging it is important to understand the specific pathways of oxidation
of proteins by all the various oxidants present within the cell.
The random oxidation events that occur with proteins often leads to aggregation or
condensation of proteins that eventually lead to a number of serious disease states including
Alzheimer’s Disease,2-4 as well as cataractogenesis5 and glaucoma formation6. To
investigate the root causes of these diseases, scientists have focused in on side- and
main-chain oxidation of individual amino acid residues. For example, there is considerable
evidence linking the oxidation of a single methionine-35 residue on the αβ-amyloid protein
located in human brain cells to the formation of Alzheimer ’s disease plaques. Figure 1.1
shows cell toxicity studies performed by Varadarajan et al.7 in which the Met-35 residue was replaced in the protein sequence by structurally similar norleucine or valine via site directed
mutagenesis. It shows that in the native full sequence protein Aβ(1-40) and protein
fragments Aβ(25-35) containing Met-35, the levels of neuronal survival are much less than in
Figure 1.1: Neurotoxicity in the presence of various Amyloid β peptides. (Figure taken
methionine residue as a key player in the mechanism of plaque formation, the primary
chemical steps that occur are not known. In addition to protein aggregation, oxidative
chemical reactions can lead to protein degradation8 and loss of enzymatic activity and structure9.
To understand the exact mechanisms of protein oxidation, extensive studies have
been performed on smaller peptides, and amino acid model systems. Kinetics of these types
of reactions have been investigated using pulse radiolysis and transient absorption techniques.
As these types of reactions occur initially through radical intermediates, electron
paramagnetic resonance (EPR) has yielded excellent structural information allowing for
characterization of these species. Product analysis is also a useful tool by which to infer the
exact mechanisms of oxidation.
While these experiments yield a wealth of information on radical reaction kinetics,
radical structure, and products, there are some inherent drawbacks to these techniques that
should be noted. For instance, due to the low resolution of transient optical spectra it is often
difficult to link the broad featureless signals precisely to a unique intermediate. Although
Steady-state EPR (SSEPR) techniques can be used to observe steady-state concentrations of
radicals, the slow time response of the experiment (> 40 µs) means that any primary radicals
that may be formed are undetectable. Product analysis also does not give direct evidence for
the primary oxidation steps that occur in radical reactions.
Often described as a cross between laser flash photolysis and EPR, Time-resolved
EPR (TREPR)10 has been developed to observe radicals on the sub-microsecond timescale.
This experiment allows for the observation of amino acid radical substrates that have
can be obtained by analysis of the hyperfine splitting patterns, the phase and intensities of
TREPR transitions give important information about radical precursors that aid in the
elucidation of mechanism.
This dissertation describes the utilization of TREPR to structurally characterize the
radicals and radical cations created upon oxidation of amino acids and peptides by both
triplet photo-sensitizers and hydroxyl radicals in aqueous solution. The radical species
presented here have not been previously observed and provide insight into key mechanisms
of oxidation of biologically relevant species. To mimic the enclosed cellular environment,
these reactions have also been used to generate radical ions within the aqeuous interior of
reverse micelles (RM). By using the micro-reactor model to simulate the TREPR spectra
taken upon photooxidation of these species in these water pools, information about radical
diffusion can be obtained. This RM project represents the convergence of two different areas
of EPR research: the photooxidation of amino acids and peptides and diffusion of radical
pairs. Over the course of these investigations of oxidation in the interior of RM’s it was also
found that considerable photo-oxidation of the surfactant occurs. The resulting radicals are
characterized here for the first time using both TREPR and the use of chemically induced
dynamic nuclear polarization (CIDNP).
1.2 Experimental Overview of TREPR
Over the past 60 years, SSEPR has arisen as the most popular way to unambiguously
characterize radical structure. The spectral transitions observed in EPR for unpaired
electrons are directly analogous to nuclear magnetic resonance (NMR) for spin active
When unpaired electrons are put in an external magnetic field B0, the β spin state goes down
in energy while the α state energy increases. The difference in energy between the two states
is known as the Zeeman splitting. The absolute position of the signal with respect to the B0
field is deterimined by the radical’s g-factor (analogous to the chemical shift for NMR).
While the g-factor is unique to each different radical, it is approximately 2.0030 for most
organic radicals. Like the J coupling in NMR, the electron can couple to other near-by spin
active nuclei via hyperfine coupling. It does this via hyperfine coupling. The magnitude of
the hyperfine interactions (aH) vary according to nucleus type and proximity to the unpaired
electron. They are extrememly useful in determining radical structure. To generate spin
transitions, excitation with microwave frequency, normally ~ 9.5 GHz (known as X-band),
electromagnetic radiation is supplied by a microwave generator into a resonant cavity in
which the sample is placed. In SSEPR, a 100 kHz magnetic field modulation is used to lock
in the microwave frequency. While this greatly increases the signal to noise ratio (S/N), it
limits the time resolution of these types of experiments to > 40 µs. The TREPR experiment
does not utilize this field modulation, and therefore benefits from much faster time response
(up to 60 ns). Without field modulation the signal to noise ratio (S/N) is lower in comparison
to SSEPR techniques. However, this is compensated for by chemically induced dynamic
electron polarization (CIDEP) mechanisms that populate spin states with non-Boltzmann
distributions. This means that TREPR transitions can be both absorptive and emissive.
These polarization mechanisms will be elaborated upon in the next section. On a fast
timescale, there is also an appreciable difference from SSEPR spectra. Smaller hyperfine
broadening on timescales faster than the Larmour frequency of the nucleus. Only after this
time delay can hyperfine couplings below this limit be resolved.
In the continuous wave (CW) TREPR experiment, radicals are initially created by a
pulse of UV laser light of 5 to 20 ns in duration. The TREPR signal is detected using a gated
boxcar signal averager. The boxcar samples the signal from the microwave bridge before
(dark gate) and after (light gate) the laser flash, then subtracts the two signals and then
outputs the difference to the computer (see Figure 1.2). The width of the two gates are
normally 100-300 ns depending on the desired time resolution. Additionally, the radical time
profile can be collected at each field point during the sweep, and then the field dependent
spectrum can be constructed afterwards.
Unlike other magnetic resonance techniqes such as NMR or SSEPR, the signals
observed via TREPR do not represent a normal Boltzmann distribution of spin states induced
by the magnetic field, and are therefore not always absorptive. Rather, the TREPR signals
can have both emissive and absorptive character due to non-Boltzmann population of spin
states created by CIDEP mechanisms which will be described in further detail in the next
section.
1.3 CIDEP
There are three well established CIDEP mechanisms that will be important to the
interpretation of the spectra presented in this thesis: 1) Triplet Mechanism11 (TM), 2) Radical
Pair Mechanism12 (RPM), and 3) Spin-Correlated Radical Pair Mechanism13 (SCRP). A qualitative description of the TM spin polarization process is depicted in Figure 1.3. For
Figure 1.3: The Triplet Mechanism
T
xT
yT
zT
-ββ
T
+(
αα
)
T
0α
α
α
α
β
β
β
β
S
0 S1Rxn
β
β
β
β
α
α
α
α
T1 in the
Molecular Frame
T1 in
the Lab Frame
process (ISC)) is anisotropic, and the result is preferential population of the zero-field triplet
states. This polarization is transferred to the laboratory frame (T- (ββ), T+ (αα), and T0 ((αβ
+ βα)/√2) spin states), and then to the product radicals. In Figure 1.3, for example, the T
-(αα) state is selectively populated. It generates radicals in the α spin state and therefore
emissive TREPR transitions are observed. In general, TM can generate net emissive (E) or
net absorptive (A) transitions depending on the symmetry of the triplet precursor (the sign of
the zero field splitting) and the solvent environment. Viscous sovents tend to favor the
production of TM polarization as it allows more distinction between Tx, Ty, and Tz during
ISC.
The RPM polarization is generated by S-T0 mixing as the radicals re-encounter in
solution. Initially upon creation, radicals are close together and the magnitude of the
Heisenberg spin exchange interaction (J) is high. The two unpaired electrons undergo spin
exchange, or J coupling, and are essentially locked into either a singlet ((αβ-βα)/√2) or T0
spin state. The magnitude of this J coupling is dependent upon inter-radical distance. Figure
1.4 shows a qualitative picture of the distance dependence of J. As the radicals diffuse apart,
the value of J diminishes, and the mixing of spin states based on g-factor and hyperfine
coupling differences occurs. As the radicals re-approach and diffuse apart continously, the
S-T0 mixing process effectively depletes the population of a given spin state. As the radicals
diffuse towards infinite dilution, the result is an over- or under-population of spin states that
are detected. For a two radicals (R1 and R2) (gR1 > gR2) generated from a triplet precursor, R1
will E and while the R2 transitions will be A. For radicals generated from a singlet precursor,
spectroscopic observation, already diffused far enough away so that they can be considered
true doublet states where J = 0.
If the radicals are observed while J ≠ 0 this S-T0 mixing process results in a different
polarization mechanism known as SCRP. SCRP occurs when radicals are confined to a
limited space in which the spin states of the radical pair are described in the triplet basis.
This theory was first presented by Closs et al.13 to explain the spectra generated from radicals confined within sodium dodecyl sulfate (SDS) micelles and non-conjugated biradicals
connected with alkyl chain tethers. Figure 1.5 qualitatively outlines the process by which the
spin levels are populated. As applied to the molecular systems described in this dissertation,
the radical pair is intially generated from a triplet state precursor, thereby populating the T+,
T-, and T0 levels equally while leaving the singlet state unpopulated. At distances in which J
~ aH or ∆g, S-T0 mixing occurs in which new wavefunctions, Ψ2 and Ψ3, are created. The Ψ2
and Ψ3 develop directly from the S and T0 states, respectively. These new wave functions
get depopulated by chemical reaction to form diamagnetic products resulting in a greater spin
population in the T+ and T- states. The spectral transitions for such a radical pair are shown
in Figure 1.5 and are known as anti-phase structure (APS). The appropriate Spin
Hamiltonian for this 2 spin system is shown in equation 1.1.
∑
∑
⋅ ⋅ + ⋅ ⋅ + ⋅ + − + = j j i i a a J g g B hH 0 1S1z 2S2z S1z S2z) 1 S1z I1i 2 S2z I2j
2 1 ( ) (
2π β (1.1)
The bold symbols refer to the spin angular momentum operators (S for electrons, I for
between the singlet and triplet levels at zero applied magnetic field. The third term
represents the electron-nuclear hyperfine interactions. As seen in Figure 1.5, each line that
would correspond to the single transition attributed to the mono-radical turns into an E/A or
A/E doublet dependent on whether J is positive or negative, respectively. In recent years,
there have been improvements to SCRP theory with regard to diffusion and the distance
dependence of J. This will be discussed in more detail in Chapter 5 as a means to simulate
TREPR data acquired for radical pairs in reverse micelles (RM).
The phases of transitions are determined by the CIDEP mechanism, which is in turn
dependent on the identity of the radical pair (RP). Once a RP is produced, three different
processes can occur. A singlet born RP can recombine to form diamagnetic products. If the
RP has triplet character, recombination is not allowed and the radicals are considered a
geminate pair. On the timescale of the TREPR experiment, geminate RP’s are only observed
in very special situations, like inside of micro-environments. In bulk solution, after ~1 ns the
geminate radicals have escaped and diffused completely away from each other. The radicals
are then free to interact with other radicals in solution, to form Free or Random Pairs
(F-pairs). Geminate radicals with triplet character are most likely to escape to form F-pairs.
Therefore, the F-pairs are formed with a majority of triplet character. The radicals observed
by TREPR will be polarized by RPM and will exhibit E/A character. This concept will be
Figure 1.5: The CFN Model of SCRP R1• R2•
gββββB0
-gββββB0
A/4 -A/4 -2J T+ T0 S T-
T
+T
-Ψ
Ψ
Ψ
Ψ
3333Ψ
Ψ
Ψ
Ψ
22222
ω
ω
ω
ω
Before After
Triplet State
Precursor
EPR Transitions
1.4 Photo-sensitizers for TREPR 1.4.1 Anthraquinone Sulfonate Salts
In this dissertation, water-soluble anthraquinone sulfonate salts,
anthraquinone-2-sulfonate (AQS) and anthraquinone-2,6-dianthraquinone-2-sulfonate (AQDS) are the main photo-sensitizers
that are utilized for the production of spin polarized radicals and radical cations. These
anthraquinone species allow for the production of these radicals in high yield in aqueous
solutions over a wide pH range. Excitation of AQ(D)S at 308 nm (XeCl excimer laser) leads
cleanly and quickly to triplet excited states which are quenched by good electron donors.
AQS and AQDS are excellent sensitizers for this chemistry, with a high extinction coefficient
at 308 nm, a high quantum yield for formation of the triplet, and both triplet states are
excellent electron acceptors.14 Scheme 1.1 shows the structures of AQ(D)S as well as the general oxidation scheme observed. Photo-excited anthraquinones also produce intense
triplet mechanism spin polarization15 in the inter–system crossing process, which leads to good signal-to-noise ratios in our experiment (as discussed above). An additional advantage
of these sensitizers is that their radical anions AQS-•, and AQDS-•, have very small hyperfine
couplings and in almost all of our experiments appears as a single sharp line. Therefore these
radicals do not interfere or overlap very much with signals from radicals whose structural
characterization is desired.
The AQ(D)S photochemistry is occuring in aqueous solution and the effect of
solution pH on these photosensitizers deserves comment. In low pH solutions the AQS–•
radical anion is expected to be protonated rapidly to form the AQSH•, and AQDSH• radicals.
This is based on the fact that the pKa of the conjugate acid of the closed shell anion is 3.9,16,17
approximately the same acidity. If anything it should even be more acidic as it is more
electron deficient as an open shell molecule. The neutral AQSH• radical is also strongly
polarized by the triplet mechanism and has a very narrow spectral width, although it is
broader than the AQS–• signal due to a small hyperfine coupling to the extra H atom. For this reason it appears as a narrow, sharp doublet in our experiments (at least at later delay
times, vide infra), and slightly upfield from AQS–• due to its smaller g-factor. The AQ(D)S-• radicals, along with their conjugate acids, are shown in Chart 1.1.
1.4.2 Hydrogen Peroxide
In order to create product radicals through H-abstraction processes, hydroxyl radicals
are used as precursors. Hydroxyl radicals have been shown to be very reactive and to oxidize
substrates unselectively with near diffusional rate constants.18 The most convenient method for the creation of hydroxyl radicals is the direct photolysis of hydrogen peroxide. The
general mechanism for this process is shown in Scheme 1.2. While the extinction
coefficient of H2O2 at UV wavelengths is very low, this reaction creates 2 equivalents of
hydroxyl radicals per photon absorbed. Hydroxyl radicals are EPR silent due to extremely
fast spin relaxation from spin rotation interaction. This means that only the counter-radicals
are observed spectroscopically without signal overlap. Hydroxyl radicals are formed directly
from cleavage of 1H2O2* and therefore do not transfer any TM polarization over to the
radical products. However, RPM spin polarization occurs from F-pairs formed in solution,
thereby generating the necessary polarization to observe the product radicals. Unlike normal
RPM emissive/absorptive (E/A) spectral patterns, hydroxyl radical spectra generate
the previous section and will be focused on in detail in Chapter 4. The polarization generated
from this radical chemistry enables us to observe oxygen adduct product radicals that will be
Scheme 1.2: Photolysis of H2O2 to produce hydroxyl radicals and H-abstraction from
CHAPTER II
2.1 Introduction
Amino acid side chain redox chemistry and free radical chemistry are critical to many
biological reaction mechanisms,5 and a detailed characterization of the reactive intermediates involved is highly desirable. The process of oxidation at sulfur in methionine to give a
radical cation (2.1, Scheme 2.1, top), has been implicated in several important biochemical
reaction pathways, notably glycation of proteins and subsequent disease development such as
glaucoma.6 The redox chemistry of methionine within proteins is currently a topic of great interest. Much of this attention stems from the fact that oxidation of methionine has been
directly linked to amyloid fibril formation in neurological biochemistry. This process is
suspected to be the first in a cascade of many chemical reactions leading to symptoms of
Alzheimer’s disease.2-4
2.2 Background
Methionine radical cation is therefore a paramagnetic reactive intermediate of great
importance, whose structure and reactivity need to be clearly understood. The cation itself
and several model systems have been investigated indirectly by several different physical
methods in solution, and in glassy matrices or single crystals by electron paramagnetic
resonance (EPR) spectroscopy. However, high resolution EPR characterization of 2.1 and its
N-acetylmethionine derivative (2.2, Scheme 2.1, bottom right) in aqueous solution has not
been reported to date. Our research groups have had a long-standing interest in the redox
Scheme 2.2 shows the spectrum of reactivity that has been proposed in the literature during
the past 30 years for cations such as 2.1. The first magnetic resonance spectra of such
cations were recorded by Kominami22 and Kawatsura, et al.,23 who reported EPR parameters from γ–irradiated single crystals of DL–methionine. Along with Naito et al.’s EPR work on
33S substituted methionine in 1977,24 these early papers clearly established that oxidation
occurs preferentially at sulfur. Later, pulse radiolysis experiments by Asmus et al.,25 along with further work by Naito and coworkers,26 provided evidence for dimeric structures such as
2.5a containing S–S three electron bonds, as well as neighboring group effects with
heteroatoms such as nitrogen and oxygen. Such neighboring group effects led these
researchers to postulate 6– and 5–membered ring intermediate structures with S–O and S–N
three electron bonds (e.g. 2.6 and 2.7 in Scheme 2.2), whose formation was dependent on the
pH of the solution. Bobrowski and coworkers have done extensive studies of the oxidation
chemistry of methionine and have proposed similar cyclic structures,27 as well as the possibility that hydroxyl radical, at pH > 10, can assist decarboxylation of the radical cation
in certain short peptide sequences.28 In the case of a single methionine molecule the decarboxylation reaction would lead to an α–amino radical such as 2.8. There is also some
evidence for the existence of hydroxy sulfuranyl radicals (e.g. 2.9) in the solution chemistry
of this amino acid.29 The majority of the early literature reports on this topic have provided at least circumstantial evidence for the dimeric S–S bonded structure 2.5a at pH < 7 and the
5–membered ring S–N bonded structure 2.7a at pH > 10.
The low temperature steady–state EPR experiments of Champagne et al. showed that
the cyclic structure 2.7a is formed in the solid state.30 Their data lacked the resolution
were reported to only 3 significant figures. Resonance Raman experiments on (3–
(methylthio)propylamine), a model compound for 2.1, by Tripathi and Tobien31 also
supported the existence of the 5–membered ring structure. They suggested that it is formed
through an –SOH type intermediate such as 2.9. Recent papers by Schoeneich and
coworkers have suggested that the 6–membered ring structure 2.6 with an S–O three electron
bond is an important intermediate with regard to the β–amyloid fibril formation reaction.32 It
should be noted that this reaction is limited to cases where the methionine residue is part of a
protein or short peptide, and not a free standing amino acid. They have also reported
evidence for its existence in product analysis studies using hydroxyl radical as the oxidant.33 However, those experiments were carried out with the amide of methionine, and not the
amino acid itself. There may be subtle steric or electronic factors that favor and S–O bond
over an S–N bond in some derivatives of methionine. New ab initio calculations by both the
Schoeneich group34 and by Huang and Rauk35 support this. The latter paper also suggests that the deprotonation reaction of the non–cyclic structure to give α-thio alkyl radicals (2.3 or 2.4) may also be a possible reaction pathway. In this regard, deprotonation of the 5–
membered ring structure to give the linear aminyl radical 2.10 may also be important.
In other experiments using magnetic resonance detection, there have been several
reports offering indirect evidence for some of the structures shown in Scheme 2.2. An
interesting study of this chemistry was reported by Goez et al.,36 who used steady-state
chemically induced dynamic nuclear polarization (CIDNP) measurements of products
formed from the S–N bonded 5–membered ring structure. They discussed their results in
terms of a dynamic equilibrium between the linear and cyclic species, and concluded that
reported the magnetic field dependence of the CIDNP signals, which led to estimates of some
of the hyperfine interactions in the cyclic structure; we will comment further on those results
in the discussion section below. These CIDNP experiments represent the only high
resolution magnetic resonance characterization of methionine-related redox intermediates to
date. A precise map of the spin density distribution in cations 2.5a and 2.7a has remained
elusive.
Several of the reactions described in Scheme 2.2 may be fast at room temperature and
therefore the concentration of 2.1, 2.5a, or 2.7a in such solutions may be too low to detect by
conventional steady–state EPR methods. This is to be expected especially for the
decarboxylation and deprotonation reactions. This problem is circumvented in two ways.
First, by using the TREPR method we detect the cation when there are large concentrations
of it present. Second, when the amide nitrogen is acetylated, the secondary reactions are
retarded to such an extent that the lifetime of the cyclic structure in solution may be extended
significantly. Another major focus of these studies is the radical cation of N-acetyl
methionine (2.2), which is a good small molecule model compound for Met–containing
proteins because of the amide bond at the N–terminus.
This chapter presents high resolution TREPR spectra of cations and other free
radicals produced from reactions of methionine and N-acetylmethionine with photoexcited
AQS. Characterization data in the form of electron chemical shifts (free radical g–factors)
and isotropic hyperfine coupling constants will be put forward and discussed. With this
particular system it is advantageous to conduct the TREPR experiment at the Q–band
microwave frequency (35 GHz), where chemical shift resolution is higher than the standard
hyperfine coupling constants, and to use spectra acquired at two different frequencies to
improve the precision of our g–factor measurements. In some cases, running the experiment
at a higher frequency also leads to more accurate hyperfine coupling constants because it can
eliminate the problem of spectral overlap than often plagues EPR analysis at lower
frequencies.
2.3 Results and Discussion
2.3.1 pH Dependent Formation of Radicals from L-Methionine
Figure 2.1 shows X–band TREPR spectra obtained at room temperature in aqueous
solution of pH = 2 when AQS is irradiated in the presence of L–methionine. In Figure 2.1A
the spectrum obtained at a delay time of 700 ns after the laser flash is shown, with a
simulation overlaid. The spectra exhibit strongly emissive transitions due to the triplet
mechanism of chemically induced electron spin polarization (CIDEP),15 a well understood phenomenon and typical for radicals or radical ions produced from excited states of
quinones.39 The simulation in Figure 2.1A uses two sets of hyperfine coupling constants
resulting from interaction of the unpaired electron with 6 equivalent methyl protons and 4
equivalent methylene protons, respectively. Such a hyperfine coupling pattern can only arise
from a dimer type structure such as 2.5a in Scheme 2.2. The concentration dependence of
this TREPR signal also supports this conclusion: The signal intensities are proportional to
the square of the concentration, however we were never able to go low enough in
concentration to see the monomeric cation before going below the sensitivity of the apparatus.
The g-factor and coupling constants used for the simulation are listed in Table 2.1. They are
Figure 2.1: Time dependence of the X-band TREPR spectra taken upon irradiation of L-methionine and AQS in H2O (pH 2.0) at: A) 0.7 µs (dotted line) B) 2.0 µs. Simulation of A
is overlaid (solid line) on the experimental spectrum. See Table 2.1 (radical 2.5a) for
magnetic parameters. The magnetic field sweep width is 80 G. The TREPR intensity (y-axis) is in arbitrary units. In this and all subsequent spectra, lines below the baseline are in emission, while those above the baseline are in enhanced absorption.
20 G
Emission
A
Table 2.1
Substrate Radical Structure g-factor alpha-H(D) (G)
beta-H(D)
(G) Other (G)
AQS AQSH• 2.0038 1.8 (O-H)
Methionine in
H2O (low pH) 2.5a 2.0101
7.12 (6H) 5.66 (4H)
NAM in H2O
(low pH) 2.5b 2.0101
6.92 (6H) 6.05 (4H)
Methionine in
H2O (high pH) 2.1 2.0043 21.92 (HN) 33.30 (HC) 13.36 (N)
Methionine in
D2O (low pH) 2.10-d 2.0043 3.32 (DN) 13.36 (N)
NAM in H2O
(high pH) 2.7 2.0073 9.57 (HN)
8.30 (3H) 7.38 (2H) 1.35 (H)
NAM-d3 in H2O
(high pH) 2.7-d3 2.0073 9.57 (HN)
1.27 (3D) 7.38 (2H) 1.35 (H)
NAM in D2O
(high pH) 2.7-N-d 2.0073 1.47 (DN)
signal was simulated using a single broad line as no hyperfine splittings were resolved at this
delay time (due to uncertainty broadening effects discussed in Chapter 1).
Figure 2.1B shows the same system detected at 2 µs after the laser flash, where only
the AQSH• radical is observed (large emissive doublet). The disappearance of the
methionine dimer radical cation on this time scale is most likely due to two processes: spin–
lattice relaxation and degenerate electron exchange. It is reasonable to expect that the dimer
will relax faster than the AQSH• radical due to the heavy atom effect of the sulfurs. The
exchange reaction, while not a chemical decay process in itself, will quench polarization due
to scrambling of the nuclear spin systems.
Figure 2.2 shows the pH dependence of the methionine/AQS system as detected by
TREPR 200 ns after flash photolysis at 308 nm. Clearly there is an evolution of the dimer
signal to a different carrier at about pH 9, which is at approximately the pKa value of the
protonated nitrogen of the amino group. The higher pH spectra are at first glance a bit
confusing to decipher because of the intensities of the transitions, which do not appear to be
all emissive (E) or absorptive (A), nor do they follow any familiar pattern of CIDEP such as
low field E, high field A, which would be expected from the radical pair mechanism. The
intensities will be commented on below, but note here that there are not many transitions and
they are well spaced, indicating that only a few hyperfine coupling constants are present.
This does not fit the expected pattern for the cyclic structure 2.7, which leads us to suggest
that either the cyclic structure is not formed, or that once formed it has another chemical
decay pathway available to it such as deprotonation at nitrogen. Our simulations, presented
Figure 2.2: pH dependent X-band TREPR spectra taken of L-methionine and irradiated AQS in H2O at 0.2 µs delay time. The pH values are shown directly below the spectra. The sweep
width for all spectra is 150 G.
pH = 4.06
6.23
8.89
9.31
9.80
10.83
11.66
12.59
The spin polarization pattern observed in Figures 2.1 and 2.2 is dominated by the
triplet mechanism, which is strongly emissive as expected for photochemical reactions from
quinone triplet states.39 The AQS–• radical formed in basic solution has a g-factor of 2.0040 and appears as a broad single line due to unresolved hyperfine interactions on the aromatic
ring. In acid solution the AQSH• radical is observed due to rapid protonation at oxygen, and
the signal appears as an emissive doublet with a g-factor of 2.0034, slightly upfield from
AQS–•. We have expanded the spectra vertically to show the detailed hyperfine structure of
the other radicals, therefore the g-factor difference in the two AQS-based radicals is not
visible. However, in our Q-band spectra reported below it will be very obvious that there are
two different counter-radical signal carriers as a function of pH. The advantage of using
AQS as a sensitizer is clearly seen here as it does not overlap much with the other radicals,
allowing for their more precise characterization. It is a better choice for EPR studies than
4-carboxybenzophenone, for example, which has been used by other researchers for amino acid
oxidation studies,38,41 but has multiple hyperfine interactions that overlap to a large extent with the other radicals’ signals at g = 2.
Figure 2.3A shows the TREPR spectrum acquired at pH > 12 from Figure 2.2, along
with a simulation in Figure 2.3B using literature parameters for a typical aminyl radical
2.10.42-44 At these pH values, deprotonation of the cyclic methionine radical cation to the
aminyl radical is fast. Here the y-axis is expanded and the spectra have been signal averaged
slightly longer to show all the TREPR transitions. Examination of Scheme 2.2 shows that
there are two pathways by which the aminyl radical can be produced: 1) loss of a proton from
the cyclic structure 2.7, or 2) electron transfer from nitrogen to sulfur after the initial creation
(not shown in the Scheme) involving direct photo-oxidation of the nitrogen followed by
proton loss,41 but we rule this out based on the much lower ionization potential for the sulfur lone pair electrons. This difference in ionization potentials also leads us to rule out the
second pathway described above, as it is unlikely that an uphill electron transfer event will
occur on this time scale, especially with a flexible spacer between the donor and the acceptor.
We conclude that the most likely pathway for production of the aminyl radical at room
temperature from methionine above pH 9 is loss of a proton from the cyclic radical cation,
which then no longer remains in the cyclic geometry because the stabilization of the positive
charge on the sulfur atom is not necessary. In some of the broader spectra in Figure 2.2, at
about pH 7 or 8, the cyclic structure may be present but significantly lifetime broadened by
this process or by the cyclization process itself, which may be dynamic on this time scale.
This possibility will be commented on below.
It is important to note that the simulation in Figure 2.3B only attempts to reproduce
line positions and chemical shift information and not the intensities. As noted above, the
intensities of the transitions in Figure 2.3A are quite unusual, with some lines nearly being
cancelled out and others appearing in absorption where one would predict emission. We
suggest that this pattern arises because of what is known as a spin “memory effect.”45-47 The initially formed cation contains two protons on the amine nitrogen, both of which are coupled
to the unpaired electron. The radical pair mechanism spin polarization is created in this
radical. Deprotonation takes place mostly after this polarization has formed, but the resulting
aminyl radical has one less proton and therefore it carries the splitting pattern of the second
radical but each transition “remembers” the spin polarization obtained in the first radical.
Figure 2.3: High pH/pD X-band TREPR spectra of L-methionine and irradiated AQS taken at 0.2 µs delay time in: A) H2O C) D2O. Exact pH/pD values are shown below corresponding
spectra. B) and D) simulations of A and C, respectively. See Table 2.1 (radical 2.10a) for
parameters. The sweep width for both spectra is 150 G.
pD=12.84
pH=12.24
20 G
A
B
C
D
solution phase CIDNP experiments48 and in solid-state TREPR experiments on, for example, photosynthetic reaction centers.45-47 This memory effect for non-interacting monoradicals in liquid solution by TREPR has not been reported previously. Our model for the phenomenon
and more precise simulations will be presented in Section 2.3.3.
To further support the assignment of the spectrum in Figure 2.3A to the aminyl
radical, the experiment was run in D2O instead of H2O. This is expected to result in efficient
deuterium exchange at nitrogen, which should give radicals with different spectral patterns
for either the cyclic structure or the aminyl radical. The resulting experimental TREPR
spectrum is shown in Figure 2.3C along with a simulation (Figure 3D) that uses the same
hyperfine coupling constants as for the simulation in Figure 2.3B except that the aminyl
proton now has I = 1 and a coupling constant of 6.5 less than its protonated analog. It is
interesting to note that the spectral intensities in Figure 2.3C follow the same deviation in
intensities as the protonated analog. This follows in a manner consistent with our model for
sequential radicals and a memory effect discussed above. Again it should be noted that no
effort is made in these simulations to account for the deviations from “normal” CIDEP
intensities; only the line positions have been used to make the structural assignment.
2.3.2 The pH Dependent Formation of Radicals from N-acetyl-L-Methionine Analogs
In order to better characterize the cyclic radical cation 2.7, it was recognized that the
deprotonation reaction leading to the aminyl radical 2.10 had to be slowed down so that the
cyclic structure could be observed directly by TREPR. To accomplish this, we used
N-acetylmethionine (2.2), which changes the N-terminus of the amino acid from an amine to an
deprotonation at nitrogen will not occur.49 In this case the cyclic structure, once formed, should have a much longer lifetime than for methionine. Scheme 2.3 shows how acetylation
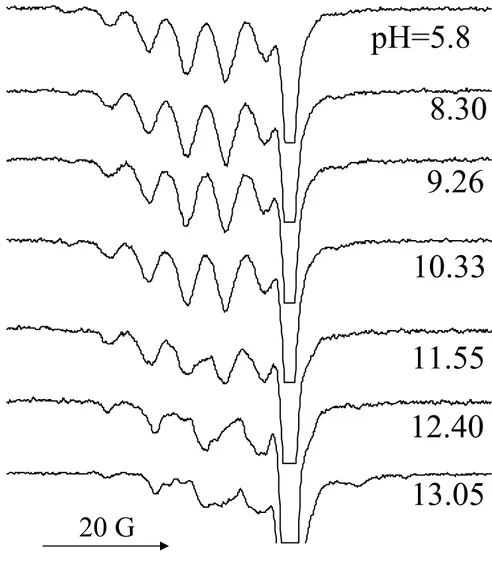
simplifies the possible redox chemistry with AQS. Figure 2.4 shows the pH dependence of
the X–band TREPR spectra acquired after irradiation of the N–acetylmethionine/AQS system.
At low pH, an 11 line pattern is observed from 10 nearly equivalent protons as in Figure
2.1A, therefore this signal is assigned to the dimer radical cation. A new signal carrier grows
in at high pH that is different from the dimer spectrum. Furthermore this new signal is not
due to the aminyl radical observed in Figures 2.2 and 2.3, as it has a completely different
hyperfine pattern (cf. Figure 2.2, bottom, and Figure 2.3, top).
Figure 2.5A shows the pH = 5.8 spectrum from Figure 2.4, next to a spectrum run in
D2O as the solvent instead of H2O (Figure 5B). It is clear that there is no isotope effect upon
deuterium substitution at the N–terminus of this derivative of methionine radical cation. The
simulation in Figure 5C reproduces both spectra extremely well, and we assign both spectra
to the dimer of the radical cation of N-acetylmethionine. We will comment further on the
absent isotope effect when the high pH data from Figure 2.4 is considered below. Parameters
used in the simulation are listed in Table 2.1. The hyperfine coupling constants are slightly
different than those for methionine radical cation, decreasing for the methyl protons while
increasing slightly for the methylene protons. This is an expected result as the carbonyl
moiety of the acetyl group is electron withdrawing and so the shift in electron density for this
species is in the predicted direction.
Figure 2.6A shows the TREPR spectrum from Figure 2.4 acquired at pH = 12.2.
Immediately below it in Figure 2.6B is a simulation, using parameters listed in Table 2.1, that
Figure 2.4: pH dependent X-band TREPR spectra of N-acetyl L-methionine and irradiated AQS in H2O at 0.2 µs delay time. Exact pH values are shown directly below the spectra.
The sweep width for all spectra is 80 G.
20 G
pH=5.8
0
8.30
9.26
10.33
11.55
12.40
Figure 2.5: Low pH/pD X-band TREPR spectra of N-acetyl L-methionine and irradiated AQS taken at 0.2 µs delay time in: A) H2O B) D2O. Exact pH/pD values are shown above
the corresponding spectra. C) simulation of A using parameters shown in Table 2.1 (radical
2.5a). The sweep width for both spectra and simulation is 80 G.
pD=2.0
pH=2.0
20 G
A
B
N–acetylmethionine (2.7). To provide further support for this assignment, we performed the
two isotopic substitutions illustrated in Chart 2.1. The first substitution was carried out as
before by running the experiment in D2O, where we expect H/D exchange at the N–terminus
(Chart 2.1, right hand side). In this case we expect to see little or no effect for the dimer
structure at low pH because there are no exchangeable protons near the radical center in the
dimer, and this is indeed the case as per our discussion of Figure 2.5 above; the spectra of the
dimer in H2O and D2O are identical. At high pH however, an isotope effect on the spectrum
is observed (Figure2. 6C) and the simulation below the experimental spectrum (Figure 2.6D)
tells us that the deuterium substitution was made at the amide nitrogen. The simulation was
carried out once again with all parameters from the protonated structure in Figure 2.6A
except for the deuterium atom on nitrogen which was given I = 1 and a coupling constant of
6.5 times less than that of the corresponding proton (Table 2.1).
Additional support for the cyclic structure comes from isotopic substitution at the
methyl group on the side chain of N-acetylmethionine (Chart 2.1, left hand side). A sample
of L–methionine with a CD3 group in place of the CH3 group was purchased and converted to
the N-acetylmethionine-d3. A subsequent TREPR experiment with 3AQS* oxidation at high pH led to the spectrum shown in Figure 2.7B which is attributed to radical 2.7-d3. The
protonated analog is shown for comparison immediately above it in Figure 2.7A. There is a
large change in the spectral width and number of transitions between these two figures. Once
again, spectral simulation with the predictable changes in spin quantum number and coupling
constant for those 3 protons/deuterons leads to excellent agreement (Figure 2.7C, Table 2.1)
Chart 2.1: Isotopically labeled cyclic radical cations formed from the oxidation of NAM analogs
Figure 2.6: High pH/pD X-band TREPR spectra of irradiated N-acetyl L-methionine and AQS taken at 0.2 µs delay time in: A) H2O C) D2O. Exact pH/pD values are shown directly
below the spectra. B) and D) simulations of A and C, respectively. See Table 2.1 (radical
2.7b and 2.7b-d1) for parameters. The sweep width for both spectra and simulations is 80 G.
A
B
20 G
C
D
pH 12.2
Figure 2.7: High pH X-band TREPR spectra of irradiated AQS and: A) N-acetyl L-methionine taken at 0.2 µs delay time B) N-acetyl L-methionine-methyl-d3 taken at 0.4 µs in
H2O. Exact pH values are shown below the spectra. C) simulation of B using parameters
shown in Table 2.1 (radical 2.7b-d3). The sweep width of both spectra is 80 G.
pH 12.2
pH 12.7
A
B
C
The coupling constants obtained for the cyclic cation of N-acetylmethionine are all
hyperconjugative in nature except for the nitrogen. This is of interest as each coupling to
these protons should be dependent on the dihedral angle and therefore to the ring
conformations and/or dynamics. This will be commented on further below, but it should be
noted here that the proton coupling constants are all smaller than usually observed for
5-membered rings50 and this may be due to the σ-σ* nature of the three electron bond, vide infra. In such cases the hyperfine interactions might be expected to fall between those of a
neutral radical and, say, a radical anion where all coupling constants are typically much
smaller than their neutral counterparts due to the distance of the unpaired electron from the
nuclei. In some cases this difference in hyperfine values can be an order of magnitude.
Figure 2.8 shows TREPR spectra of the N-acetylmethionine/AQS system measured at
the Q–band microwave frequency. As mentioned above, deprotonation of this radical cation
is slow even in strongly basic solution because it is an amide rather than an amine. Therefore,
the dimer is observed at low pH and the cyclic structure at high pH. This experiment allowed
very accurate g–factors to be obtained using field/frequency measurements and comparison
to the X–band spectrum (Table 2.1). The observed splitting patterns are the same as at
X-band for each radical, and are almost completely separated from the AQS signals at Q-X-band.
It should be noted that in Figure 2.8B the polarization of the radical from AQS is absorptive
– this is a common observation in Q-band experiments, where the higher field leads to
stronger RPM51 polarization. The RPM is driven here by the large g-factor difference and has the correct phase (E for the low field radical, A for the high field signal) expected for a
Figure 2.8: Q-band TREPR spectra of N-acetyl L-methionine and irradiated AQS in H2O at:
A) pH 2.0 taken at 400 ns delay time C) pH 12.7 taken at 150 ns. B) and D) simulations of A and C, respectively, using parameters shown in Table 2.1 (for radicals 2.5 and 2.7b). The
sweep width for both spectra is 100 G.
pH = 2.0
pH = 12.7
A
B
C
D
exchange interaction. The line widths are broader here than at X-band due to the shorter
delay times of observation (uncertainty broadening).
The difference in g-factor between the S dimer structure (2.0101) and the cyclic
S-N structure (2.0073) is easily understood using a resonance description. There are two main
resonance structures that contribute to the stability and spin density of the cyclic cation.
They have the general form S-N+• and +•S-N. The ratio of hyperfine coupling constants in
the methyl protons of the dimer to the cyclic species is 8.30/7.12 = 1.17. This tells us that the
S+• structure contributes roughly 60% to the overall g-factor (i.e., there is a greater spin
density on the sulfur side of the three-electron bond). The remaining 40% comes from the
N+• structure, which can be estimated by considering the literature value for the g-factor of
an alkyl amine radical cation (2.0034).52,53 Weighing these two g-factors by their appropriate percentages, we can calculate the expected g-factor for a S-N+• structure: 0.6 x (2.0101) +
0.4 x (2.0034) = 2.0074. This is almost exactly the observed value of 2.0073. Of course,
calculations of g-tensors from first principles are much more complicated than this, and we
present the above comparison only to show that, using a fairly simple model, the correct
trend can be estimated for this previously undetermined g-factor.
Figures 2.6, 2.7 and 2.8 represent solid evidence for the assignment of the TREPR
signal carrier in high pH solutions of 2.2 with AQS to the cyclic radical cation of
N-acetylmethionine. The isotopic substitution studies have provided several self-consistent
datasets for the existence of 2.7 as a five-membered ring with the S–N three electron bond.
If the six–membered ring with a S–O three electron bond were present instead, we would not
expect an isotope effect upon substitution at the amide nitrogen, and a very different
the first room temperature liquid solution EPR characterization of any two-center three–
electron bond radical cation.
A noteworthy feature of the magnetic parameters we have determined in this work is
the very small hyperfine coupling for the nitrogen atom in the cyclic radical cation of
N-acetylmethionine. This result implies that there is a very low spin density at nitrogen in this
radical, which conflicts somewhat with the ab initio calculations of Huang and Rauk,35 and is a somewhat different interpretation of the field dependent CIDNP data of Korchak et al,38 who studied both methionine and N-acetylmethionine. In the work of Champagne and
coworkers30 the nature of the three–electron bond is described as a σ–σ* interaction and this
may help explain why the coupling constant is small. If the unpaired electron is located in a
σ* orbital, it will be further away from the nucleus. Also, the remaining electrons from the
lone pair on nitrogen may “shield” the unpaired electron from the nucleus.
While the calculations of Huang and Rauk may show a trend in hyperfine interactions
that is physically reasonable, the fact that they were run without neighboring solvent
molecules makes their absolute values somewhat suspect. The cyclic cation has a negative
and positive charge, and therefore the presence of nearby water molecules would be expected
to have a large effect on its structure. In addition, if the cyclic cation is fluxional, solvent
would be expected to play a large role in determining the average coupling constants. As for
the field-dependent CIDNP data of Korchak, et al.,38 the authors also reported a low
hyperfine coupling constant for the nitrogen and the α-carbon of N-acetylmethionine, which
is consistent with our observations. However, they concluded from this small value for aN
that the cyclic structure was not a reactive intermediate present in N-acetylmethionine