Short-term nutrient and sediment fluxes following dam removal
James Adam Riggsbee
A dissertation submitted to the faculty of the University of North Carolina at Chapel Hill in partial fulfillment of the requirements for the degree of Doctor of Philosophy in the
Department of Environmental Sciences and Engineering.
Chapel Hill 2006
Approved by:
© 2006
ACKNOWLEDGEMENTS
ABSTRACT
Riggsbee, J.A., Ph.D., University of North Carolina at Chapel Hill, August, 2006. Short-term sediment and nutrient fluxes following dam removal. Completed under the direction of Martin Doyle and Robert Wetzel.
Sediment and nutrient fluxes resulting from dam removal were investigated with a combination of field and laboratory studies. Impoundment-specific controls (i.e.,
investigated. Finally, based on the experience and knowledge gained from this
TABLE OF CONTENTS
LIST OF TABLES………... xii
LIST OF FIGURES………. xiii
CHAPTER I: INTRODUCTION………. 1
DAM REMOVAL: BASIC RESEARCH AND RIVER RESTORATION….. 1
DAM REMOVAL BIOGEOCHEMISTRY……….. 1
PURPOSE OF DISSERTATION……….. 5
STRUCTURE OF DISSERTATION………. 6
REFERENCES………... 8
CHAPTER II: SEDIMENT, DISSOLVED ORGANIC CARBON AND NITROGEN FLUXES DURING THE DAM REMOVAL PROCESS……… 10
ABSTRACT………... 10
INTRODUCTION………. 10
Dam removal and emerging science needs………. . 11 Assessing impacts of dam removal on downstream water quality……….. 12
Purpose and structure of paper………. 15
STUDY AREA……….. 16
METHODS……… 16
Dam removal phases……… 16
Sampling design………... 18
Breaching, removal, flood events………. .
19
Hydrology……… 20
Total suspended solids………... 21
Biogeochemistry……….. 21
Budget calculations……….. 22
RESULTS……….. 22
Hydrology……… 22
Total suspended solids………. 23
Dissolved organic carbon………. 26
Dissolved nitrogen………... 27
DISCUSSION……… 29
Context for comparing water quality impacts of dam removal……… 30
Routing of dissolved versus particulate loads through downstream channels……….. 31
Regional and structural controls on downstream impacts of dam removal 34 CONCLUSIONS……… 39
REFERENCES………... 42
CHAPTER III: SUSPENDED SEDIMENTS IN RIVER ECOSYSTEMS: PHOTOCHEMICAL SOURCES OF DISSOLVED ORGANIC CARBON AND ADSORPTIVE REMOVAL OF DISSOLVED IRON……… 56
ABSTRACT………... 56
INTRODUCTION………. 57
Hydrogeomorphic scaling……… 62
Experimental sediment and water collections……….. 63
Experimental procedures……….. 64
Biogeochemical sampling procedures………. 65
Biogeochemical analyses……… 68
Statistical analyses………... 69
RESULTS……….. 70
Carbon……….. 70
Dissolved nitrogen, phosphorus and iron………. 71
DISCUSSION……… 72
Experimental discussion……….. 72
Extrapolation and comparison………. 73
Suspended sediment controls on dissolved iron dynamics in river ecosystems………. 76
Photochemical processing of terrestrial carbon………... 78
CONCLUSIONS……… 79
REFERENCES………... 80
CHAPTER IV: PHYSICAL AND PLANT COMMUNITY CONTROLS ON NITROGEN AND PHOSPHORUS LEACHING FROM IMPOUNDED RIVERINE WETLANDS FOLLOWING DAM REMOVAL……….. 96
ABSTRACT………... 96
INTRODUCTION……… . 96 Former reservoir: variable source of downstream disturbance……… 96
STUDY SITE………. 101
Little River and Lowell Mill Dam………... 101
Impounded riverine wetlands: pre and post-removal………... 101
METHODS……… 103
Vegetation experimental design……… 104
Groundwater table elevation……… 104
Plant community biomass……… 105
Interstitial and surface water biogeochemistry……… 105
Analyses………... 107
RESULTS………. . 108 Plant community biomass……… 108
Groundwater table elevation……… 108
Interstitial and surface water biogeochemistry……… 109
DISCUSSION……… 111
Physical controls on nitrogen and phosphorus leaching……….. 111
Plant controls on channel nitrogen and phosphorus leaching……… 114
Wetland and non-wetland variable source areas within recovering impoundments……… 116
CONCLUSIONS……… 118
REFERENCES………... 120
DAMS AND DAM REMOVAL: THE STATE OF THE SCIENCE………... 128 DAM REMOVAL AS RIVER RESTORATION……….. 131 TEMPORAL AND SPATIAL DIVERGENCE……… 133 DISTURBANCE, BIOLOGICAL SUCCESSION, AND GEOMORPHIC
REWORKING………. 136
CONCLUSIONS……… 139
LIST OF TABLES
LIST OF FIGURES
2.1 Study reach: Lowell Mill Impoundment……… 47 2.2 Little River hydrograph (April 2005 – February 2006)………. 48 2.3 TSS concentrations and loads during the removal of Lowell Mill Dam… 49 2.4 Downstream routing of TSS during the dewatering of Lowell Mill
Impoundment……….. 50
2.5 DOC concentrations and loads during the removal of Lowell Mill Dam 51 2.6 Downstream routing of DOC during the dewatering of Lowell Mill
Impoundment……….. 52
2.7 TDN concentrations and loads during the removal of Lowell Mill Dam 53 2.8 Downstream routing of TDN during the dewatering of Lowell Mill
Impoundment………..… 54
2.9 Transport of dissolved and particulate loads along the
advective-dispersive continuum during floods and dam removals…………...….. 55 3.1 TSS vs. Q curves for the Deep River at Moncure and Ramseur, NC…… 85 3.2 DOC desorption from suspended sediments in light and dark treatments 86 3.3 CO2 production from DI and RW treatments………. 87 3.4 Total C desorption in DI and RW treatments in the presence of light…... 88 3.5 CO2 production rate experiment………. 89 3.6 DOC desorption rate experiment……… 90 3.7 TDN desorption from suspended sediments in light and dark treatments 91 3.8 Fed removal efficiency………....…... 92 3.9 Fed removal rates for sediment and river water mixtures in light and
3.10 Fe and fine sediment interactions in river ecosystems…………..………. 94
3.11 Photoassisted DOM desorption from suspended sediments in river ecosystems………...………….. 95
4.1 Site map of Lowell Mill Impoundment……….. 123
4.2 Riverine wetland recovery following dam removal………... 124
4.3 Riverine wetland plant biomass and groundwater table elevations following dam removal……….. 125
4.4 Plant community controls on riverine wetland interstitial biogeochemistry following dam removal………. 126
4.5 Wetland surface water biogeochemistry dynamics……… 127
5.1 Upstream disturbances following dam removal…………...……….. 143
5.2 Downstream disturbances following dam removal………...………. 144
5.3 Hypothetical trajectories toward biogeochemical steady state for upstream and downstream reaches following dam removal……...…... 145
5.4 Hypothetical trajectories toward geomorphic steady state for upstream and downstream reaches following dam removal……….…...….. 146 5.5 Hypothetical trajectories toward biogeochemical and geomorphic steady
CHAPTER I: INTRODUCTION
DAM REMOVAL: BASIC RESEARCH AND RIVER RESTORATION
Some of the most productive research efforts linking the historically independent fields of hydrology, geomorphology and ecology were accomplished by studying the effects of damming on river ecosystems. Likewise, the emergence of dam removal as a viable management strategy for river ecosystems has given basic researcher another chance to explore the interconnectivity among these disciplines. Since dam removal is increasingly used as a river restoration technique, research efforts generating data from actual removals are not only of interest to the river research community, but also regulators, policy makers, and restoration practitioners. There is much to learn about river responses to dam removal, and the reliable use of dam removal as river restoration is limited by the paucity of available scientific studies.
DAM REMOVAL BIOGEOCHEMISTRY
Among the many facets of dam removal research, geomorphic and biological responses are the most well documented (Stanley et al., 2002; Doyle et al., 2003a and b; Lenhart, 2003; Pollard and Reed, 2004; Sethi et al., 2004; Thomson et al., 2005;
investigated by some (Bushaw-Newton et al., 2002; Doyle et al., 2003b; Ahearn and Dahlgren, 2005; Ashley et al., 2006). In terms of river restoration, upstream responses to dam removal are typically favorable. Among the dam removal biogeochemical literature, one general trend has emerged; impoundments export accumulated sediments, nutrients and organic materials to downstream environments following dam removal. However, the magnitude of impoundment loading among dam removals exhibits considerable variability. For example, a couple of studies found that sediment and nutrient exports following dam removal were an order of magnitude higher than baseline levels (Doyle et al., 2003; Ahearn and Dahlgren, 2005). On the other hand, another study concluded that dam removal had no effect on suspended sediment or nutrient concentrations (Bushaw-Newton et al., 2002). Considering such variability, what then controls the magnitude of sediment and nutrient fluxes exiting former impoundments? Because the export of impounded materials may pose serious threats to downstream biota (Sethi et al., 2004), river restoration practitioners need to better understand and anticipate upstream and downstream responses to dam removal.
America’s small impoundments exhibit considerable channel morphology
variability. For example, Wisconsin systems typically exhibit wide impounded channels relative to natural channel dimensions (Stanley et al., 2002; Doyle et al., 2003).
removal studies must be conducted in many regions for the effective management of future dam removals.
As reservoirs shed materials accumulated over the course of impoundment, the routing of theses materials through downstream environments are not well known. To date, increased fluxes of materials exiting impoundments are infrequently investigated beyond the immediate downstream vicinity of the former dam site. An investigation that attempts to quantify the routing of various materials (particulate and dissolved) through downstream channels following dam removal could provide useful information for restoration practitioners as well river researchers. For the restoration industry, such information is important as the unintended downstream consequences of dam removal during restoration efforts may nullify upstream benefits. Further, it is likely that
dissolved, suspended and bed loads released from former impoundments will not exhibit similar spatial ranges of influence within downstream channels because they are
Sediments released form former impoundments are often characterized by
nutrient and organic matter-rich mineral surfaces (Stanley and Doyle, 2002). Thus, there is the potential that sediment suspensions routed through downstream environments can continue to contribute to already elevated water column nutrient and organic matter concentrations. Previous research has suggested that in the presence of light and
turbulence, suspended sediments may be a measurable source of dissolved organic carbon to the water column (DOC) (Koelmans and Prevo, 2003; Tietjen et al., 2005; Mayer et al., 2006). In other words, it is possible that dissolved biogeochemical loads released to downstream environments may be underestimated if measured only at the former dam site.
Another area of dam removal biogeochemistry in need of investigation is the role of plant communities colonizing sediment accumulations exposed by dam removal on the fluxes of N and P to downstream environments. Plant communities rapidly colonize sediment accumulations following dam removal (Shafroth et al., 2002; Orr and Stanley, 2006). These accumulations represent potentially appreciable sources of N and P in particulate and dissolved forms. Thus, there is considerable interest regarding the ability of burgeoning plant communities to sequester or otherwise immobilize N and P, limiting downstream nutrient enrichment.
responses can be viewed in both upstream and downstream directions from the former dam site. Such a model could be useful for both researchers and restoration practitioners. Practitioners wish to better anticipate the consequences of dam removal upstream and downstream, while basic river research may be able to appreciate the bidirectional nature of dam removal disturbances in river ecosystems.
PURPOSE OF DISSERTATION
The intention of this dissertation was to provide insight into both upstream and downstream spatial and temporal heterogeneity of sediment, nutrient and organic matter dynamics following dam removal. Further, it was my intention that all work presented within this dissertation would be useful to those interested in basic river research
(biogeochemical, ecological and geomorphic), river and wetland restoration practitioners and policy makers. The broad questions addressed within are as follows:
1. What system-specific features control the magnitude of sediment, nutrient and organic matter fluxes from impoundments following dam removal? 2. How are dissolved, suspended and bed loads routed through river channels
during floods and dam removals?
3. How do sediment suspensions affect water column and interstitial biogeochemistry in river ecosystems during floods and dam removals? 4. How do early successional plant communities affect fluxes of N and P
5. How do upstream and downstream disturbances caused by dam removal differ in their structure as well as their spatiotemporal extents?
The questions outlined above were answered using a combination of field and laboratory studies. To address questions 1, 2, 4 and 5, field studies were conducted predominately on the Little River, Johnston County, North Carolina where Lowell Mill Dam was removed in multiple stages from July 2004 to January 2006. Additional field studies were carried out on the Deep River, Chatham, Lee and Moore counties, North Carolina where Carbonton Dam was removed from October 2005 to February 2006. This system was used to address questions 3 and 5. Laboratory studies were conducted to provide controlled conditions to better determine how sediment suspensions could influence water column and interstitial biogeochemistry during floods and dam removals (question 3).
STRUCTURE OF DISSERTATION
This dissertation is written in the form of 5 chapters. This chapter is an introduction, while subsequent chapters were written for the purposes of journal
submission. For this reason, there may be some repetition of introductory material. This was done so that each chapter could be submitted as an independent manuscript.
Additionally, this chapter analyses the fate of dissolved, suspended and bed loads routed through channels during dam removals and floods. Finally, this chapter compares water quality impacts of dam removal to loads carried by low-magnitude floods within the same system.
Chapter III explores the biogeochemical role of suspended sediments in river ecosystems, which exhibit have high affinities for various forms of C, N and P. Sediments are frequently suspended during floods and dam removals, and since they represent significant pools of organic and inorganic forms of C, N and P, they are potentially important for water column biogeochemistry, particularly in the presence of light.
Chapter IV examines the role of plant communities and physical sediment properties on the fluxes of N and P from exposed sediments to adjacent formerly impounded channels following dam removal.
REFERENCES
Ahearn DS and Dahlgren RA. 2005. Sediment and nutrient dynamics following a low-head dam removal at Murphy Creek, California. Limnology and Oceanography 50:
1752-1762.
Ashley JTF, Bushaw-Newton K, Wilhelm M, Boettner A, Drames G and Velinsky DJ. 2006. The effects of small dam removal on the distribution of sedimentary
contaminants. Environmental Monitoring and Assessment 114: 287-312.
Bushaw-Newton KL, Hart DD, Pizzuto JE, et al. 2002. An integrative approach towards understanding ecological responses to dam removal: The Manatawny Creek study.
Journal of the American Water Resources Association 38: 1581-1599.
Doyle MW, Stanley EH, and Harbor JM. 2003a. Channel adjustments following two dam removals in Wisconsin. Water Resources Research 36: 1147, doi:
10.1029/2003WR002038, 2003.
Doyle MW, Stanley EH, and Harbor JM. 2003b. Hydrogeomorphic controls on phosphorus retention in streams. Water Resources Research 39: 1147,
doi:10.1029/2003WR002038, 2003.
Lenhart CF. 2003. A preliminary review of NOAA’s community-based dam removal and fish passage projects. Coastal Management 31: 79-98.
Orr CH, and Stanley EH. 2006. Vegetation development and restoration potential of drained reservoirs following dam removal in Wisconsin. Rivers Research and Applications 22: 281-295.
Pollard AI and Reed T. 2004. Benthic invertebrate assemblage change following dam removal in a Wisconsin stream. Hydrobiologia 513: 51-58.
Sethi, SA, Selle AR, Doyle MW, Stanley EH, and Kitchel HE. 2004. Response of unionid mussels to dam removal in Koshkonong Creek, Wisconsin (USA).
Hydrobiologia 525:157-165.
Stanley EH, Luebke MA, Doyle MW and Marshall DW. 2002. Short-term changes in channel form and macroinvertebrate communities following low-head dam removal.
Journal of the North American Benthological Society 21: 172-187.
Pennsylvania stream. Journal of the North American Benthological Society 24:
192-207.
Wildman LAS and MacBroom JG. 2005. The evolution of gravel bed channels after dam removal: Case study of the Anaconda and Union City dam removals. Geomorphology
CHAPTER II: SEDIMENT, DISSOLVED ORGANIC CARBON AND NITROGEN
FLUXES DURING THE DAM REMOVAL PROCESS
ABSTRACT
other removals to provide insight into regional and morphologic controls on exports of impounded materials following dam removal.
INTRODUCTION
Dam Removal and Emerging Science Needs
Dam removal has gained considerable scientific attention over the last several years as many states have begun to recognize the need for removing some of these structures from the nation’s drainage network. As America’s dams age beyond their intended design lives (Graf, 2005), dam owners are faced with the decision of repair, replacement or removal. Many of these aging structures are without clear titles of ownership, placing associated liabilities on federal, state and local governments. In response to assumed responsibilities, some states in the US have begun to provide incentives for private industry and government entities to remove obsolete, aged structures by accepting dam removal as a means of river restoration. Much of the foundation for these decisions is not based on scientific research, but rather the
assumption that dam removal alleviates the well-documented negative impacts dams have on river ecosystems (e.g., impede fish migrations, low dissolved oxygen concentrations, population isolation).
the smothering of benthic organisms (e.g., Sethi et al., 2004) while concentrated loads of N and P can impair sensitive receiving waters (as determined by the EPA’s TMDL standards). Since dam removal is likely to result in downstream disturbances, several questions regarding such perturbations must be resolved in order to use dam removal for river restoration. First, what is the role of floods on impounded material export, and is dam removal a larger disturbance than natural floods? Second, can a multiple stage demolition strategy reduce the export of sediment, organic matter, and inorganic
nutrients? Third, what is the spatial extent of disturbance caused by the export of various impounded materials (dissolved vs. particulate) routed through downstream channel networks? Finally, are there regional and structural (i.e. impoundment channel morphology as controlled by dam dimensions) controls on the degree of downstream disturbance following dam removal?
Assessing Impacts of Dam Removal on Downstream Water Quality
Newton et al., 2002). As stored materials within former impoundments are likely exported more effectively during episodic events (flood and stages of dam demolition) with varying water loads, the use of sediment, carbon and nitrogen budgets (i.e. loads) provide greater resolution for drawing inter-event comparisons. Further, impoundment dewatering, breaching or removal may release significant quantities of stored water, and reports of concentrations may mask the resulting water quality impacts, especially when compared to upstream input flows characterized by lower discharges.
Once impounded materials are released from a reservoir, concern shifts to the routing of the various materials, which will likely be routed differently through downstream channel networks. For instance, previous studies of sediment loads from impoundments have primarily documented or modeled the bed load transport following dam removal, and these studies have shown that bed load sediment fluxes are
concentrated immediately downstream of the dam (Lisle et al., 2001; Wohl and Cenderelli, 2000). Conversely, it is expected that the release of dissolved impounded materials (dissolved C and N, in particular) could be transported well beyond a dam’s immediate vicinity, possibly reaching sensitive downstream receiving water bodies such as coastal ecosystems or drinking water reservoirs.
Distinct flood waves are produced during dewatering events, which can be monitored at multiple points during the routing process to quantify the concentrations and/or loads of various transported materials. Such an investigation can provide insight regarding how different physical fractions of materials are conveyed through channel networks during floods. Additionally, potential spatial heterogeneity among sediment and nutrient disturbances caused by dam removal are important to consider when dam removal is used for river restoration.
downstream impacts of dam removal. However, other reservoirs, particularly in low-gradient regions, inundate the channel as well as riparian zones and adjacent floodplains. In these cases, there is an increased chance that sediments and nutrients will be flushed out of these inundated riparian areas, potentially increasing loads released downstream. We lack an understanding of the role of such variable source areas of sediment and nutrients within impoundments recovering from dam removal, and how these areas contribute to loads transported downstream. Thus, it is important to isolate the relative contributions of channel and floodplain sources of water, sediment, and nutrients within a reservoir to downstream loads to better anticipate consequences of dam removal.
Purpose and Structure of Paper
Lowell Mill Dam on the Little River, Johnston County, North Carolina was removed in multiple stages from August 2004 to December 2005 (Figure 2.1). We generated multiple short-term hydrologic, suspended sediment and nutrient budgets at different times during the removal process and at different distances from the removal site to quantify fluxes of total suspended solids (TSS), total dissolved nitrogen (TDN) and dissolved organic carbon (DOC) with four purposes in mind: 1) compare the water
STUDY AREA
The Little River is a 4th order tributary of the Neuse River located in the lower piedmont and upper coastal plain physiographic regions of North Carolina. Land use within its 600 km2 drainage basin is comprised of 44% forest, 39% agriculture, 12% wetland and 5% developed. Impoundment bed sediment was a matrix-supported sand and gravel mixture with a thin veneer of fine sediments (<1%) which, during baseline data collection, exhibited fining in the downstream direction (Table 2.1). Bank and floodplain soils were composed of fine sands, silts, and clays supporting bottomland hardwood forest wetland ecosystems.
Lowell Mill Dam, constructed c.a. 1902, was a low-head, run-of-river structure that provided ~3 m of head storage to support grist mill operations. The majority of the 8 km impoundment was confined to ~175,500 m2 of river channel (Figure 2.1). However, there were two prominent areas where the reservoir permanently inundated adjacent low-lying floodplain wetlands (Figure 1). This accounted for ~ 200,000 m2 of inundated floodplain wetlands, with an average depth of ~1 m.
METHODS
Dam Removal Phases
second was removed on 11 August 2004. Less than one meter of head was lost from the impoundment over the four day period. Water surface grade was controlled by the elevation of the downstream cell wall breach, which was ~ 2.25 m above the bed surface grade. The second gate removal event took place on 28 April 2005, at which time two flashboards were removed from the second wheel housing cell in ~ 2-2.5 hours. During this phase, the water surface grade was controlled by the draft hole present at the bottom of the cell, which induced more than 1m of head loss within the impoundment. This second event was the most punctuated head loss and the most intensely studied (referred to as dewatering). The dewatering generated a flood wave that passed through the downstream reach (19.2 km) over a course of ~ 30 hours (Figure 2.2). Shortly after the dewatering (6 days), precipitation produced a flood that filled the banks of the recently dewatered system. The resulting flood wave persisted from 06 May 2005 to 11 May 2005 (Figure 2.2).
The dam was breached-to-grade on 15 December 2005 by completely removing the wheel housing. Two separate precipitation events produced a flood with two distinct discharge peaks (Qpeak) with a duration of eight days (Figure 2.2). Shortly following the
Sampling Design
Sampling locations
We generated multiple short-term hydrologic, suspended sediment and nutrient budgets at different times since removal and at different distances from the removal site (Figure 2.1). This approach treated the impoundment as a distinct spatial unit with one major channel input (-11.6 km upstream from dam; note, negative values indicate distance upstream from dam), 2 wetland inputs (-3 km and -2 km from dam) and one output (+0.4 km from dam). Within the impoundment, sampling stations were positioned upstream, within and downstream of both confluences with the river and wetland
complex (referred to as wetland stations; Figure 2.1 inset). Downstream bridge stations (+1.6 km, +4.2 km, +9.6 km and +19.2 km; Figure 2.1) were used to monitor sediment and nutrient routing through the downstream reach. Wetland and bridge stations were sampled during the dewatering event only, while impoundment input (-11.6 km) and output (+0.4 km) stations were sampled during every event (Table 2.2). USGS stream gage station #02088500 is located +10 km downstream of the dam (Figure 2.1), and was used to generate reach-scale hydrologic budgets for all events.
Dewatering event
Sampling at river input and output stations (-11.6 km and +0.4 km) was
hourly for the first 8 hours of the dewatering. All stations produced a number of samples during each sample period (described in detail below) for TSS, DOC, TDN, and
dissolved inorganic nitrogen (DIN), which includes NH4-N, NO3 -N and NO2-N.
Sampling efforts at bridge stations were maintained for the duration of the dewatering (30 hours), although the frequency decreased from hourly during the first 10 hours to every other hour thereafter. Wetland sampling efforts were initiated before gate removal, and continued until all surface water drained into the channel as determined by Q
measurements (described in detail below).
Breaching, removal, flood events
TSS, DOC, DIN and TDN sample collection was limited to impoundment input and output stations only. Samples were collected from 05 May 2005 to 11 May 2005 at 2-hour intervals for the post-dewatering flood. Sampling during the breaching/flood was conducted from 15 December 2005 to 23 December 2005 at no more than 4-hour
Hydrology
The USGS gage (#02088500) located 10 km below Lowell Mill Dam was used to quantify discharge (Q) from 1 April 2005 to 31 January, 2006 (Figure 2.2). No perennial
tributaries contribute significantly to river discharge for the 19.2 km study reach
downstream of the dam. USGS 15-min interval data were used to produce hydrographs associated with dam demolition and flood events. During the dewatering, gage data were used to quantify total volume released from the impoundment, and the duration of the dewatering flood wave. We assumed the same hydrologic budget for all bridge stations during this event. During all other monitored events, gage data were used to quantify the volume of water that passed through the impoundment.
Hydrological budgets of the dewatering wetlands and upstream river inputs were produced using channel cross sectional area and velocity measurements. Upstream river input measurements were collected hourly at station -11.6 km. Dewatering wetland measurements were collected at stations located immediately upstream and downstream of the wetland confluences. Channel cross sectional surveys were completed before the dewatering from 25 April 2005 to 27 April 2005) during which time flows were near baseflow discharge values (~1.8 m3s-1). During the dewatering, area and velocity measurements were made at each wetland sampling station (Figure 2.1 inset). Velocity measurements were collected using either a Marsh-McBirney current meter or a Sontek
each wetland confluence were assumed to be impounded wetland surface water draining into the river channel.
Total suspended solids
Impoundment input and output stations were sampled from 1 L composites at 1-2 hour intervals. During the dewatering event, a 250 mL HDPE bottle was filled from a 4 L composite of grab samples collected from 5 points across each bridge station cross section during each sample period. Wetland sampling teams collected 250 mL grab samples from the channel thalweg. TSS samples were shaken and known volumes were filtered through pre-weighed glass fiber filters (ProWeigh filters, Environmental
Express), dried at 110oC for at least 24 hours, desiccated and reweighed for TSS (APHA Standard Methods procedure 2540D).
Biogeochemistry
analyzer coupled with a TNM-1 unit. Dissolved organic nitrogen (DON) fractions of each sample were determined by subtracting DIN concentrations from TDN
concentrations.
Budget calculations
Budgets for TSS, DOC and TDN were calculated by multiplying concentrations by water load for each time interval. Fluxes for all sampling periods were summed across an event to get total mass at a given sampling station. Concentration data at river input and output stations were analyzed for significant differences using two-tailed, paired t-tests. Analyses were performed for each event for TSS, DOC and TDN.
RESULTS Hydrology
The impoundment dewatering produced a small downstream flood wave that lasted ~ 30 hours with a Qpeak of 3.2 m3s-1, which is insignificant compared to common
floods associated with the system’s natural flow regime (Figure 2.2). Upstream values remained constant throughout the dewatering at 1.7 m3s-1. Integration of the dewatering hydrograph showed that ~ 40,100 m3 of stored water was released from the
Six days after the dewatering, precipitation generated a near bankfull flood. The flood occurred from 06 May 2005 to 11 May 2005 with a Qpeak of 20.2 m3s-1 on 07 May
2005, or 5.1 x 10⁶ m3 of water passing through the impoundment during the post-dewatering event. This flood was within the Q range of a one year flood (18-32 m3s-1;
based on 72 years of gage records).
Immediately following the breaching of Lowell Mill Dam, two precipitation events produced high discharges. High Q levels occurred from 15 December 2005 to 25
December 2005 with two distinct Qpeak values on 17 December 2005 (11.4 m3s-1) and 19
December 2005 (11.7 m3s-1). Based on hydrograph integration, ~ 6.07 x 10⁶ m3 of water passed through the study reach over the 10 day post-breaching period.
Similar to the breaching, a precipitation event immediately followed the removal of the remaining structures of Lowell Mill Dam (28 December 2005). Initial
precipitation was followed by additional rain on 02 January 2006. The resulting flood produced two distinct Qpeak values 30 December 2005 (13.37 m3s-1) and 04 January 2006
(11.92 m3s-1). This flood transported 8.67 x 10⁶ m3 of surface water through the reach during the post-removal period.
Total suspended solids
following gate removal, the system began to export significantly more TSS from the impoundment than upstream sources imported (Figure 2.3a). Mean TSS input
concentrations following gate removal were 3 mg/L, while mean export concentrations were 8 mg/L (n = 38, t = 10.2746, p < 0.001; Figure 2.3e). Over the course of the dewatering, TSS loads entering the impoundment were 658 kg compared to 1735 kg exiting (Figure 2.3f), resulting in a TSSout:TSSin ratio of 2.43 (Table 2.3). The floodplain wetlands accounted for 136 kg (13%) of the 1077 kg of TSS transported from the
impoundment whereas the wetlands contributed 44% of the water load. Thus, based on the wetland water load contribution, the wetlands diluted the TSS concentrations exiting the impoundment.
Excess TSS routed downstream of the dam was effectively attenuated within the 10 km (Figure 2.4). Of the 1735 kg of TSS exiting the reservoir, only 712 kg passed the bridge station +9.6 km. This load is comparable to the load entering the upstream end of the reservoir, 658 kg. Thus, excess TSS derived from the impoundment was deposited within 10 km of the dam.
mg/L, respectively (input > output; n = 94, t = -6.4523, p < 0.001; Figure 2.3e and 2.3f). Effectively, the impoundment stored 31 metric tons of TSS during the post-dewatering flood. This is ~30 times the TSS load exported during the dewatering event; TSSout:TSSin ratio equaled 0.76 (Table 2.3).
During the breaching/flood, output concentrations were significantly higher than input concentrations (n = 62, t = 6.826812, p < 0.001). The Little River carried 75 metric tons of TSS into Lowell Mill Impoundment with a mean concentration of 13 mg/L. Over the same time period, 104 metric tons of TSS were exported, with a mean concentration of 19 mg/L, a 29 metric ton enrichment (Figures 2.3c, 2.3e, and 2.3f); TSSout:TSSin ratio equaled 1.37 (Table 2.3).
During the removal/flood, river inputs delivered 124 metric tons of TSS to the former impoundment with a mean concentration of 13 mg/L, while 218 metric tons with a mean concentration of 23 mg/L were exported from the impoundment. Output
Dissolved organic carbon
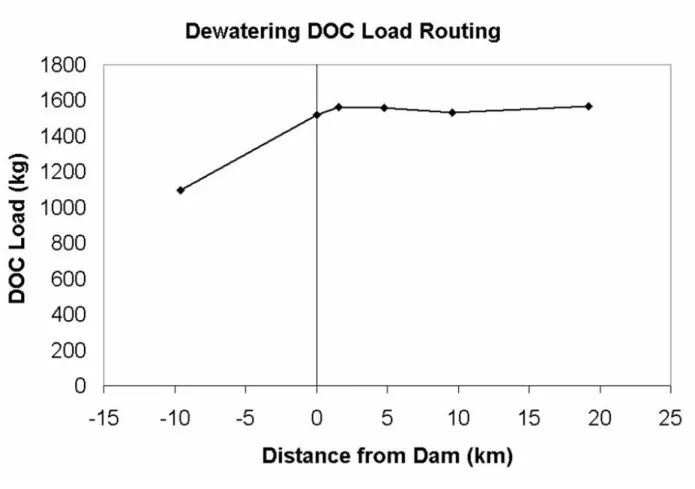
Baseline sampling for DOC was limited to 7 paired samples, and differences between input and output data sets were not significant (n = 7, t = 0.87, p < 0.5). The mean baseline concentration entering the impoundment was 7.8 mg/L, and 7.0 mg/L exiting the impoundment. During the dewatering, upstream inputs of DOC produced a total load of 1094 kg with a mean concentration of 6.4 mg/L, while downstream DOC exports totaled 1517 kg of DOC with a mean concentration of 7.2 mg/L (Figures 2.5a, 2.5e and 2.5f). DOC output concentrations were significantly higher than inputs (n = 45, t = 7.58, p < 0.001); DOCout:DOCin equaled 1.39 (Table 2.3). This represents a 39% increase in the DOC load. Wetland contributions of DOC accounted for 209 kg, or 49% of the total contributed impoundment DOC load compared to 44% of the total water load coming from the wetlands. Thus, impounded floodplain wetlands were slightly
concentrated sources of DOC as these areas contributed 44% of the total water load. This DOC load increased from 1517 kg at the output station to 1576 kg at the +4.8 km bridge and 1533 kg at the +19.2 km bridge (Figure 2.6). That is, the DOC load exported from the impoundment did not decrease, but increased slightly during downstream routing.
metric tons with a mean concentration of 8.2 mg/L (Figures 2.5e and 2.5f). This represents an enrichment of 17% during the post-dewatering flood.
The breaching/flood produced another pulse of DOC with input and output loads totaling 41 and 48 metric tons, respectively (Figures 2.5c and 2.5f). Output
concentrations were significantly higher than input concentrations (n = 64, t = 6.83, p < 0.001). Mean input concentrations were 7.3 mg/L, and mean output concentrations were 8.3 mg/L (Figure 2.5e). This event caused a DOC enrichment of 17%.
During the removal/flood, the input DOC load totaled 60 metric tons, while the output load totaled 72 metric tons (Figures 2.5d and 2.5f). Downstream concentrations (mean = 8.5 mg/L) were significantly higher than upstream input concentrations (mean = 7.1 mg/L; n = 80, t = 18.29, p < 0.001; Figure 2.5e). This represents the greatest load of DOC from the former impoundment, and an enrichment of 12 metric tons or 20%.
Dissolved nitrogen
2.7f). Wetland inputs during the dewatering accounted for 14 kg, or 33%, of the
impoundment’s 42 kg contribution. While the dewatering wetlands were a considerable source of TDN, they were diluted compared to channel sources. TDN released from the impoundment during the baseflow dewatering event was comprised of 95% DIN, while wetland TDN entering the channel was 69% DIN. Downstream routing increased TDN loads from the dam to the +19.2 km bridge (Figure 2.8). TDN loads exiting the
impoundment were 147 kg, while the load at the 19.2 km bridge was 160 kg. Similar to DOC routing, the TDN load did not decrease, but actually increased slightly with distance downstream.
Post-dewatering flood flows were characterized by a mean upstream TDN concentration of 0.59 mg/L, which was significantly less than the mean downstream concentration of 0.67 mg/L (n=96, t = 8.78, p < 0.001, Figures 2.7b and 2.7e). Input loads equaled 2882 kg while output loads were 3587 kg (Figure 2.7f). TDN exiting the impoundment was approximately 45% DIN. Impoundment derived N enriched channel waters by 24%.
Impoundment contributions of TDN during the breaching/flood loaded an
2.7c and 2.7e). 57% of the TDN entering the impoundment was comprised of DIN, while DIN accounted for 59% of the TDN exiting.
The removal/flood produced the greatest TDN loading in the series of monitored events. TDN loads entering and exiting the former impoundment equaled 3.7 and 5.0 metric tons, respectively (Figures 2.7d and 2.7f). Again, mean concentrations entering the former impoundment (0.45 mg/L) were significantly lower than those exiting the impoundment (0.61 mg/L; n = 80, t = 21.02, p < 0.001; Figure 2.7e). Impoundment contributions of TDN during this event enriched river water by 35%. DIN represented 29% of TDN exported from the impoundment.
DISCUSSION
Removal strategies and water quality impacts: dewatering to removal
exported from the former impoundment appeared to be a function of the degree of grade change and Q. Grade adjustments caused by dam removal increase channel slope which
in turn increases velocity and thus, transport capacity within these significantly aggraded reaches. Increased transport capacity erodes (and suspends) accumulated sediments, which can also lead to the release of TDN and DOC from the sediment matrix.
Previous dam removals have been conducted without the use of a dewatering step. Such removals involving a full reservoir may use either the “blow and go” method of complete demolition using explosives (e.g. Embrey Dam, VA; USACE, 2004), or the breach-to-grade approach (e.g., Rockdale Dam, WI; Doyle et al., 2003). If
impoundments with significant retentive capacities are subjected to these removal strategies, there will be appreciable loads of stored materials released to downstream environments. Such systems impound significant quantities of water which will be immediately subjected to drastic grade alterations. Further, the materials contained within impounded channels are often completely saturated, and are therefore easily suspended and transported downstream.
Context for comparing water quality impacts of dam removal
helpful to consider during the dam removal planning process. We assert that the disturbances (i.e. concentrations and loads) associated with dam removal should be compared to those during floods within the same system, rather than comparing the impacts of dam removal with baseflow conditions. For example, for the Little River during our study period, the maximum natural loads of TSS, DOC and TDN (i.e., the maximum input loads observed during any of the multiple floods reported here) were 127, 60, and 3.7 metric tons, respectively (Figures 2.3f, 2.5f and 2.7f). In comparison, the maximum loads generated by dam removal were 218 (TSS), 72 (DOC) and 5 (TDN) metric tons, all of which were released during the removal/flood event. This translates to ratios of removal export to maximum natural loads for similar storm events of 1.71 for TSS, 1.2 for DOC and 1.35 for TDN. Thus, floods intensified the export of TSS, DOC and TDN from the impoundment. This flood intensification, however, resulted in only modest levels of enrichment; this will not necessarily be the case for all dam removals (discussed below).
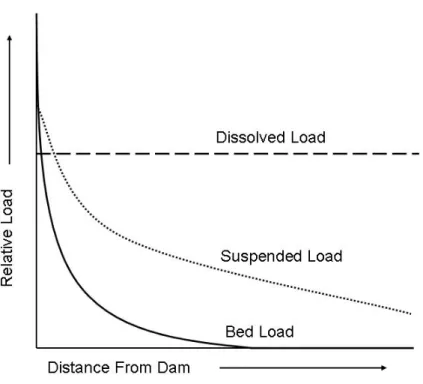
Routing of dissolved versus particulate loads through downstream channels We conclude, based on the routing data set, that particulate and dissolved materials released from a reservoir are routed differently through downstream channel networks (Figure 2.4, 2.6 and 2.8). These data suggest that the mixture of materials transported by flood waves exhibit spatially heterogeneous patterns of transport and deposition (Figure 2.9). Different sized particles are transported by separate mechanisms, e.g., suspension of fine constituents, saltation of coarse constituents, and washload
reservoir will be delivered downstream as a function of these different mechanisms and their respective rates of transport, which will in turn affect the spatial impacts of dam removal on downstream reaches, particularly, the concentration or load of sediment or nutrients observed with distance downstream from a removed dam. How these different constituents are transported can be thought of along a continuum of dispersion to
advection. If constituents are transported primarily through advection, then the concentrations will be large in the downstream direction, with some decrease in peak concentration, but not in total load with distance downstream from the removed dam, although the elevated concentration will also be brief. In contrast, if constituents are dispersed as they are translated (e.g., a dispersive sediment wave), then the peak concentration and total load following dam removal will decrease with distance
downstream from the dam, although the duration of elevated concentrations will extend over a longer period of time.
expected to remain constant with distance downstream. If dissolved and bed load materials represent opposite ends of the dispersive-advective continuum, then suspended loads mobilized by dam removal should be subjected to both advection and dispersion, and thus experience some combination of advection and dispersion.
TSS load calculations at various points along the 19.2 km reach downstream of Lowell Mill Dam show a reduction by an order of magnitude within the first 10 km (Figures 2.4 and 2.9). Similarly, a reduction of TSS concentrations was reported over a 4 km distance following dam removal on the Koshkonong River (Doyle et al., 2003a). Therefore, the sedimentation associated with suspended material represent a diffusive pattern with greater impacts seen in close proximity to the former dam site, and limited impacts with distance downstream. Part of the reduction in suspended sediment
concentration may be associated with dispersion, whereas part of it could be the result of retention of sediment within the reach (i.e., load reduction). Either way, the impact of suspended sediment mobilization following dam removal appeared to be greatest in the ~100 – 101 km downstream of removed dams.
importance as TMDLs for downstream environments could be violated by dam removal activities occurring far upstream if advection is dominant and if there is very little loss of constituents with distance through the channel network. For N in particular, this final point is expected for all dam removals taking place on larger rivers, but significant reductions in dissolved loads could be seen in smaller systems (Alexander et al., 2000).
Based on the available studies and our current understanding of solute and sediment transport in channel networks, it appears that dissolved constituents will be transported by floods and dam removals over channel distances of ~101 km with little change in the peak concentrations or total loads transported (i.e., limited retention). Over similar distances from a removed dam, there will be transport of suspended sediment, but an increasing degree of both retention (i.e., load removal via deposition in the channel) as well as dispersion of the sediment. This will result in reduced peak concentrations and loads of suspended sediment with distance downstream. Finally, bedload should be primarily dispersed and retained within the first few km of a removed dam, with drastic spatial changes in the peak bedload concentrations with distance downstream and limited impacts to further downstream reaches.
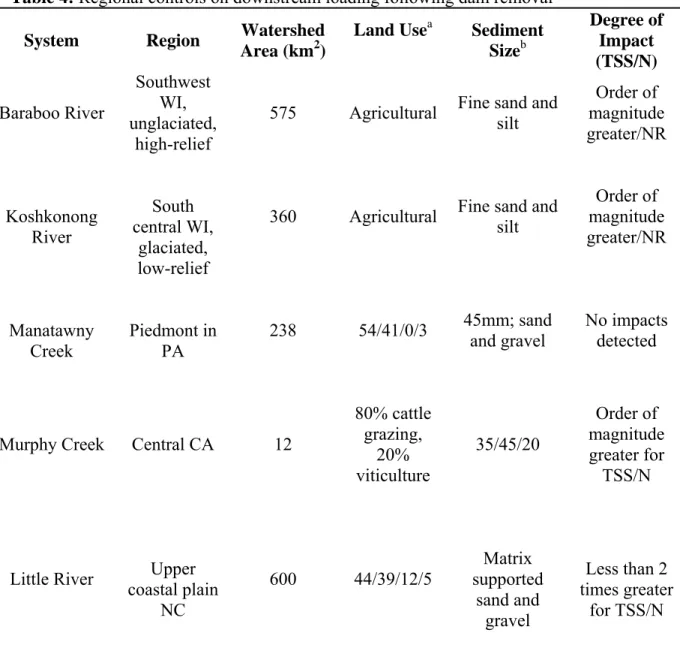
Regional and structural controls on downstream impacts of dam removal One of the prevailing interests in dam removal involves the unintended
environments (Doyle et al. 2003, Bushaw-Newton, 2001; Ahearn and Dahlgren, 2005). Doyle et al. (2003) found, TSSout:TSSin >14 during the 48 hours following dam breaching (Table 4). In addition, Ahearn and Dahlgren (2005) quantified annual TSS loads for Murphy Creek, California showing that annual TSS loads after removal were 27 to 35 times greater than annual pre-removal loads (Table 2.4). Conversely, TSS loads downstream of Lowell Mill Dam (this present study) were not as drastic as seen on Murphy Creek or Koshkonong River, and were more comparable to Manatawney Creek, Pennsylvania, in which sediment concentration changes were not detected (Table 2.4). In fact, the greatest TSSout:TSSin during the Little River removal was 1.76 (Table 2.3), an order of magnitude less than those load ratios seen for either Murphy Creek or the
Koshkonong River. In the case of N, Murphy Creek post-removal TN loads were 7.75 to 7.82 times greater than pre-removal loads. While the maximum Little River
TDNout:TDNin was 1.4. The Manatawny Creek dam removal reportedly had no effect on spatial variations of water chemistry (e.g. upstream and downstream measures for
inorganic N and P were not significantly different before or after dam removal). Thus, based on TSS and available N data, there appears to be wide discrepancy in the amount of materials removed from reservoirs following dam removal, with the Koshkonong and Murphy Creek removals representing extremely high export loads, and the Manatawny Creek and Little River removals representing relatively limited export loads.
relationships regarding sediment and N budgets. Second, TN and TDN are different physical fractions of N. However, while such comparisons are limited, they do provide valuable insights into regional controls on impoundment loading.
Differences in the exported loads of TSS and N presented above may be explained by both regional and structural controls. Sediment grain size distribution, watershed land use and the retentive capacity of reservoirs are important factors which could control downstream impacts following dam removal (Stanley and Doyle, 2002). The Koshkonong River is located within an agricultural watershed with a contribution area of 360 km2. The sediments within the impounded Koshkonong reach were
composed primarily of fine sand and silt. Because the reservoir was > 150 years old in an agricultural watershed and because its impoundment was much wider than the main river channel (impoundment width > 200 m compared to river width ~ 15 m), it was
completely filled with a large quantity of very fine-grained, nutrient-rich sediment. When the dam was removed the reservoir became a substantial source of fine sediment to downstream reaches. Murphy Creek drains a 12 km2 watershed dominated by cattle-grazing and viticulture, and the impoundment ws also much wider than the stream channel (Ahearn and Dahlgren, 2005). Post-removal data presented for the site located closest to the dam reveal sediments were dominated by sand and silt, and thus were somewhat similar to the Koshkonong conditions. In contrast, Manatawny Creek
gravel. Thus, suspended sediment loads following dam removal on the Manatawny were limited compared to the Koshkonong River and Murphy Creek removals, but similar to our data.
over time, and when the dam is removed, these sources of sediment are accessed, and result in substantially larger exports downstream. In all, we suggest that in addition to land use and regional geology, the width of the reservoir relative to the width of the river channel is a potential first indicator of the relative impact of removal in comparison to loads brought in from upstream.
contribute more TSS, TDN and DOC from floodplain sources, ultimately resulting in greater loads delivered to downstream environments.
CONCLUSIONS
Dam removal is considered a disturbance throughout the removal literature, but direct comparisons to other natural disturbances have not been drawn with actual data previous to this study. Such comparisons are needed to aid in decision making for the numerous dam removals likely to occur in coming years. We found that while floods on
the Little River intensified the export of previously impounded materials, the resulting loads carried downstream were comparable to those of natural floods (Table 2.3). This is not the case on all rivers, but this comparative approach can provide context by which the downstream impacts of future removals can be judged.
When viewed as a disturbance, dam removal can initiate fundamental alterations within river ecosystems along various temporal and spatial scales. If a secondary disturbance follows an event such as dam removal, the resistance of the system is likely reduced, forcing changes in the physical structure of these former impoundments. Doyle et al. (2002) offer a conceptual model of geomorphic change induced by a flood
following dam removal. The model simply states that the degree of geomorphic change caused by a flood event is a function of time since the removal. As the reservoir
some extent controlled, by the size and quantity of sediments stored within reservoirs. If sediments are not stabilized, their reorganization or mobilization can release organic and inorganic forms of C, N and P to downstream environments.
The objectives of river restoration projects are important to consider when
determining the timing of demolition activities (i.e., dewatering, breaching and removal). Because floods occurring during the sensitive recovery period following dam removal intensify the export of impounded materials, these episodic events are expected to have strongly divergent effects at different points along the river. In such situations, the same flood can accelerate the recovery of the former impoundment by excavating accumulated materials, while subjecting the downstream environment to a possibly catastrophic disturbance, forcing the downstream system to assume a new steady state. Thus, removal activities should be scheduled such that local seasonal hydrology does not interfere with restoration objectives. If, for example, a dam removal is used to restore channel habitat within an impoundment, then floods will accelerate the rehabilitation process. However, if removal activities are conducted during low flow seasons, recovering reaches may permanently retain significant fractions of impounded materials.
REFERENCES
Ahearn DS and Dahlgren RA. 2005. Sediment and nutrient dynamics following a low-head dam removal at Murphy Creek, California. Limnology and Oceanography 50:
1752-1762.
Alexander RB. Smith RA. and Schwarz GE. 2000. Effect of stream channel size on the delivery of nitrogen to the Gulf of Mexico. Nature 403: 758-761.
Bushaw-Newton KL, Hart DD, Pizzuto JE, et al. 2002. An integrative approach towards understanding ecological responses to dam removal: The Manatawny Creek study.
Journal of the American Water Resources Association 38: 1581-1599.
Doyle MW, Stanley EH, and Harbor JM. 2003. Channel adjustments following two dam removals in Wisconsin. Water Resources Research 36: 1147, doi:
10.1029/2003WR002038, 2003.
Doyle MW, Stanley EH, Strayer DL, Jacobson RB, Schmidt, JC. 2005. Effective
discharge analysis of ecological processes in streams. Water Resources Research 41:
W11411, doi:10.1029/2005WR004222, 2005.
Graf WL. 2005. Geomorphology and American dams: The scientific, social, and economic context. Geomorphology, 71(1-2): 3-26.
Gray LJ, and Ward JV. 1982. Effects of sediment release on macroinvertebrates.
Hydrobiologia 96: 177-184.
Lisle, TE, Cui Y, Parker G, Pizzuto JE, and Dodd AM. 2001. The dominance of
dispersion in the evolution of bed material waves in gravel-bed rivers. Earth Surface Processes and Landforms 26: 1409-1422.
Perrin CJ, Ashley KI, and Larkin GA. 2000. Effects of drawdown on ammonium and iron concentrations in a coastal mountain reservoir. Water Quality Research Journal of Canada 35: 231-44.
Sethi, SA, Selle AR, Doyle MW, Stanley EH, and Kitchel HE. 2004. Response of unionid mussels to dam removal in Koshkonong Creek, Wisconsin (USA).
Hydrobiologia 525:157-165.
Stanley EH, and Doyle MW. 2002. A geomorphic perspective on nutrient retention following dam removal. BioScience 52: 693-701.
Wohl EE, and Cenderelli DA. 2000. Sediment deposition and transport patterns following a reservoir sediment release. Water Resources Research 36: 319-333.
Table 1: Bed surface grain size analysisa
Distance from dam (km)b D16 (mm) D50 (mm) D84 (mm)
-9.7 0.25 8 64
-6.4 0.5 2 16
-3.2 0.5 16 64
-1.6 0.25 0.5 2
-0.8 0.25 0.5 0.5
-0.4 0.125 0.25 0.25
0.4 0.5 16 64
0.8 0.25 0.5 8
1.6 0.5 64 64
3.2 2-4 32 64
6.4 0.5 8 32
9.7 0.5 0.5 8
aD16, D50 and D84 values were determined based on mass b negative values denote site located upstream of dam
Table 2: Sampling station use summary Station Location
(km from dam)
Events Sampled Frequency of
sample collection
Parameters sampled
-11.6 (input) 1, 2, 3 and 4 1,2 or 4-hour intervals
TSS, DOC, TDN, Q
-3 (wetland) 1 1-hour intervals TSS, DOC, TDN, Q
-2 (wetland) 1 1-hour intervals TSS, DOC, TDN, Q
+0.4 (output) 1, 2, 3 and 4 1,2 or 4-intervals TSS, DOC, TDN +1.6 (bridge) 1 1 to 2- hour intervals TSS, DOC, TDN +4.8 (bridge) 1 1 to 2-hour intervals TSS, DOC, TDN +9.6 (bridge) 1 1 to 2-hour intervals TSS, DOC, TDN +19.2 (bridge) 1 1 to 2-hour intervals TSS, DOC, TDN
1 dewatering
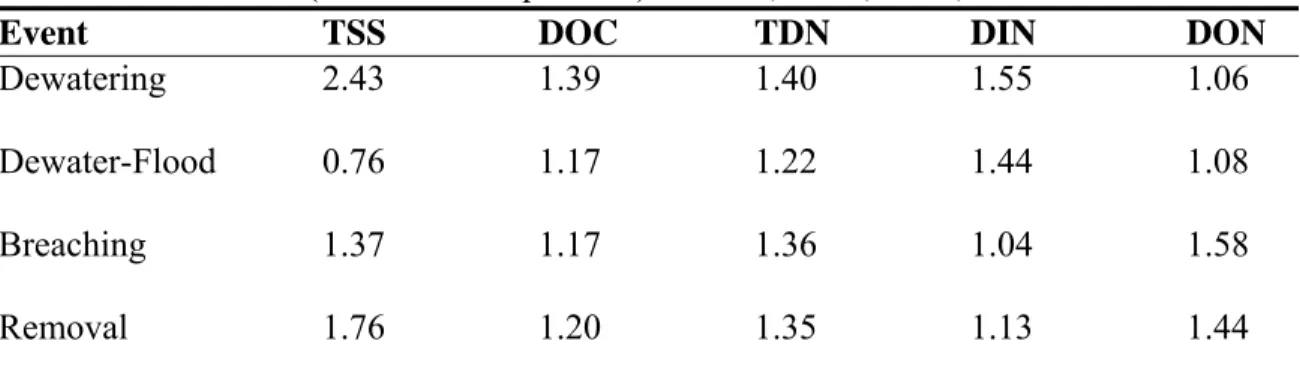
Table 3: Load ratios (downstream/upstream) for TSS, DOC, TDN, DIN and DON
Event TSS DOC TDN DIN DON
Dewatering 2.43 1.39 1.40 1.55 1.06
Dewater-Flood 0.76 1.17 1.22 1.44 1.08
Breaching 1.37 1.17 1.36 1.04 1.58
Table 4: Regional controls on downstream loading following dam removal
System Region Watershed
Area (km2)
Land Usea Sediment
Sizeb Degree of Impact (TSS/N) Baraboo River Southwest WI, unglaciated, high-relief
575 Agricultural Fine sand and silt
Order of magnitude greater/NR Koshkonong River South central WI, glaciated, low-relief
360 Agricultural Fine sand and silt Order of magnitude greater/NR Manatawny Creek Piedmont in PA
238 54/41/0/3 45mm; sand and gravel
No impacts detected
Murphy Creek Central CA 12
80% cattle grazing, 20% viticulture 35/45/20 Order of magnitude greater for TSS/N
Little River coastal plain Upper NC 600 44/39/12/5 Matrix supported sand and gravel
Less than 2 times greater
for TSS/N
a
values reported as %forest/agriculture/wetland/developed
b
values reported as D50 or %sand/silt/clay
Figure 2.1: Study Reach: Lowell Mill Dam Impoundment located on the Little River in Johnston County,
Figure 2.2: Little River hydrograph (April 2005 to January 2006). Arrows along x-axis indicate dam
Figure 2.3: TSS Concentrations and loads during the removal of Lowell Mill Dam. Figures a-d: primary
Figure 2.4: Downstream routing of TSS during the dewatering of Lowell Mill Impoundment. Vertical line
indicates the location of the dam; negative values indicate distance upstream of the dam. Excess TSS
Figure 2.5: DOC concentrations and loads during the removal of Lowell Mill Dam. Figures a-d: primary
Figure 2.6: Downstream routing of DOC during the dewatering of Lowell Mill Impoundment. Vertical
line indicates the location of the dam; negative values indicate distance upstream of the dam. TheDOC
Figure 2.7: TDN concentrations and loads during the removal of Lowell Mill Dam. Figures a-d: primary
Figure 2.8: Downstream routing of TDN during the dewatering of Lowell Mill Impoundment. Vertical
Figure 2.9: Transport of dissolved and particulate loads along the advective-dispersive continuum during
CHAPTER III: SUSPENDED SEDIMENTS IN RIVER ECOSYSTEMS: PHOTOCHEMICAL SOURCES OF DISSOLVED ORGANIC CARBON AND
ADSORPTIVE REMOVAL OF DISSOLVED IRON
Under the action of the force of gravity the land surface is sculptured by water, wind, and ice. This sculpturing produces the landforms with which geomorphology is concerned. Some if these forms owe their origins purely to denudational processes; other forms may be depositional; still others owe their existence to combinations of both processes.
- Leopold, Wolman and Miller (1964) ABSTRACT
progressively (~40-90%) in both light and dark treatments. Thus, suspended sediments in river ecosystems are a C source and an Fed sink.
INTRODUCTION
On broad spatial and temporal scales, rivers owe their origins to erosional
processes which create channels that transport hill slope materials to the world’s oceans. However, on finer scales, rivers are actually mosaics of aggrading and degrading reaches routing materials through a series of erosional and depositional zones. Biogeochemical processes within river ecosystems are governed by these smaller-scale hydrogeomorphic conditions, making rivers important sites for global biogeochemical transport and
transformation. Much scientific effort has been invested to explore links among
hydrology, geomorphology and biogeochemistry in river ecosystems, including the River Continuum Concept (Vannote et al., 1980) as well as organic matter and nutrient
spiraling (Webster and Patten, 1979; Minshall et al., 1992, 1993; Newbold, 1982, 1992). However, the biogeochemical role of suspended sediments, which are also controlled by hydrogeomorphic factors in watersheds, is less well understood.
explain DOC hysteresis during snowmelt driven floods (Hornberger et al., 1994; Boyer et al., 1997, 2000). Watershed subsurface flow paths and near stream sources in particular are repeatedly cited as variable source areas, providing DOC enrichment to channels during floods (Meyer and Tate, 1983; Tate and Meyer, 1983; McDowell and Likens, 1988; Buffam et al., 2001). Most recently, DOC quality has been used as a hydrological tracer to infer hill slope source areas during various stages of flood hydrographs (Hood et al., 2006). Nitrogen flushing from watershed source areas has also been used to explain similar trends in dissolved organic nitrogen (DON) and dissolved inorganic nitrogen (DIN) flood dynamics (Creed et al. 1996; Creed and Band, 1998a and 1998b; Buffam, 2001).
transport, and this processing represents an additional source of C, N and P to channel biogeochemistry.
Deposited fine sediments in aquatic ecosystems serve as benthic substrate with high denitrification potential (Pinay et al. 2000; Wetzel, 2001), and also as adsorptive sinks for dissolved organic matter (DOM) (McDowell and Wood, 1984; Nelson et al., 1993; Aufdenkampe et al., 2001), NH4 (Triska et al., 1994; Schlesinger, 1997) and SRP (Meyer, 1979; Klotz, 1988; Mulholland, 1992). During inter-flood periods in which quiescent conditions dominate, benthic sediments may become anoxic, producing strong redox gradients which lead to the accumulation of DOM, inorganic N, P and various reduced terminal electron acceptors such as Fe2+ in interstitial waters (Wetzel, 2001). However, when river discharge increases these sediments are resuspended and may become an internal load (i.e., not from external hill slope variable source areas) of dissolved inorganic and organic forms of C, N and P to the water column via two
pathways: interstitial water release, and desorption from sediment mineral surfaces. The concept of internal loading from anoxic hypolimnia and pore waters in lake ecosystems is well established and represents an appreciable source of P and N in mictic systems
There is some experimental evidence that suggests suspended sediments could be a considerable source of DOM to aquatic ecosystems. Reagent grade clay mineral surfaces sorbed appreciable quantities of DOM from leachate solutions, and simulated solar radiation facilitated the desorption of previously accumulated DOM (Tietjen et al., 2005). Additionally, recent experimental results, involving Mississippi River deltaic suspended solids in distilled water and artificial seawater solutions, demonstrated
photodissolution of POC (Mayer et al., 2006). Finally, turbulence may control the degree of DOC mobilized from dried sediments during sediment resuspension (Koelmans and Prevo, 2003). Collectively, these studies suggest that suspended materials, in the presence of light and turbulence, can provide a measurable supplement of DOM to river ecosystems.
In rivers, the resuspension of fine sediments likely represents a source of DOM to the water column during transport events such as floods or dam removals. As has
previously been shown, the desorption or dissolution of DOM from sediment surfaces is accelerated in the presence of light and turbulence. Further, the photochemical
perspective, the concept of internal loading from sediment suspensions offers important insight into channel biogeochemical processing of hill slope materials routed to coastal ecosystems.
Laboratory experiments replicating the resuspension of river sediments were conducted in the presence of simulated solar radiation to determine if photoassisted sediment desorption of DOM could contribute measurable fractions of DOC to the water column during flood events. Additionally, organic and inorganic forms of N and P as well as total dissolved iron (Fed) were measured to determine if the photochemical
mineralization of desorbed DOM would further enrich the water column. Thus, we tested whether the resuspension of fine sediments within river ecosystems represents an internal source of DOC, N, P and Fe.
METHODS
Overview of approach
mineralization of desorbed DOM contributes to water column nutrient enrichment during sediment suspension events (i.e., floods). Two series of experimental treatments with Deep River sediments were used: one treatment series used filtered river water, while the second used Milli-Q deionized water. All other experimental conditions were held constant for both treatment series. To accommodate for potentially active microbial communities and the complexity of coupled photoassisted desorption and photochemical mineralization, C fluxes were measured using a series of DOC and CO2 measurements in closed systems. Measured CO2 concentrations were used to calculate DIC within the water column following exposure to simulated solar radiation. Thus, DOC, DIC, and CO2 measurements were used to calculate the total photochemically mediated C flux from suspended sediment surfaces.
Hydrogeomorphic scaling
Sediment and water were collected from the Carbonton Impoundment on the Deep River in Chatham, Moore and Lee counties, NC. Sediment concentrations used in our experiments were scaled to common transport events using USGS data from two gages which envelope the reach where water and sediments were collected. The
gage has a 74 year record with 126 TSS measurements. Plots of TSS vs. Q were generated to determine the appropriate TSS concentrations at 1.5 year recurrence
intervals. We determined that the system exhibited TSS concentrations of 200-400 mg L-1 during Q1.5 events.
Solar radiation exposure was delivered to each treatment using an Atlas Suntest XLS+ solar simulator equipped with an arc xenon lamp. The lamp was calibrated to deliver radiation equivalent to the amount received by the study reach (Latitude 35o31’N, Longitude 79o21’W) during one clear summer day. The solar simulator supplies 14 KJ m-2 (equivalent to 650 W m-2) of radiation over a course of 6 hours. A forced air cooling system kept water solutions at 25oC during the exposure process. Quartz tubes were used for all treatments as quartz transmits full spectrum sunlight.
Experimental sediment and water collections
During all sampling trips, one core was collected from each of six sites within the impoundment. Cores were collected by inserting polycarbonate sleeves (without a coring device) measuring 30 cm in length and 5 cm in diameter into the soft, submerged
sediment deposits along channel margins. Sleeves were pushed into the sediments until the top was flush with the sediment surface. The top opening of each sleeve was capped, and the sleeves were removed from the sediment accumulations. A second cap was used to cover the bottom sleeve opening to hold core contents in place before the core was removed from the water column. Tape was used to seal the caps to the core sleeves, and the cores were immediately transferred to a light-proof cooler packed with ice, and transported to the laboratory. Upon arrival, cores were stored in a light-proof container at 4oC overnight.
On each sampling date, approximately 15 L of river water were collected in a location central to the six coring sites in acid washed HDPE containers. Water samples were packed on ice for transport to the laboratory. Collected river water was stored at 4oC, and filtered using 0.7 µm glass fiber filters (all filtration, unless otherwise
mentioned, was accomplished with Whatman GF/F) within 12 hours of collection.
Experimental procedures