INTERROGATING THE VISCOELASTIC PROPERTIES OF TISSUE
USING VISCOELASTIC RESPONSE (VISR) ULTRASOUND
Mallory Renée Selzo
A dissertation submitted to the faculty at the University of North Carolina at Chapel Hill
in partial fulfillment of the requirements for the degree of Doctor of Philosophy in the
Department of Biomedical Engineering in the School of Medicine.
Chapel Hill
2015
Approved by:
Caterina M. Gallippi
ABSTRACT
Mallory Renée Selzo: Interrogating the Viscoelastic Properties of Tissue using Viscoelastic Response (VisR) Ultrasound
(Under the direction of Caterina M. Gallippi)
Affecting approximately 1 in 3,500 newborn males, Duchenne muscular dystrophy (DMD) is one of the most common lethal genetic disorders in humans. Boys with DMD suffer progressive loss of muscle strength and function, leading to wheelchair dependence, cardiac and respiratory compromise, and death during young adulthood. There are currently no treatments that can halt or reverse the disease progression, and translating prospective treatments into clinical trials has been delayed by inadequate outcome measures. Current outcome measures, such as functional and muscle strength assessments, lack sensitivity to individual muscles, require subjective effort of the child, and are impacted by normal childhood growth and development.
ACKNOWLEDGEMENTS
First, I want to thank my advisor, Dr. Caterina Gallippi. I will be forever indebted to you for introducing me to ultrasound, and for your patience and guidance throughout my graduate career. The passion you show for your research is inspiring and it has been a privilege to work with you. To my dissertation committee, Drs. Paul Dayton, Mansoor Haider, Joe Kornegay, Timothy Nichols, and Gregg Trahey, I would like to thank each of you for your time, effort, and vital feedback.
There are a number of individuals that I must acknowledge for their assistance in this project. The preclinical studies would not have been possible without Amanda Bettis, Dan Bogan, Janet Bogan, Jennifer Dow, Heather Heath-Barnett, Gayle McGhee, Dr. Kathy
Spaulding, Dr. Eric Snook, Dr. Martin Styner, Dr. Jiahui Wang, and Janice Weaver. For their roles in the clinical study, thank you to Dr. Melissa Caughey, Manisha Chopra, Melrose Fisher, Dr. James Howard Jr., Regina Emmett, and Diane Meyer. Thank you also to Drs. Kathy Nightingale and Mark Palmeri for being so generous with your time and modeling expertise.
I would also like to acknowledge the members of the Gallippi lab, both past and present. Thank you for your insights, your company, and for keeping my diet coke consumption in check. Special thanks to Tomek Czernuszewicz for performing the optical experiments used in Chapters 8 and 9, and to Robert Hinson without whom I would still be waiting for my processing code to finish running.
and Bob, when you found me tracing my homework against the glass door, instead of getting mad you bought me graphics software and a light table, and for that I will always be grateful. To my sister Lindsay, you have been my biggest cheerleader since the day I was born; I would be lost without you. To my mother-in-law Sharon and brother-in-law Erick, thank you for welcoming me into the family; your love and encouragement mean the world to me. And of course, thank you to my husband Chris, who has seen me through the past 6+ years of graduate school with love and endless patience. I truly could not have done this without you and I cannot wait for what comes next.
TABLE OF CONTENTS
LIST OF TABLES ... xii
LIST OF FIGURES ... xiii
LIST OF ABBREVIATIONS ... xvii
1 Introduction ... 1
1.1 Purpose ... 1
1.2 Hypothesis ... 2
1.3 Overview ... 2
2 Clinical Background ... 4
2.1 Skeletal Muscle ... 4
2.1.1 Regeneration of Skeletal Muscle ... 6
2.1.2 Dystrophin ... 7
2.2 Duchenne Muscular Dystrophy ... 7
2.2.1 Epidemiology and Genetics ... 7
2.2.2 Pathology ... 8
2.2.3 Clinical Diagnosis ... 9
2.2.4 Natural History ... 9
2.2.5 Treatment ... 11
2.2.6 Animal Models ... 13
2.3 Summary ... 14
3 Outcome Measures in DMD ... 16
3.1 Physical Outcome Measures ... 17
3.2 Imaging Techniques ... 19
3.2.2 Ultrasound Imaging ... 22
3.3 Summary ... 22
4 Ultrasound Imaging ... 24
4.1 Basics of Ultrasound Imaging ... 24
4.1.1 Spatial Resolution ... 25
4.2 Ultrasound in DMD ... 27
4.3 Ultrasound Elasticity Imaging ... 29
4.3.1 Compressive Elastography... 29
4.3.2 Acoustic Radiation Force ... 30
4.4 Summary ... 35
5 Viscoelastic Response (VisR) Ultrasound ... 36
5.1 Introduction ... 36
5.2 Background ... 37
5.3 Methods ... 39
5.4 Results ... 43
5.5 Discussion ... 48
5.6 Conclusion ... 52
6 VisR Ultrasound in Muscle: a Pilot Study ... 54
6.1 Introduction ... 54
6.2 Background ... 55
6.3 Methods ... 57
6.4 Results ... 59
6.5 Discussion ... 64
6.6 Conclusion ... 67
7 Accounting for Mass in VisR Ultrasound ... 68
7.1 Introduction ... 68
7.2 Background ... 69
7.3 Methods ... 70
7.5 Discussion ... 76
7.6 Conclusion ... 78
8 Quantitative VisR Ultrasound... 79
8.1 Introduction ... 79
8.2 Methods ... 81
8.2.1 FEM Simulations ... 81
8.2.2 Experimental Validation with Optical Tracking ... 83
8.3 Results ... 86
8.3.1 FEM Results ... 86
8.3.2 Experimental Results ... 89
8.4 Discussion ... 91
8.5 Conclusion ... 92
9 Ultrasonic Tracking of Displacements in VisR Ultrasound ... 93
9.1 Introduction ... 93
9.2 Methods ... 95
9.2.1 Simulation of Ultrasonic Displacement Tracking ... 95
9.2.2 Displacement Underestimation Correction Using Shear Waves ... 96
9.3 Results ... 97
9.3.1 Ultrasonic Displacement Tracking Simulated Results ... 97
9.3.2 Displacement Underestimation Correction Results ... 97
9.4 Discussion ... 100
9.5 Conclusion ... 103
10 Distinguishing Viscous from Elastic Properties in VisR Ultrasound ... 104
10.1 Introduction ... 104
10.2 Methods ... 105
10.2.1 FEM Simulations ... 105
10.2.2 Experimental Validation in Gelatin Phantom ... 105
10.3.1 FEM Results ... 106
10.3.2 Experimental Results ... 107
10.4 Discussion ... 108
10.5 Conclusion ... 109
11 Noninvasive Discrimination of Muscle Degeneration in Canine Models of Duchenne Muscular Dystrophy by VisR Ultrasound ... 111
11.1 Introduction ... 111
11.2 Methods ... 111
11.2.1 VisR Imaging ... 112
11.2.2 MR Imaging ... 113
11.2.3 Histology... 113
11.3 Results ... 114
11.3.1 Cross-Sectional Study ... 116
11.3.2 Longitudinal Study ... 122
11.4 Discussion ... 128
11.5 Conclusion ... 130
12 VisR Ultrasound Assessment of Viscoelastic Properties in Human Duchenne Muscular Dystrophy, In Vivo ... 131
12.1 Introduction ... 131
12.2 Methods ... 131
12.2.1 Subjects ... 131
12.2.2 VisR Imaging ... 132
12.2.3 Physical Testing ... 132
12.3 Results ... 133
12.3.1 VisR Imaging ... 133
12.3.2 Physical Testing ... 137
12.4 Discussion ... 138
13 Conclusions and Future Work ... 141
13.1 Conclusions ... 141
13.2 Future Work ... 142
A Validation of Voigt Material Model ... 145
A.1 Introduction ... 145
A.2 Background ... 145
A.2.1 Voigt Model ... 145
A.2.2 Zener Model ... 146
A.3 Methods ... 147
A.4 Results ... 149
A.5 Discussion and Conclusion ... 150
REFERENCES ... 152
LIST OF TABLES
Table 3.1: MRI signal characteristics of muscle components ... 20
Table 5.1: Phantom formulations ... 42
Table 6.1: VisR in control phantom ... 67
Table 6.2: Single acquisition of VisR in porcine muscle ... 67
Table 6.3: 3 Repeated acquisitions of VisR in pig muscle ... 67
Table 8.1: Phantom formulations ... 84
Table 12.1: Standardized patient positioning for QMT ... 133
LIST OF FIGURES
Figure 2.1: Structure of striated muscle ... 5
Figure 2.2: Illustration of the dystrophin protein ... 8
Figure 4.1: Major components of a basic ultrasonic imaging system. ... 25
Figure 4.2: Ultrasound coordinate system relative to the imaging transducer ... 26
Figure 4.3: Illustration of depth of field ... 27
Figure 4.4: The interaction between the ultrasound beam and muscle ... 28
Figure 4.5: Geometry of the acoustic radiation force field ... 31
Figure 5.1: Creep behavior in a viscoelastic material ... 37
Figure 5.2: General methods for VisR, MSSER, and ARFI imaging ... 40
Figure 5.3: Representative VisR displacement profiles measured in homogeneous tissue mimicking phantoms ... 44
Figure 5.4: Representative ARFI and VisR displacement profiles measured in a homogeneous tissue mimicking phantom through depth ... 45
Figure 5.5: MSSER, single- and double-push VisR results in six homogeneous gelatin phantoms ... 46
Figure 5.6: B-Mode and parametric ARFI and VisR images in structured gelatin phantom ... 47
Figure 5.7: In vivo VisR imaging of canine semitendinosis muscle ... 49
Figure 6.1: Focal region of ARF excitation relative to muscle fibers ... 56
Figure 6.2: Photo of experimental setup ... 58
Figure 6.3: Point spread functions measured experimentally ... 60
Figure 6.4: VisR τ measurements at angles of rotations from 0° to 90° in the homogenous phantom ... 61
Figure 6.5: VisR τ measurements at angles of rotations from -10° to 110° in a single acquisition in the excised pig muscle ... 62
Figure 6.7: B-Mode and VisR images in the excised pig muscle for with transducer oriented at 0° and 90° relative to muscle fibers ... 64
Figure 7.1: A schematic of the mass-spring-damper model and an illustration of the forcing function input ... 69
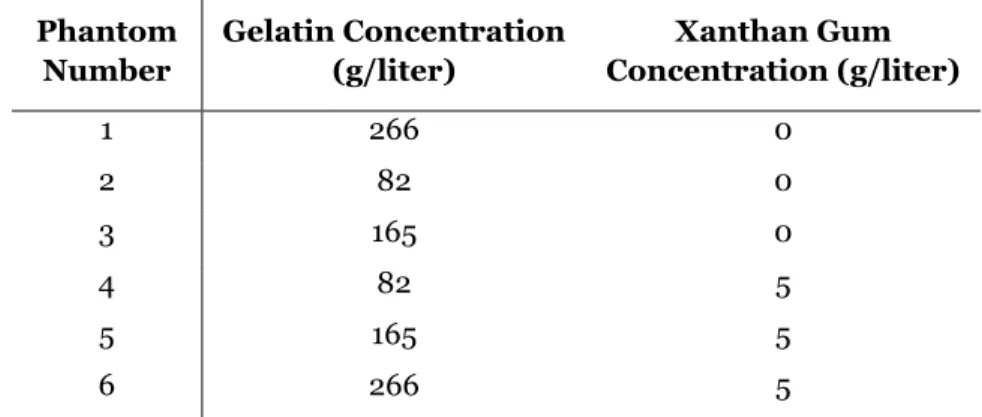
Figure 7.2: Simulated displacement profiles in a viscoelastic material and the predicted
displacement using the Voigt and MSD models. ... 72
Figure 7.3: MSE of the simulated displacement and the displacement predicted by the Voigt and MSD models at densities from 0.05 g/cm3 – 1.0 g/cm3 ... 73
Figure 7.4: Scatter plots of VisR τ estimates versus the simulated material τ ... 74
Figure 7.5: Wilcoxon two-sample test p-values of the τ estimates generated by the Voigt and MSD model at densities from 0.05 g/cm3 – 1.0 g/cm3 ... 75
Figure 7.6: Percent error in Voigt and MSD derived estimates of τ values using the Voigt and MSD model when material density was 1.0 g/cm3 ... 76
Figure 8.1: Spatial distribution of force using a volumetric ARF body force ... 80
Figure 8.2: True material τ plotted as a function of the VisR estimated τ and ω
parameters, and the 3D surface fit ... 83
Figure 8.3: Experimental setup for optical tracking ... 85
Figure 8.4: Uncorrected τ estimates in simulated materials with a constant viscosity and in materials with a constant elasticity ... 86
Figure 8.5: Uncorrected VisR τ estimates in the simulated viscoelastic materials plotted relative to the true τ of the material ... 87
Figure 8.6: Corrected VisR τ estimates in the simulated viscoelastic materials plotted relative to the true τ of the material ... 87
Figure 8.7: Corrected τ versus axial depth in the simulated viscoelastic materials ... 88
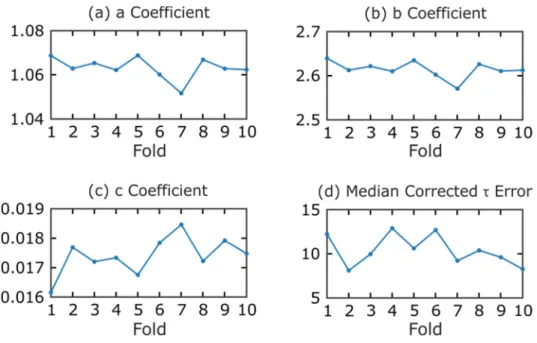
Figure 8.8: K-fold cross validation of error correction function coefficients ... 89
Figure 8.9: Experimental axial displacements in a gelatin phantom and the associated
uncorrected and corrected VisR τ estimates ... 898
Figure 9.2: Uncorrected and corrected VisR τ estimates plotted relative to the
real τ of the material ... 98
Figure 9.3: Standard deviation of uncorrected τ estimates ... 97
Figure 9.4: Corrected τ versus axial depth in the simulated viscoelastic materials ... 100
Figure 9.5: Simulated axial displacements tracked in the ROE and outside the ROE ...101
Figure 9.6: Simulated VisR τ esimates compared to the true τ of the material ...101
Figure 9.7: Experimental axial displacements and the associated τ measurements ... 102
Figure 10.1: Box-and-whisker plots of measured relative elasticity, relative viscosity, and τ for materials grouped by elasticity ... 107
Figure 10.2: Box-and-whisker plots of measured relative elasticity, relative viscosity, and τ for materials grouped by viscosity ... 108
Figure 10.3: Parametric VisR images of estimated τ, relative elasticity, and relative viscosity in structured gelatin phantom ... 109
Figure 11.1: Histological analysis of muscle tissue samples ... 115
Figure 11.2: VisR τ images in the rectus femoris muscles of GRMD and control littermate and corresponding histology ... 116
Figure 11.3: VisR τ estimates in the VL muscles versus age for the cross-sectional study ... 118
Figure 11.4: Histology and MRI results in the VL muscles for the cross-sectional study ... 119
Figure 11.5: VisR τ estimates in the CS muscles versus age for the cross-sectional study ... 120
Figure 11.6: Histology and MRI results in the CS muscles for the cross-sectional study ... 121
Figure 11.7: VisR τ estimates in the RF muscles versus age for the longitudinal study ... 123
Figure 11.8: Histology and MRI results in the RF muscles for the longitudinal study ... 124
Figure 11.9: VisR τ estimates in the VL muscles versus age for the longitudinal study... 125
Figure 11.10: Histology and MRI results in the VL muscles for the longitudinal study ... 126
Figure 11.11: VisR τ estimates in the CS muscles versus age for the longitudinal study ... 127
Figure 12.1: Parametric VisR τ image overlaid on B-Mode images in the right
sartorius muscle of Subject 1 ... 134
Figure 12.2: Parametric VisR τ image overlaid on B-Mode images in the right gastrocnemius muscle of Subject 1 ... 134
Figure 12.3: VisR τ estimates in the sartorius and gastrocnemius of Subject 1 over time ... 135
Figure 12.4: Parametric VisR τ images overlaid on B-Mode images in the sartorius and gastrocnemius muscle of Subject 2 ... 136
Figure 12.5: VisR τ estimates in the sartorius and gastrocnemius muscles of Subject 1 at baseline compared to Subject 2 ... 136
Figure 12.6: QMT testing in Subject 1 ... 137
Figure 12.7: 6MWT and TFT results for Subject 1 ... 138
Figure 12.8: QMT testing in Subject 1 at baseline and Subject 2. ... 139
Figure 12.9: 6MWT and TFT results for Subject 1 at baseline compared to Subject 2... 139
Figure A.1: A schematic of the Voigt model ... 146
Figure A.2: A schematic of the Zener model ... 147
Figure A.3: Strain versus time curve of a Voigt material under constant stress ... 148
Figure A.4: Error in measured τ and computational time of simulations ... 149
LIST OF ABBREVIATIONS
6MWT 6-Minute Walk Test
ARF Acoustic Radiation Force
ARFI Acoustic Radiation Force Impulse BMD Becker Muscular Dystrophy
CK Creatine Kinase
CNR Contrast-to-Noise Ratio
CS Cranial Sartorius Muscle CV Coefficient of Variation
DGC Dystrophin-Glycoprotein-Complex DMD Duchenne Muscular Dystrophy
DOF Depth-of-Field FEM Finite Element Method FOV Field of View
FWHM Full Width Half Max
GAST Gastrocnemius Muscle
GRMD Golden Retriever Muscular Dystrophy H&E Hematoxylin and Eosin
HHD Hand-Held Dynamometer
IACUC Institutional Animal Care and Use Committee IRB Institutional Review Board
MHz Megahertz
MMT Manual Muscle Testing
MRI Magnetic Resonance Imaging
MSE Mean Squared Error
MSSER Monitored Steady-State Excitation and Recovery
PD Peak Displacement
PML Perfectly Matched Layer
PRF Pulse Repetition Frequency PSF Point Spread Function
QMT Quantitative Muscle Testing RF Rectus Femoris Muscle
ROE Region of Excitation ROI Region of Interest
RP Run Percentage
RT Recovery Time
SART Sartorius Muscle
SD Standard Deviation
SDUV Shear Wave Dispersion Ultrasound Vibrometry
SNR Signal-to-Noise Ratio
SSI Supersonic Shear Imaging
ST Semitendinosus Muscle
SWEI Shear Wave Elasticity Imaging
SWS Shear Wave Spectroscopy
T2w T2-weighted TFT Timed Function Test
VisR Viscoelastic Response
CHAPTER 1
Introduction
1.1
Purpose
Affecting approximately 1 in 3,500 newborn males, Duchenne muscular dystrophy (DMD) is
one of the most common lethal genetic disorders in humans.1 The disease is caused by
mutations in the dystrophin gene, which codes for the protein dystrophin, an important structural component of muscle. Muscle involvement in DMD is characterized by repetitive
cycles of injury and repair that result in replacement of muscle cells by fat and fibrous tissue.2
Boys with DMD suffer progressive loss of muscle strength and function, leading to wheelchair
dependence, cardiac and respiratory compromise, and death during young adulthood.3 There are currently no treatments that can halt or reverse the disease progression. While a wide range of treatments have been proposed in the nearly 30 years since the discovery of dystrophin, translating these prospects to clinical trials has been delayed by inadequate outcome
measures.4,5
The purpose of this dissertation is to develop Viscoelastic Response (VisR)
ultrasound - a novel, noninvasive imaging method - for detection of mechanical
property changes in muscle. VisR uses acoustic radiation force (ARF) to produce small,
against a mechanical model. By repeating this process at a number of locations, images depicting viscoelastic properties of tissues can be formed.
While presented in the context of imaging dystrophic muscles, the work herein addresses biomechanical modeling and signal processing techniques that are relevant to many other clinical applications.
1.2
Hypothesis
To evaluate the hypothesis that VisR ultrasound can noninvasively characterize the
viscoelastic properties of soft tissue in vivo the following three specific aims were
addressed in this research
Aim 1. Develop, using custom finite element method (FEM) models, VisR mechanical modeling and signal processing techniques for assessing tissue viscoelasticity.
Aim 2. Demonstrate the relevance of VisR imaging for differentiating viscoelastic property with progressive dystrophic degeneration in a dog model of DMD.
Aim 3. Assess the clinical feasibility of using VisR imaging to monitor dystrophic degeneration longitudinally in one, and cross-sectionally in two juvenile males with DMD.
1.3
Overview
This dissertation encompasses the development, preclinical, and clinical elevation of a new technique for evaluating the viscoelastic properties of tissue.
developing MRI as an outcome measure for staging DMD disease progression. A brief background on ultrasound imaging is provided in Chapter 4, along with a description of ultrasound techniques that have been applied to imaging dystrophic muscles. There is also a detailed description of the fundamental concepts behind ARF and ARF-based imaging methods. In Chapter 5, VisR ultrasound is presented using the Voigt mechanical model and is
demonstrated in in viscoelastic tissue-mimicking materials as well as in canine muscle, in vivo. The results of a pilot study in ex vivo muscle are presented in Chapter 6 and demonstrate that VisR’s sensitivity to muscle anisotropy can be controlled by modifying the focal configuration of the ARF excitations. In Chapter 7, the mass-spring-damper model (MSD) is introduced for VisR imaging and the importance of accounting for inertia is demonstrated in FEM simulations. FEM simulations are expanded upon in Chapter 8 to investigate the impact of using an acoustic radiation force to induce displacements and determine whether VisR can generate quantitative measurements of viscoelasticity. Chapter 9 considers the impact of displacement
underestimation on VisR imaging and presents a technique for using shear waves to mitigate underestimation errors. Isolation of elastic from viscous material properties relative to the magnitude of the ARF excitation is demonstrated in Chapter 10. Chapter 11 contains the results of preclinical cross-sectional and longitudinal studies of VisR imaging in affected GRMD dogs and normal controls. Chapter 12 demonstrates the clinical feasibility of VisR ultrasound in two boys with DMD. Finally, Chapter 13 presents the final conclusions of this thesis and discusses areas of future development.
CHAPTER 2
Clinical Background
Skeletal muscle makes up over 40% of the human body’s mass and is crucial for function
and survival.6 In order to generate force and produce movement, skeletal muscles shorten, or contract. In Duchenne muscular dystrophy (DMD), a missing protein, dystrophin, makes
muscles especially vulnerable to injury during contraction.7 Muscles will undergo cycles of damage and repair until eventually, the muscle mass becomes replaced by fat and fibrous
tissue.2
In order to understand the pathologic changes associated with DMD, this chapter begins with a summary of the basic anatomy of skeletal muscles and the role of dystrophin in
maintaining its structural integrity. This is followed by a discussion of the clinical
manifestations and progression of DMD, the experimental therapies in development, and the animal models aiding in their development.
2.1
Skeletal Muscle
Attached to the bone by tendons, skeletal muscles are responsible for voluntary
movements of the body. Skeletal muscles (Figure 2.1) are encircled by the epimysium, a dense connective tissue that joins with the tendon. Internally, the muscle is composed of numerous muscle fascicles, which are separated from one another by a layer of connective tissue known as
the perimysium.8 Muscle fascicle consists of bundles of multinucleated muscle fibers which are
Figure 2.1: (a) Schematic drawing of the hierarchical structure of striated muscle. (b) Muscle histology stained with hematoxylin and eosin (H&E). Note the tight packing and relatively uniform diameters of the fibers, and the peripherally located nuclei. Biopsy obtained from a healthy, 3 month old dog.
called myofilaments. These proteins are responsible for the transduction of chemical energy
into mechanical work during muscle contraction and relaxation.9
Muscle fibers make up approximately 85 percent of muscle tissue; nerves, blood supply, and connective tissue structures that provide support, elasticity, and force transmission to the
ranging from about 10 μm to about 100 μm. Muscle fiber length is highly variable, depending on the muscle’s architecture. Fiber arrangements fall into two major categories, parallel and
pennate.11 In a parallel arrangement, fibers run parallel to each other along the axis of the muscle, whereas fibers in the pennate arrangement insert obliquely onto a tendon that runs the length of the muscle. The geometric arrangement of fibers in the muscle has a large effect on the muscle’s ability to generate force and produce movement. A muscle with parallel arrangement of fibers, for example, will have more basic contractile units in series than a similarly sized pennate muscle. This arrangement allows the parallel muscle to contract quicker, but with less force, than the pennate muscle. Muscles designed for strength (e.g. gastrocnemius) are typically
pennate, whereas those designed for speed (e.g. sartorius) tend to have parallel fibers.12
2.1.1
Regeneration of Skeletal Muscle
Skeletal muscle contains resident stem cells called satellite cells. These cells are located between the sarcolemma of the muscle fiber and the basement membrane. Satellite cells act as a reserve population of cells that can proliferate in response to injury and regenerate muscle, as
well as maintaining the number of satellite cells throughout one’s life.13
Healthy skeletal muscle has a remarkable ability to regenerate in response to injury. In the initial phase of skeletal muscle regeneration following injury, muscle damage and disruption of muscle fiber integrity lead to an inflammatory response and an infiltration of phagocytic
macrophages.14 The macrophages persist at the injured site for several weeks removing necrotic
debris. Subsequently, satellite cells are rapidly activated and then proliferate to produce committed muscle progenitor cells (myobalsts). Myogenic progenitor cells then expand and
2.1.2
Dystrophin
The structural integrity of the muscle fiber is maintained by a network of interlinking
protein fibers within the muscle.15–17 The structural protein dystrophin links the myofilaments to the plasma membrane, or sarcolemma, of the muscle fiber, as depicted in figure 2.2.
Dystrophin associates which several glycoproteins to form the “dystrophin-glycoprotein-complex” (DGC), and the entire structure acts as a structural link between the contractile apparatus and the extracellular matrix, thereby stabilizing the sarcolemma during contraction and relaxation. When dystrophin is absent from muscle cells, this complex does not form, and forces are unevenly transmitted through the sarcolemma resulting in a fragile membrane that is
more easily damaged during muscular contraction.18
2.2
Duchenne Muscular Dystrophy
2.2.1
Epidemiology and Genetics
Duchenne muscular dystrophy (DMD) results from mutations in the dystrophin gene located on the short arm of the X chromosome and is characterized by a complete absence of the
dystrophin protein.19 Becker muscular dystrophy (BMD) is a fundamentally similar disease as
DMD but involves a decrease in the quantity or quality of the dystrophin protein.20 This results
in a milder and more slowly progressive course.
The dystrophin gene, which spans a genetic distance of more than 2.5 million base pairs, is the largest isolated human gene. More than 90% of DMD patients have an absence of
dystrophin corresponding to a mutation that disrupts the reading frame of the mRNA, which
results in the early termination of transcription.21 As a result, an unstable dystrophin molecule is produced which will undergo rapid decay. The incidence of DMD has been estimated at
approximately 1 in 3,500 male births.19 The most common form of inheritance is X-linked
Figure 2.2: A schematic representation of dystrophin and its role in linking the myofilaments to the extracellular matrix.
history. Because the mutation is X-linked, the disease almost exclusively affects males. Females with a mutated gene are “carriers” and can pass the mutation onto her children.
2.2.2
Pathology
In DMD, the absence of dystrophin in the cell membrane will result in a fragile sarcolemma that is more easily damaged during muscle contraction. Increased membrane
breakdown allows extracellular calcium to enter the cell causing the fiber to undergo necrosis.7 As damaged muscle fibers are repaired, they still lack the missing structural component and will be torn again by future muscle activity. Following this relentless cycle of necrosis and
regeneration, the proliferative capacity of the satellite cell population gradually becomes
exhausted, and regeneration eventually fails.22,23 As a result, the number of muscle fibers
One of the most important histologic features of DMD is loss of muscle fibers. The size of individual muscle fibers displays marked variation, with fibers ranging from 10 to 230 μm. Additional histologic features include: regenerating fibers; enlarged, “hypercontracted” fibers (which may be caused by abnormally high amounts of calcium); areas of overt necrosis with macrophage infiltration; increased endomysial connective tissue; and infiltration of adipose
tissue.24,25
Histopathology changes as a function of age, with young patients showing less fibrosis and less dramatic changes in muscle, whereas end-stage muscle shows large numbers of very small fibers that have failed to fully regenerate, extensive endomysial fibrosis, and a few remaining
hypertrophic fibers.26 No histopathologic feature is diagnostic for DMD, but
immunohistochemical analysis of the muscle biopsy can show dystrophin protein content, which is considered diagnostic.
2.2.3
Clinical Diagnosis
The diagnosis of DMD is based on clinical signs and symptoms and confirmed by raised serum concentration of creatine kinase (CK), absence of dystrophin in muscle biopsy, and the finding of a mutation in the dystrophin gene. In all DMD patients serum CK, an indicator of
muscle damage, is high from birth onwards.27 The level may decline in the later stages of the disease, when the greater muscle mass has already deteriorated, and there is less breakdown of
muscle mass than in the earlier stages.28
2.2.4
Natural History
Affected boys are rarely symptomatic in early infancy; however, elevated levels of serum
creatine kinase (CK) enzyme are present at birth.29,30 The most common first symptom is a
delay in independent walking. Clinical evaluation is often sought when the child begins
exhibiting gait abnormalities, difficulty rising from the floor, and problems climbing stairs. On
average, children with DMD are diagnosed between ages 4 and 5.31
In general, during the early stages of the disease, the lower limbs are more affected than
the upper limbs, with certain muscles more predominately affected.27,32 This pattern of muscle involvement results in several well-defined physical features associated with the disease.
Weakness of the knee and hip muscles leads to the Gowers' maneuver, in which the child rises from the floor by using his hands to “climb” up his legs. Hip extensor muscle weakness produces a waddling gait, and contractures of the achilles tendon leads to toe-walking. As the posterior hip muscles weaken, the child must arch his back when standing to maintain his
center of gravity behind the hip joint leading to lumbar lordosis.28 One of the most obvious features in the early stages of the disease is an enlargement of the calf muscles. Muscle
enlargement is due, at least in part, to an excess of adipose and connective tissue.33
The ability to stand up from a chair is lost around age 8, followed by the inability to climb
stairs.34 The combination of muscle weakness and contractures leads to an increasing difficulty in walking. When ambulation is no longer possible, usually around age 10 in untreated DMD and about three years later in most steroid-treated DMD boys, full-time wheelchair use is
required.35–37 After loss of ambulation, joint contractures increasingly develop, particularly flexion contractures of the elbows, knees, hamstrings, and hips. Later movement of the shoulders and wrists also become limited. Cardiac and respiratory involvement often occur in
this later stage of the disease.3,38
Patients with DMD are at risk of respiratory complications as their condition
and diaphragmatic muscles. Scoliosis is common in affected boys and usually progresses more rapidly after the child becomes non-ambulatory. This thoracic deformity further compromises pulmonary capacity. DMD patients are also at risk for cardiac disease. Cardiac disease usually consists of dilated cardiomyopathy, which causes a progressive decline in the ejection fraction,
and generally evolves to heart failure.40 The mean age of death is 19 in untreated patients, with
approximately ninety percent of deaths attributed to respiratory and ten percent to cardiac
causes. Ventilation use extends mean life expectancy to 25.41
Patients can show other symptoms in addition to skeletal and cardiac muscle involvement. Intellectual impairment occurs in most patients. The IQ of boys with DMD is typically one standard deviation below the general population, but cognitive impairment is not progressive
and not correlated with weakness.42,43 Smooth muscle dysfunction is also present and can lead
to digestive and urinary tract complications.44
2.2.5
Treatment
There is no cure for DMD. Treatment goals are to maintain function, prevent
contractures, and provide psychological support for children and their families.3 Main efforts are directed towards keeping children standing and walking as long as possible. Passive stretching exercises, use of splints to maintain the feet in a neutral position during the night, and use of long-leg braces for walking are important in this respect. Scoliosis cannot be prevented and, if progressive, surgical correction is the only effective way to straighten the
spine.28
Corticosteroids
maintain normal or near-normal respiratory function.3,37,45 Despite the evidence in favor of daily prednisone there are numerous potential side effects caused by this treatment. Most commonly seen are excessive weight gain, behavioral changes, excessive hair growth,
gastrointestinal symptoms, and decreased linear growth. The synthetic steroid, deflazacort, has shown similar clinical efficacy in slowing the disease, and is thought to have fewer side effects
than prednisone, particularly with regard to weight gain.46 Deflazacort is available in Europe
and Central and South America but is not currently available in the United States.
Experimental Therapies
Rather than addressing the primary defect, traditional pharmacological strategies reduce or postpone symptoms by targeting the secondary effects of the disease. Thus, there is
significant interest in developing therapies for DMD that would treat the underlying genetic
defect and result in the production of functional dystrophin.47 Genetic treatments must
overcome significant challenges: treatment must restore dystrophin to both skeletal and cardiac muscles, patients will need to receive treatment the entirety of their lives, and immune response
must be minimized.48
Several therapeutic approaches are being developed, and clinical trials are in progress. Approaches currently being investigated include gene replacement of dystrophin using viral vectors, and upregulation of proteins, such as utrophin, to act as dystrophin surrogates. A number of gene-specific approaches, which manipulate mRNA processing, are also being explored. These include antisense oligonucleotides to induce exon skipping and restore the reading frame in boys with eligible out-of-frame deletions, and agents, such as aminoglycoside
2.2.6
Animal Models
The availability of animal models for DMD constitutes a critical asset, as they allow for extensive pre-clinical studies on the safety and functionality of the various therapeutic
approaches as well as understanding the mechanism of muscle degeneration.53 The most
commonly used models are the mouse and dog model. The preclinical studies described in this dissertation were performed using the GRMD dog model.
Mouse Models
Mouse models have been used extensively to understand the pathologic mechanism of DMD and have been crucial in the development of therapeutic approaches. Many mouse models with mutations in the DMD gene have been identified. Among these models, the mdx mouse is
most commonly used laboratory model of DMD.54 The mdx mutation consists of a single base
substitution in exon 23, resulting in a premature stop codon in the dystrophin gene.55 This
mutation leads to the absence of detectable dystrophin in the muscle, except in rare revertant muscle fibers. Despite being a genetic and biochemical homologue of DMD in humans, the mdx mouse exhibits a milder phenotype. Muscle pathology is comparatively moderate, and
mechanical function is less seriously compromised, resulting in an almost normal lifespan.55 While the genetic tractability and convenient size of mice make them invaluable tools in DMD research, their inability to address certain issues associated with DMD, such as the
challenges associated with performing gene or cell therapy on large volumes of muscle, and their differing pathological expression of the disease, limits their relevance for clinical evaluation in therapeutic trials. In contrast, dystrophin deficient dogs have a body size closer to humans and
Dog Models
Spontaneous mutations of the dystrophin gene resulting in X-linked muscular dystrophy have been identified in several breeds of dogs: Golden Retrievers, Rottweilers, Pembroke Welsh
Corgis, Cavalier King Charles Spaniels, and the German Shorthaired Pointer.56 Of these, the
Golden Retriever muscular dystrophic (GRMD) dog has been the most extensively studied and
best characterized.57–65 GRMD dogs have a point mutation in intron 6 in the canine dystrophin
gene, resulting in a premature stop codon, and consequentially, in a non-functional protein.66 Dogs with GRMD undergo a clinical progression that closely resembles human DMD. CK levels are elevated and extensive muscle necrosis can be identified in GRMD dogs from birth
onwards.67 By 6 months of age, severe fibrosis and joint contractures develop. Affected dogs have a stiff gait and tire easily. As the disease progresses, muscle contractures lead to reduced range of motion of joints, and dogs frequently develop spinal column and thoracic wall
deformities. GRMD dogs frequently develop cardiomyopathy which can lead to heart
failure.56,67 The histopathological changes in the muscles are also similar to the ones seen in
humans and include muscle fiber degeneration and regeneration, fiber splitting, numerous fibers with centrally located myonuclei, and intense connective tissue replacement. An important confounding factor for studies using the GRMD dog model is the high degree of variability in disease severity. Despite having the same genetic mutation, some dogs with GRMD are only mildly affected; while others die soon after birth due to extreme respiratory
compromise.56
2.3
Summary
weakness and degeneration stemming from progressive loss of contractile function. Current drug selections for DMD patients are primarily limited to corticosteroids, however, several novel treatments, aided in their development by animal models of DMD, are in early clinical trials.
CHAPTER 3
Outcome Measures in DMD
The increasing number of potential therapies for treating DMD in recent years has highlighted the need for validated outcome measures that can reliably assess possible changes following treatment. Defining proper outcome measures is crucial for demonstrating drug efficacy in clinical trials; they should have high sensitivity, and reproducibility. Despite the fact that DMD is one of the most common neuromuscular diseases, patient numbers are limited often requiring that clinical trials involve multiple trial sites, emphasizing the need for outcome
measures which can be standardized between institutions.68 Furthermore, treatment options
may only result in mild improvement, so outcome measures will need to able to detect minimal changes in natural history.
Additional challenges in DMD occur due to the young age of the patient population. Obtaining reliable outcome measures in patients with DMD can be difficult because of the unique challenges inherent in testing children and because of the associated cognitive deficits seen in approximately one-third of DMD patients. Moreover, loss of muscle function in DMD occurs against the background of normal childhood growth and development, this may manifest
as an improvement in physical ability despite progressive muscle impairment.69 This chapter
describes the current surrogate biomarkers for DMD currently employed in clinical trials as well
3.1
Physical Outcome Measures
Physical outcome including the 6-minute walk test, muscle strength tests, and timed function tests have been used in the majority of clinical trials. A limitation of these physical tests is that the measurements rely on voluntary efforts of the patient. Consistency of the measurements between trials and between test sessions can be significantly affected by the
attention, cooperation, and motivation of the child.69,71 The strengths and weaknesses of the
specific physical tests are reviewed below.
6-minute walk test
The 6-minute walk test (6MWT) measures the distance that a patient can walk in a period of 6 minutes. Studies documenting the sensitivity and reproducibility of the 6MWT have led to
its common use as the primary clinical endpoint in DMD trials worldwide.72,73 Given that difficulty walking is an important manifestation of the disease process, improvements in the 6MWT with treatment relative to placebo constitutes evidence of therapeutic value. In clinical trials, a difference of 30 meters between drug and placebo is generally required for a clinically
meaningful functional change.74,75
While the 6MWT is useful, it has a number of limitations. First, it has inherent variability; distance walked can by effected by the patient’s mood and effort. Parents and clinical evaluators
have observed that verbal encouragement of the child can significantly increase their distance.76 In addition, the 6MWT can only be completed in ambulatory boys, severely limiting the length of time that the test is applicable. Moreover, children with DMD under age 7 have demonstrated
yearly improvements in 6MWT distance despite progressive muscular impairment.77 Evidence from recent trials in exon skipping has shown that early intervention may be necessary to maximize treatment before extensive muscle loss has occurred. Thus, the 6-minute walk test
Muscle strength testing
Manual muscle testing (MMT) is a procedure for evaluating strength and function of an individual muscle or muscle group in which the patient voluntarily contracts the muscle against the manual resistance of a clinician. The clinician assigns the muscle strength a grade between 0-5 based on the on the patient's ability to hold against the applied pressure. MMT is the simplest and most common method used to evaluate muscle strength in a clinical setting. However, the questionable reliability and sensitivity of MMT limits its usefulness as an outcome
measure.79 Additionally, the nonlinearity of the grading limits the use of MMT for following
disease progression or treatment response in a given patient longitudinally.
In order to overcome the limitations associated with MMT, isometric hand-held
dynamometers (HHD) have been developed to provide objective and continuous measurements of muscle strength. HHDs are generally portable, relatively inexpensive, and measure strength as a unit of force. To perform quantitative muscle testing with an HHD, the patient is positioned in a standardized position for the muscle group being tested. The clinician holds the HHD stable while the patient exerts their maximum force against it for a period of 3 to 5 seconds.
The current literature indicates that HHD testing provides reliable measurement in
children and adolescents with and without neuromuscular disorders.80 However, reliability is
dependent upon consistent testing techniques and protocols, and accurate positioning of the patient. Like other physical tests, muscle strength testing is critically dependent upon the effort and cooperation of the patient. It is also crucial that the patient understand the required
movement. Because of these requirements, HHD testing is difficult to perform in children
under 5.71 Limitations with HHD testing also occur in later stages of the disease when severe
contractures restrict the positioning of the patient.81 Furthermore, these tests cannot isolate the
Timed function testing
The measurement of the time that a child takes to perform a given activity is a commonly used means for assessing the functional abilities in boys with DMD. These activities can include the time to climb a short flight of stairs, walk a short distance, or sit and stand up from a chair. Muscle degeneration is shown as an increase in the time it takes the patient to perform the activity and generally reflect the increasing weakness of the involved muscles. These tests are convenient to use in a clinical setting, easy to administer, and result in a qualitative and
continuous measure of progression. However, there is potential error in clinician timing, which
may reduce the test-retest reliability of the measures.75 Furthermore, the number of activities that the patient can perform is reduced as the disease progresses, reducing the relevance of these tests in older patients.
3.2
Imaging Techniques
3.2.1
Magnetic Resonance Imaging
Magnetic resonance imaging (MRI) is a noninvasive imaging method which uses a powerful magnet to produce high resolution images and is increasingly being used in the evaluation of disease severity in neuromuscular diseases.
Basic Physics of MRI
The signal acquired from MRI systems predominately comes from the hydrogen protons within the body, specifically, those from water and fat. All protons inherently have a nuclear “spin” and a resulting intrinsic magnetic field. In the presence of a strong external magnetic field, the interaction between the external magnetic field and the magnetic field of the proton will cause the proton to precess at a frequency directly related to the strength of the external magnetic field. The protons will also align with the external magnetic field, creating a net
A radiofrequency (RF) pulse is then applied which excites the protons to a higher energy level. Simultaneously, there is a gain in the protons’ phase coherence. This produces a loss of longitudinal magnetization and a gain in transverse magnetization, respectively. When the RF pulse is turned off, the excited hydrogen protons undergo relaxation back to their original lower
energy level. 84 The relaxation process of the protons back into their equilibrium state occurs by
two mechanisms: longitudinal (T1) and transverse (T2) relaxation. In T1 relaxation, the proton returns to its equilibrium state by transferring energy to the other nuclei in its surroundings, or lattice. This mechanism is also referred to as spin-lattice relaxation, and results in a net increase in longitudinal magnetization. T2 relaxation reflects the loss of phase coherence due to
interactions between spinning protons. Also known as spin-spin relaxation, T2 relaxation leads
to a net decrease in transverse magnetization.83
Different tissues will exhibit different T1 and T2 relaxation times. By varying the scanning parameters, images are generated so that the signal is primarily due to the T1 or T2 relaxation times of the tissue. The signal intensity of normal skeletal muscle is similar to that of water, and lower than that of fat on T1-weighted images. In T2-weighted images, the signal of skeletal muscle is lower than that of both water and fat. Table 3.1 summarizes the appearance of muscle, fat, and water in T1- and T2-weighted images. Fat suppressed images can be generated by using short τ inversion recovery (STIR) or by using a pre-saturation pulse to suppress the fat signal. Fat suppressed T2-weighted images are much more sensitive in detecting subtle muscle
edema.70,85
Table 3.1: MRI signal characteristics of muscle components
T1-weighted T2-weighted
Water Low to intermediate High
Fat High Intermediate
MRI in DMD
Because healthy skeletal muscle and fat exhibit very different T1 relaxation times,
T1-weighted imaging is very sensitive to intramuscular fatty deposition.86 T1 signals have been shown to be significantly higher in the muscles of boys with DMD compared to normal
control.86 T1 intensity has also been shown to increase during the course of the disease,
associated with the increasing replacement of muscle by fat.87 However, water has a T1
relaxation time that is similar to normal muscle, thus T1-weighted images are insensitive at detecting increased water in muscle, making T1-weighted images less relevant in young DMD patients. It has been hypothesized that T2-weighted images, which are sensitive to both fat and water, may be more appropriate for evaluating DMD patients early in the course of the disease,
before fatty infiltration is significant.88 Acute muscle damage, inflammation, and fat have been
characterized in dystrophic muscle using T2-weighted imaging.89
A number of approaches have utilized MRI to measure muscle size in DMD. Muscle cross-sectional area is a quantitative measurement and can show differential involvement of muscle groups in disease progression. Researchers at the University of Florida have used muscle
cross-sectional area to compare boys with DMD to age matched controls.90 They found that muscle
cross-sectional area of the calf muscles were larger in DMD patients compared with controls. In another study by the same group, tissue within the cross-sectional area was classified as
contractile (muscle tissue) and non-contractile (fatty tissue) based on T1 signal intensity. Comparing 28 boys with DMD and 10 control subjects, they showed that the DMD patients had a significantly greater proportion of non-contractile tissue. The proportion of non-contractile
tissue in boys with DMD was shown to increase significantly with age.91
Image Research and Analysis Laboratory at the University of North Carolina has recently developed a semi-automated segmentation method for segmenting the full length of individual muscles. They found that utilizing the full volume of muscle resulted in significantly less error and variability in measurements, compared to the standard, limited range, muscle
segmentation.92 Further, they showed that distribution of T2 values could be analyzed in three
dimensions throughout the full muscle to provide information of muscle heterogeneity, and have demonstrated that MRI texture features are capable of distinguishing longitudinal
progression between GRMD and normal dogs.93
Overall, MRI is a powerful and sensitive technique for evaluating skeletal muscle
involvement in DMD. The major disadvantages of MRI as a biomarker for disease progression or therapeutic response in clinical trials are associated with the high cost, and the necessity of
sedation or anesthesia in young children to prevent motion artifacts.94 This is especially undesirable in this patient population as anesthesia is potentially more hazardous in boys with
DMD.95 Furthermore, MRI is not capable of directly measuring fibrosis, which is a critical
characteristic of degenerated dystrophic muscle.96
3.2.2
Ultrasound Imaging
Medical ultrasound, discussed in detail in Chapter 4, provides a safe and relatively inexpensive alternative to the high cost of MRI. Moreover, the rapid acquisition time make ultrasound less susceptible to motion artifacts, eliminating the need for sedation in pediatric patients.
3.3
Summary
The current outcome measures primarily used in DMD include the 6-minute walk test, muscle strength tests, and timed function tests. These tests lack sensitivity to individual
a limited period of time. MRI and ultrasound imaging techniques that can noninvasively and quantitatively describe individual muscle involvement and longitudinal disease progression are emerging as new outcome measures.
CHAPTER 4
Ultrasound Imaging
Medical ultrasound is a technique for generating images of soft tissue. Because ultrasound is relatively inexpensive, portable, noninvasive, and real-time, it is attractive modality for a wide variety of clinical applications, including imaging muscles affected by neuromuscular diseases such as DMD.
4.1
Basics of Ultrasound Imaging
The major components of a basic ultrasound system are shown in Figure 4.1. Ultrasonic imaging operates by transmitting high-frequency acoustic pulses into the body. To generate this acoustic wave, computer-controlled electric voltage waveforms are applied across piezoelectric elements in a transducer array. The elements vibrate at megahertz (MHz) frequency, generating pressure waves, which emanate from the transducer surface into soft tissue. As the sound waves propagate, they are attenuated, scattered, and reflected, producing echoes from the various interfaces. The transducer receives the returned echoes, which are digitalized and sent to the receive beamformer. The beamformer combines the signals from each of the array elements and sums them, forming one signal (A-line) for each transmit pulse. Focal delays and apodization applied within the beamformers are used to independently focus and/or steer the A-lines on transmit and receive. Post-processing steps include envelope detection and
Figure 4.1: Major components of a basic ultrasonic imaging system.
(B-mode) images that depict the relative strength and location of received echoes. These images, which are made up of hundreds A-lines, are created by transmitting on a subset of the
elements and translating the active aperture across the transducer array.97,98
4.1.1
Spatial Resolution
Spatial resolution describes the minimum spacing needed between two reflectors to have them distinguishable in the image. Image resolution can be described in the axial, lateral, and elevational dimensions as depicted in figure 4.2. Axial resolution, or the resolution along the ultrasound beam, is dependent on the pulse duration of the transmitted pulse and is defined as
λ ∙ 2
(4.1)
given by equation 4.2. The ratio of the focal distance to the aperture width is known as the f-number (F/#), and describes the focal configuration or spatial geometry of the acoustic pulse. Typically, for a 1D imaging linear array transducer, the F/# in the lateral dimension can be adjusted for the specific application by changing the number of elements excited (to change D) and the focal delays applied to them (to change z). However, the focusing in the elevational dimension is accomplished by a mechanical lens, thus the F/# is fixed and dependent on the specific transducer.
/ ∙ ∙ /# (4.2)
/# (4.3)
Depth-of-field (DOF), illustrated in figure 4.3, is another parameter used for describing the focal configuration of the acoustic pulse, and is defined by the following equation,
8 ∙ /# ∙ (4.4)
The DOF describes the axial distance over which the acoustic beam maintains its approximate focal size. Consequently, for a small F/# the resolution at the focal depth will be good, but the distance over which this focusing is maintained will be small.
From equation (4.1) and (4.2), it is clear that resolution in all three dimensions is closely related to the wave length of the acoustic wave. As frequency and wave length are inversely
proportional ( ⁄ where is frequency and is the speed of sound in the medium), the use
of a higher frequency will produce better spatial resolution. However, depth dependent attenuation of acoustic waves also increases with an increasing frequency. This tradeoff between depth penetration and spatial resolution must be considered for each ultrasound application.
4.2
Ultrasound in DMD
Under normal circumstances, skeletal muscle tissue has low echogenicity (Figure 4.4 (a)). Perimysial connective tissue between fiber bundles are depicted as echogenetic lines on longitudinal scans (transducer parallel to muscle fibers) and small spots in transverse scans (transducer perpendicular to muscle fibers), giving the muscle a speckled appearance. The epimysium surrounding the muscle is highly echogenic, clearly demarcating the muscle boundaries. Bones are highly reflective, resulting in well-defined, hyperechoic lines with posterior acoustic shadowing.
Ultrasound can detect pathology and characterize the pattern of muscle involvement in skeletal muscle. In DMD, muscle appears more echogenic due to the increase in the fat and fibrous content in the muscle (Figure 4.4 (b)). Attenuation also increases, resulting in a decreased reflection from the underlying bone and poorer visualization of deep tissue. As the
Figure 4.3: Relationship between the aperture width (D), the focal depth (z), lateral resolution, and depth of field (DOF). The DOF describes the axial distance over which the beam maintains its lateral
disease progresses, muscle signal increases, and the bone echo become less defined and bright, and eventually cannot be visualized.
Visual detection of increased muscle echogenicity in DMD can be difficult, and its accurate interpretation depends on the experience of the observer. To overcome this problem,
techniques are being developed to make quantitative measurements of muscle echogenicity. Quantification of muscle echogenicity can be achieved with simple gray scale analysis of detected ultrasound data. Another quantification technique, backscatter analysis, converts gray-scale values to decibels by comparing measured echo intensity with phantom
measurements. Both gray-scale analysis and backscatter analysis have shown a significant
increase in the echo intensity of the muscles of DMD boys compared to healthy controls.99,100
Both techniques were also sensitive to increases in intensity corresponding to patient severity. Other studies using radio frequency (RF) data with an entropy-based signal receiver have shown larger scatterer sizes in DMD versus control muscles, consistent with the pathologic changes of
muscle.101,102 These techniques show promise in assessing degradation of dystrophic muscles;
however, while they are sensitive to both fibrous and fatty deposition, they are unable to distinguish between them.
4.3
Ultrasound Elasticity Imaging
Unlike conventional B-mode ultrasound imaging that differentiates features with dissimilar acoustic properties; elasticity imaging methods differentiate features and/or
structures with different mechanical properties. Because malignancies and pathologies, such as fat and fibrosis, will exhibit different mechanical properties than the surrounding tissue,
elasticity imaging methods are being developed to examine tissue health and monitor disease progression. To do this, these methods involve the exciting of the soft tissue and then
monitoring the deformation response. The source of the excitation used to produce the tissue deformation can be applied externally, as in compressive elastography, or can be generated internally using radiation force.
4.3.1
Compressive Elastography
External methods apply a compressive force on the skin to deform the tissue beneath. This is often implemented by pressing down and holding the ultrasound transducer against the
skin. A map of tissue strain can be formed by comparing RF data pre and post compression.103
By assuming the applied stress is uniform and the material is elastic, differences in the measured strain are attributed to differences in the elasticity of the tissue.
Ultrasound elastography has demonstrated promising clinical applications for evaluating
thyroid, breast, lymph nodes, and prostate lesions.104 Elastography has also been applied to
muscle disease assessment. In a case report of a patient with Bethlem myopathy, a congenital muscular dystrophy, elastography showed that hyperechoic areas of the affected muscle
exhibited lower strain than the normal appearing tissue, a finding suggesting increased stiffness
due to the presence of fibrosis in the affected areas.105
the strain estimates formed from them. Elastography is also limited because the deformation field decreases with depth, making it difficult to make measurements in deep tissue.
Furthermore, in compressive elastography where pressure is applied by using a free-hand
technique the measurements are operator dependent, which might affect reproducibility.106,107
4.3.2
Acoustic Radiation Force
Rather than applying stress at the skin surface, Acoustic Radiation Force (ARF) based methods generate a localized stress field within the tissue.
Theory
As an acoustic wave propagates through a medium its intensity decreases, or attenuates, with increasing distance. Attenuation of ultrasound beams is caused by the reflection and scattering of waves and by the absorption of ultrasonic energy. This absorption of energy from the traveling wave results in the transfer of momentum and generates a body force, known as an
acoustic radiation force (ARF).108 In a medium such as soft tissue, the majority of attenuation is
due to absorption. By assuming that tissue behaves as an incompressible, linearly viscous fluid at ultrasonic frequencies and that the ultrasound wave propagates as a plane wave, the
magnitude of the radiation force (F) can be described as 2
(4.5)
where (m-1) and c (m/s) are the absorption coefficient and speed of sound in the medium,
respectively, and I (W/cm2) is the temporal average intensity of the acoustic beam at a given
spatial location.109,110 The volume and geometry of the force field is spatially distributed under
the active transducer aperture and is dependent on the material properties and characteristics of the transmitted beam. The geometry of a typical radiation force field is shown in Figure 4.5.
displacements, ARF methods use longer and/or higher intensity acoustic pulses than what is used for B-Mode imaging. In practice, acoustic radiation force magnitudes on the order of dynes can produce displacements in the range of 1-10 μm. The amount the tissue displaces and the time needed for the subsequent recovery are dependent upon the mechanical properties of the tissue, which is exploited in the imaging techniques described in later sections.
Acoustic Radiation Force Impulse (ARFI) Imaging
In Acoustic Radiation Force Impulse (ARFI) imaging, ultrasound is used to induce displacement and then monitor the tissue response in the same lateral location, or region of excitation (ROE). Because the measured response is dependent on the magnitude of the radiation force, which is unknown in vivo, ARFI methods generally only provide relative measures of the tissue mechanics.
A typical ARFI imaging sequence consists of three pulse types: reference pulses are used to establish a baseline position prior to the acoustic radiation force; an excitation (push) pulse, typically between 30 μs to 1 ms in length, is used to generate the acoustic radiation force; and finally, tracking pulses applied immediately following the pushing pulse are used to monitor the deformation response and recovery of the soft tissue. This ensemble of reference, pushing, and tracking pulses can be translated across the aperture, as in B-Mode imaging, to acquire
information throughout the field-of-view. A displacement estimation method, such as normalized cross correlation, can be applied to calculate axial displacements between two pulses. By estimating the displacements from a reference pulse to each of the tracking pulses, a data set of displacement though time can be generated. From this data set, parametric images can be created by analyzing properties of the individual displacement profiles, such as the peak ARFI-induced displacement, the time to peak displacement, and the time to 67% recovery from peak ARFI-induced displacement or recovery time. In general, softer regions will displace farther, take longer to reach a maximum displacement, and recover more slowly than stiffer
tissues.111–113
ARFI imaging has been shown to be clinically useful in a variety of applications including
breast,114 atherosclerotic arteries,115 gastrointestinal tract,116 liver, 117 kidney, 117 and
prostate.118 Nightengale et. al. demonstrated ARFI in vivo in the human vastus medialis muscle
and showed that muscle stiffness increased with increasing isometric loading.119 Specifically, they showed that the peak displacement, the time to reach peak, and the time to recovery decreased with the increasing load.
Shear Wave Imaging
be related to the stiffness of the material. In a homogeneous, linear, elastic medium, the speed of the shear wave ( ) can be expressed as
2 1 (4.6)
where is the shear modulus, is the Young’s modulus, is the Poisson’s ratio, and is the density of the tissue. Shear Wave Elasticity Imaging (SWEI) uses an impulse radiation force to generate shear waves and quantify tissue stiffness based on their propagation speed. As with ARFI, SWEI imaging sequences consist of reference, pushing, and tracking pulses, except unlike ARFI, the tracking beams are positioned outside the ROE. With the displacement through time information at multiple lateral locations separated by a known distance from the pushing pulse,
the speed of the propagating shear waves can be estimated.120
In Supersonic Shear Imaging (SSI), multiple acoustic radiation force excitations are applied at increasing focal depths to create a quasi-plane shear wave source. The method relies on applying the excitations such that shear waves propagating away from the ROE sum
constructively to create an axially extended cylindrical shear wave. Utilizing extensively parallel beamforming and plane wave transmits SSI methods are capable of monitoring the deformation response simultaneously across a large field of view (FOV) at ultrafast frame rates. Quantitative
estimates of tissue stiffness are made from measured shear wave speeds.121
Clinically, shear wave imaging has been utilized for detecting breast cancer lesions,122
monitoring liver fibrosis,123 and for assessing thermal ablations.124 Gennisson et al.
demonstrated that shear wave imaging was sensitive to muscle anisotropy, and found that shear waves traveled four times faster along muscle fibers than across them in a human bicep
muscle.125 Lacourpaille et al. and Dastgir et al. both investigated shear wave imaging in boys with DMD and found an increase in velocity in the muscles of affected boys compared to healthy
Viscosity
Conventional elasticity methods have largely ignored viscous losses, considering tissue to be purely elastic. All biologic tissues, however, exhibit some combination of elastic and viscous characteristics in response to an applied force. Viscosity is a measure of a material’s resistance
to flow or deformation, and if ignored, can bias the estimates of elasticity.128 Therefore, a viscoelastic model is more appropriate for describing soft tissue deformation. Recently, a number of groups have developed methods for estimating the viscosity of tissue. In Shear Wave Dispersion Ultrasound Vibrometry (SDUV) repeated radiation forces pushes are used to
generate harmonic shear waves.129 Elasticity and viscosity are derived by measuring shear wave
velocities at multiple frequencies and fitting to a mechanical model. Catheline et al. measured viscoelastic properties by analyzing the speed and attenuation of a transverse waves generated
by an external mechanical plate vibrator.130 Shear Wave Spectroscopy (SWS) uses a
broad-band, quasi-plane shear wave source to induce displacements.131 To assess viscous dispersion,
the method applies Fourier transforms to the propagating shear waves and evaluates the phase difference as a function of frequency. Because these methods all rely on shear wave
propagation, they all assume homogeneity over a millimeter-scale measurement region, and lack
the ability to access the viscoelastic properties directly in the ROE.132
Other approaches to viscoelastic property assessment within the region of excitation apply sustained stress to induce displacements and solve for elastic and viscous parameters using established viscoelastic models. Monitored Steady-State Excitation and Recovery (MSSER) ultrasound intersperses multiple ARF pulses and tracking pulses to observe tissue as it displaces to a steady-state level, then monitors the recovery of the tissue following the cessation of force. Tissue displacement and recovery can be fit to a mechanical model to quantify the mechanical