Infant and Child Health
Maternal underweight and obesity and risk of
orofacial clefts in a large international
consortium of population-based studies
Hebah Kutbi,
1George L Wehby,
2Lina M Moreno Uribe,
3Paul A Romitti,
4Suzan Carmichael,
5Gary M Shaw,
5Andrew F Olshan,
6Lisa DeRoo,
7,9Sonja A Rasmussen,
10Jeffrey C Murray,
8Allen Wilcox,
7Rolv T Lie
9and Ronald G Munger
1,*
1
Department of Nutrition, Dietetics, and Food Sciences, Utah State University, Logan, UT, USA,
2Department of Health Management and Policy,
3Department of Orthodontics,
4Department of
Epidemiology, University of Iowa, Iowa City, IA, USA,
5Department of Pediatrics, Stanford University,
Palo Alto, CA, USA,
6Department of Epidemiology, University of North Carolina, Chapel Hill, NC, USA,
7
Epidemiology Branch, National Institute of Environmental Health Sciences, Research Triangle Park,
NC, USA,
8Department of Pediatrics, University of Iowa Hospitals and Clinics, Iowa City, IA, USA,
9
Department of Public Health and Primary Health Care, University of Bergen, Bergen, Norway and
10Centres for Disease Control and Prevention, Atlanta, GA, USA
*Corresponding author. Department of Nutrition, Dietetics, and Food Sciences, Utah State University, Logan, UT, 84322, USA. E-mail: [email protected]
Accepted 26 January 2016
Abstract
Background:
Evidence on association of maternal pre-pregnancy weight with risk of
oro-facial clefts is inconsistent.
Methods:
Six large case-control studies of orofacial clefts from Northern Europe and the
USA were included in analyses pooling individual-level data. Cases included 4943
moth-ers of children with orofacial clefts (cleft lip only: 1135, cleft palate with cleft lip: 2081,
cleft palate only: 1727) and controls included 10 592 mothers of unaffected children.
Association of orofacial cleft risk with pre-pregnancy maternal weight classified by level
of body mass index (BMI, kg/m
2) was evaluated using logistic regression adjusting for
multiple covariates.
Results:
Cleft palate, both alone and with cleft lip (CP
þ
/-CL), was associated with
mater-nal class II
þ
pre-pregnancy obesity (
35)compared with normal weight [adjusted odds
ratio (aOR)
¼
1.36; 95% confidence interval (CI)
¼
1.16, 1.58]. CP
þ
/-CL was marginally
associated with maternal underweight (aOR
¼
1.16; 95% CI
¼
0.98, 1.36). Cleft lip alone
was not associated with BMI.
Conclusions:
In this largest population-based study to date, we found an increased risk
of cleft palate, with or without cleft lip, in class II
þ
obese mothers compared with
nor-mal-weight mothers; underweight mothers may also have an increased risk, but this
VCThe Author 2016; all rights reserved. Published by Oxford University Press on behalf of the International Epidemiological Association 190
requires further study. These results also suggest that extremes of weight may have a
specific effect on palatal development.
Key words:Cleft lip, cleft palate, maternal weight, underweight, obesity, case-control study
Introduction
Cleft lip and cleft palate are among the most common and
burdensome birth defects.1–3 There is considerable
vari-ation in the occurrence of orofacial clefts by ethnicity, soci-oeconomic status and geographical location. However, there are no consistent global data on time trends in birth prevalence. Further, examining population trends in birth prevalence of orofacial clefts is fraught with difficulties in inferring causation, because potential protective factors and potential risk factors may have changed in frequency over time. Although several genetic factors have been asso-ciated with orofacial clefts, they explain little of the
vari-ation within and between populvari-ations in occurrence.4
Several behavioural and environmental risk factors may in-crease orofacial cleft risk, including maternal exposure to tobacco smoke, medications, workplace teratogens, alco-hol, insufficient folate intake, poor nutrition and
un-planned pregnancy.1,5
Maternal obesity is a serious public health problem in
both developed and developing countries,6 and has been
associated with a wide variety of birth defects.7 Several
obesity-related mechanisms may cause birth defects, including insulin resistance, hyperinsulinaemia, hypergly-caemia, systemic inflammation, oxidative stress, advanced
glycation end-products and genomic damage.8 Maternal
obesity may also be associated with poor nutrient intake and low blood levels of nutrients critical for fetal
develop-ment.9Maternal underweight is also linked to poor
nutri-tion, metabolic abnormalities and poor reproductive
outcomes.10,11Therefore, both extremes of maternal body
weight range may influence the risk of orofacial clefts. Some studies have shown positive associations between
maternal obesity and risk of orofacial clefts,7,12–16whereas
others have not.17–21 Fewer studies have examined the
association between maternal underweight and orofacial
cleft risk, and only two studies found associations;15,19five
other studies were inconclusive.12,13,18,21,22 We
investi-gated the association between maternal pre-pregnancy body mass index (BMI) and risk of orofacial clefts in a pooled analysis of individual-level data from six population-based studies in Denmark, Norway and the USA.
Methods
Study design
The present study reports on pooled case-control analyses of data from six population-based studies conducted in Denmark, Norway and the USA between 1987 and 2008. Each study included data obtained directly from mailed ques-tionnaires or interviews completed by mothers of children af-fected with orofacial clefts (cases) and mothers of unafaf-fected children (controls) after the index pregnancy. Controls in each study included randomly selected children with no birth defects born in the same years and geographical areas as cases. All procedures were approved by local institutional re-view boards. The total sample before any exclusion was 5280 cases and 11 461 controls. The only exclusion criterion was having incomplete data on one or more of the study vari-ables (including BMI and covariates). The final analytical sample included 4943 cases and 10 592 controls.
Denmark
The Danish study included 187 mothers of children with an orofacial cleft, and a random sample of 828 mothers of Key messages
• Maternal pre-pregnancy body mass index has been associated with risk of orofacial clefts in some studies, although
the findings have been inconsistent.
• In the largest international population-based study to date, class IIþobesity was associated with an increased risk of
cleft palate alone and cleft palate with cleft lip.
• Maternal underweight may possibly increase the risk of cleft palate, with or without cleft lip; however, further studies
are needed to determine if this is likely to be a causal association.
• Cleft lip alone was not associated with maternal weight, suggesting that factors related to maternal weight may have
unaffected children born between 1997 and 2003, from the Danish National Birth Cohort study for a nested
case-control analysis.23,24All children born with orofacial clefts
in this cohort were identified through their registration in the Danish National Facial Register, since all cleft repair surgeries are centralized in two hospitals in Denmark. The analytical sample with complete data, collected before de-livery, included 131 cases and 627 controls.
Norway
Two studies were included from Norway. The Norway Facial Clefts Study (NCL) is a population-based case-control study of children born with orofacial clefts
throughout Norway during 1996–2001.25Mothers of 570
cases were recruited from records of infants who received treatment for orofacial clefts at surgical centres when
sur-geries are centralized. Control mothers (n¼763) were
se-lected randomly from all Norway births in the Medical Birth Registry of Norway. The analytical sample with com-plete data included 559 cases and 754 controls.
The Norway National Mother and Child Cohort Study (MoBa) involved a population-level sample of about
100 000 pregnancies between 1999 and 2009.26 The
MoBa cohort contributed 184 children with orofacial clefts and 551 unaffected children randomly selected as controls for a nested case-control analysis. The analytical sample with complete data, collected before delivery, included 139 cases and 426 controls.
Utah
The Utah case-control study included 561 cases with oro-facial cleft born between 1 January 1995 and 30 June 2004 and ascertained via the state-wide birth defect registry, and 660 unaffected births randomly selected from all Utah
birth certificates as controls.27 Utah cases and controls
born after 30 June 2004 were eligible for the U.S. National Birth Defects Prevention Study (NBDPS) with similar protocols, as described below. The analytical sample with complete data included 557 cases and 658 controls.
Iowa
The Iowa case-control study was conducted in 1987–91 with an overall sample of 287 cases identified via the state-wide Iowa Registry of Congenital and Inherited Disorders and 302 controls randomly selected from all Iowa birth
certificates.28 Iowa cases and controls born f1997–2007
were included in the NBDPS, described below with similar protocols. The analytical sample with complete data included 280 cases and 293 controls.
U.S. National Birth Defects Prevention Study
The NBDPS included orofacial cleft cases and controls
from 10 participating states, including Arkansas,
California, Georgia, Iowa, Massachusetts, New Jersey,
New York, North Carolina, Texas and Utah.29 Orofacial
cleft cases were ascertained from birth defect registries in each state, and controls were unaffected live births with a date of delivery during the same time frames as case preg-nancies and randomly selected from either hospital deliv-ery logs (AR and GA 1997–2000; CA, NY, TX 1997– 2007) or birth certificate files (AR 2000–07; GA 2001–07;
IA, MA, NC, NJ, UT 1997–2007).30 The overall
sam-ple from the NBDPS included 3491 cases and 8357 con-trols born between 1997 and 2007. The analytical sample with complete data included 3277 cases and 7834 controls.
Covariates and classification of orofacial clefts
Pre-pregnancy weight and height data were self-reported by mothers in each study. Standard definitions were used
for BMI categories,31 including underweight (BMI <
18.5), normal weight (18.5BMI<25), over-weight (25
BMI <30), obese class I (BMI 30,<35) and obese
classes II and III (BMI35). Covariates of interest as
po-tential confounding factors that were available from all studies were: maternal age in years at time of delivery; ma-ternal smoking and alcohol use during the first trimester (categorized as user vs non-user); use of folic acid supple-ments or multivitamins in the first trimester (user vs non-user); and maternal education as an indicator of socioeco-nomic status (less than high school vs high school graduate or higher).
Orofacial clefts were classified as isolated or non-isolated (occurring with other major birth defects) and into
types including cleft lip only (n¼1135), cleft lip with cleft
palate (n¼2081) or cleft palate only (n¼1727). The
non-isolated orofacial clefts included children with other major birth defects, and in most sites these included known syn-dromes as well as children with multiple birth defects with no known syndrome. It is known that some syndromic forms of orofacial clefts (for example Van der Woude syndrome) share common aetiological factors with isolated orofacial clefts; thus we judged it useful to con-sider orofacial clefts in both groups, as this likely
repre-sents a spectrum of related disorders. However,
Statistical analyses
Logistic regression was used to evaluate the adjusted odds ratios (aORs) and 95% confidence intervals (CIs) as an es-timate of risk of having a child with an orofacial cleft in
underweight, overweight, class I obese and class IIþobese
mothers compared with the reference group of normal-weight mothers. In addition to the potential maternal con-founders described above, we also included indicator vari-ables (fixed effects) for study sites to control for differences in case-control ratios and unobservable confounders across studies. We estimated another model with an ordinal BMI variable instead of the three dummy variables for BMI and compared the two models using a likelihood ratio test. In additional logistic regression models, we included inter-action terms between the study fixed effects and BMI-level dummy variables to test for heterogeneity between studies. As another check for study influence on the pooled sample estimate, we estimated the main fully adjusted models sep-arately for the NBDPS, the largest study, and for the other studies combined. In addition to the fully adjusted models, we estimated for comparison a partially adjusted model that only included the study fixed effects as covariates and omitted the maternal covariates described above. Separate models were evaluated for cleft lip only, cleft lip with cleft palate, cleft palate only and all cleft palates combined. Additional models were estimated excluding non-isolated cases.
Results
Population characteristics
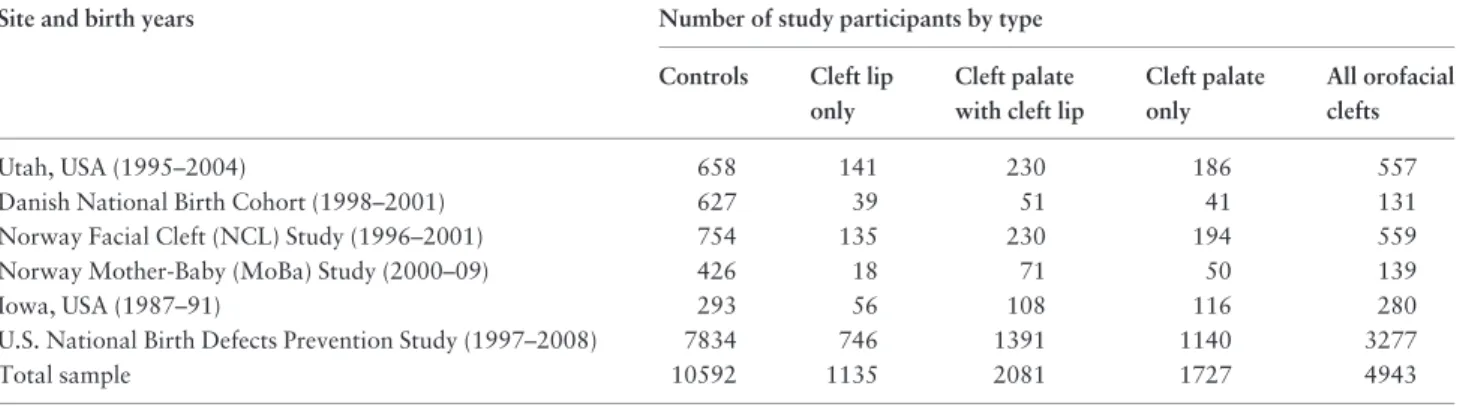
The numbers of controls and cases by orofacial cleft type
in the analytical sample are listed by study site inTable 1.
The rate of missing data overall was 9.4% for cases and 9.2% for controls; this varied between studies, but was close between cases and controls within studies as follows: Utah: 0.7% vs 0.3%, Norway NCL: 1.9% vs 1.2%, Iowa:
2.4% vs 3.0%, U.S. NBDPS: 6.1% vs 6.3%, Norway MoBa cohort: 24.5% vs 22.7%, Danish cohort: 30.0% vs 24.3%. The missing data in the Moba and Danish cohorts were mainly driven by missing data on covariates including smoking, alcohol and education. The distribution of BMI categories and maternal characteristics by case-control
sta-tus is shown in Table 2. Class IIþ obesity (BMI 35)
showed the widest range in prevalence, from a low in the Norway case-control study (2.5% in cases, 0.9% in trols) to a high in the NBDPS (8.7% in cases, 7.0% in con-trols). Mean maternal age at the child’s birth was similar between cases and controls. First-trimester smoking rates ranged from a low in Utah (13.5% in cases, 8.1% in con-trols) to a high in the Norway case-control study (41.3% in cases, 31.8% in controls).
Maternal BMI associations
Risk of cleft palate, both alone and with cleft lip, was asso-ciated with maternal underweight in the partially adjusted
model (Table 3; aOR for all cleft palates¼1.22; 95% CI¼
1.04, 1.43); this association was attenuated in the fully
ad-justed model (aOR¼1.16; 95% CI¼0.98, 1.36). Risk of
cleft palate, alone or with cleft lip, was increased by about 38% in the partially adjusted model (aOR for all cleft
pal-ate¼1.38; 95% CI¼1.18, 1.61) with maternal class IIþ
obesity (BMI 35) vs normal weight; the estimate was
similar in the fully adjusted model (aOR ¼ 1.36; 1.16,
1.58). Class I obesity and overweight were not associated with changes in cleft palate risk. However, a test for trend using an ordinal BMI variable excluding the underweight group and using the normal weight group as the reference, found an increasing trend in risk with increasing BMI levels
(P<0.001). In contrast, there was no evidence that cleft lip
alone was associated with any of the underweight, over-weight or obesity groups, and the aORs were noticeably smaller than those for cleft palate and close to 1.0.
Table 1.Number of controls and orofacial cleft cases by cleft type and study sitea
Site and birth years Number of study participants by type
Controls Cleft lip
only
Cleft palate with cleft lip
Cleft palate only
All orofacial clefts
Utah, USA (1995–2004) 658 141 230 186 557
Danish National Birth Cohort (1998–2001) 627 39 51 41 131
Norway Facial Cleft (NCL) Study (1996–2001) 754 135 230 194 559
Norway Mother-Baby (MoBa) Study (2000–09) 426 18 71 50 139
Iowa, USA (1987–91) 293 56 108 116 280
U.S. National Birth Defects Prevention Study (1997–2008) 7834 746 1391 1140 3277
Total sample 10592 1135 2081 1727 4943
T able 2. Distribution of body weight measu res and maternal characteristics by st udy site and orofacial cleft status a Charac teristi c Mean (SD) or % by stud y site Utah Danish Na tiona l Birth Co hort Norw ay : NCL No rway: Mo Ba Iowa U.S. NBD PS
Case n5
557 Contro l n 5 658
Case n5
131 Con trol n 5 628 Cas e n 5 559 Co ntrol n 5 754 Cas e n 5 139
Control n5
426
Case n5
280 Con trol n 5 293
Case n5
3277
Control n5
A similar pattern of results was generally observed when limiting the analysis to isolated orofacial clefts
(Table 4). The association between underweight and cleft
palate was attenuated in the fully adjusted model, likely driven by the smaller number of cases than the full sample.
The association with class IIþ obesity was also slightly
attenuated in both partially and fully adjusted models in the isolated vs the combined isolated and non-isolated oro-facial cleft groups.
Heterogeneity between studies
The logistic regressions including interaction terms be-tween the BMI levels and study fixed effects in the total analytical sample found little evidence of heterogeneity in the association between BMI and orofacial clefts between
studies (results of interaction tests reported in
Supplementary Table S1, available asSupplementary data
at IJE online). No interactions with underweight,
over-weight or class I obesity were found. For cleft lip with pal-ate and for all cleft palpal-ates combined, a stronger
association with class IIþ obesity in the Norway (NCL)
and Iowa studies (relative to the NBDPS as the
omitted/ref-erence study) was observed (P<0.05). If anything, these
results suggest that some studies could have stronger
asso-ciations with class IIþobesity than the average estimate
based on the pooled analysis.
Also, we overall find a consistent pattern of results when examining the NBDPS alone (the largest study) com-pared with the other studies combined in a separate
analysis, focusing on the fully adjusted model
(Supplementary Table S2 for isolated and non-isolated
clefts combined, and S3 for isolated clefts only, available
asSupplementary dataatIJEonline). The associations
be-tween class IIþobesity and cases with cleft palate (with or
without cleft lip) are observed in both study groups. In the case of underweight however, some differences emerge. Underweight was associated with increased risk of all cleft types, especially in isolated cases in the NBDPS alone but not in the other studies. These results indicate that the esti-mates for underweight and cleft palate are mainly driven by the NBDPS in the pooled estimate, but that the associ-ation with cleft lip may be attenuated when combining all studies.
Sensitivity checks
We estimated additional sensitivity checks for the results. The first of these analyses added family history of orofacial clefts among first-degree relatives, which is captured only in the NBDPS and the Utah study. We estimated the fully adjusted models combining the NBDPS and the Utah study, first without adjustment for family history and then adjusting for an indicator for history of clefts in first-degree relatives. We find overall the same pattern of results as in the total pooled sample without adjustment for family
history (Supplementary Tables S4 for isolated and
non-isolated clefts combined and S5 for non-isolated clefts only,
available as Supplementary data at IJE online).
Furthermore, the association of class IIþobesity with cleft
Table 3.Risk of isolated and non-isolated orofacial cleftsby maternal body mass index (BMI) groupa
Maternal body mass index (BMI) group
Cleft lip only Cleft palate with
cleft lip
Cleft palate only All cleft palates
Partially adjusted odds ratiosb(95%confidence intervals)
Underweight BMI<18.5 1.11 (0.85, 1.45) 1.22 (1.00, 1.50) 1.21 (0.97, 1.50) 1.22 (1.04, 1.43)
Normal weight BMI18.5,<25 1.0 (Reference) 1.0 (Reference) 1.0 (Reference) 1.0 (Reference)
Overweight BMI25,<30 1.00 (0.86, 1.17) 1.02 (0.90, 1.14) 1.08 (0.95, 1.22) 1.04 (0.95, 1.14)
Obese Class I30,<35 BMI 1.06 (0.85, 1.31) 1.16 (0.99, 1.36) 1.10 (0.92, 1.31) 1.13 (1.00, 1.29)
Obese II & III>35 BMI 1.10 (0.84, 1.44) 1.37 (1.13, 1.66) 1.40 (1.14, 1.72) 1.38 (1.18, 1.61)
Fully adjusted odds ratiosc(95%confidence intervals)
Underweight BMI<18.5 1.07 (0.82, 1.40) 1.12 (0.91, 1.37) 1.21 (0.97, 1.51) 1.16 (0.98, 1.36)
Normal weight BMI18.5,<25 1.0 (Reference) 1.0 (Reference) 1.0 (Reference) 1.0 (Reference)
Overweight BMI25,<30 1.00 (0.86, 1.17) 1.01 (0.90, 1.14) 1.06 (0.94, 1.21) 1.03 (0.94, 1.13)d
Obese Class I30,<35 BMI 1.04 (0.84, 1.29) 1.12 (0.95, 1.32) 1.08 (0.90, 1.29) 1.10 (0.97, 1.25)d
Obese II & III35 BMI 1.09 (0.83, 1.42) 1.35 (1.12, 1.64) 1.37 (1.11, 1.69) 1.36 (1.16, 1.58)d
aBody mass index calculated as weight in kg/height in m2; sample includes 1135 cleft lip, ,081 cleft palate with cleft lip, 1727 cleft palate only, 3808 all cleft
palates and 10 592 controls.
bCovariates in multiple logistic regression models include only study site indicators.
cCovariates in multiple logistic regression models include study site indicators, maternal age, indicators for maternal smoking and alcohol use during first three
months of pregnancy, multivitamin or folic acid use and education (less than high school vs high school graduate or greater).
palates is slightly more pronounced when adjusting for family history. The association between underweight and all cleft palate combined also remains suggestive. We also examined the associations of body weight with
non-iso-lated clefts alone by cleft type (Supplementary Table S6,
available as Supplementary data atIJE online). Focusing
on the fully adjusted models, we found that class IIþ
obes-ity is associated with increased risk for all non-isolated cleft types and that the associations are also more pro-nounced (larger odds ratios) than those for isolated
clefts(Supplementary Table S6). Risk also appears to
in-crease with underweight.
In order to examine the possibility of residual con-founding in smoking from differences in smoking intensity, we re-estimated the fully adjusted model replacing any smoking with the number of cigarettes per day (including 0 for non-smokers). We found similar results to those
adjust-ing for any smokadjust-ing (Supplementary Table S7, available as
Supplementary dataatIJEonline).
We also re-estimated a multinomial logistic regression for the three cleft types vs the controls and found virtually the same results as those based on the separate regressions
for each cleft type (Supplementary Table S8, available as
Supplementary dataatIJEonline). Finally, we tested the
difference in association of class IIþobesity with cleft lip
only and all cleft palates combined, by re-estimating the multinomial logit model combining all cleft palates into one category and using a Wald-type test for the difference in odds ratios between cleft lip only and cleft palates
(Supplementary Table S9, available asSupplementary data
atIJEonline). TheP-value for the difference in odds ratios
was 0.11 (0.14 for isolated cases only).
Discussion
We found an increased risk of having a child with cleft
pal-ate, with or without cleft lip, for women with grade IIþ
obesity (BMI35) in the pre-pregnancy period compared
with normal-weight women. Cleft palate, with or without cleft lip, was associated with maternal underweight; how-ever, this was attenuated in the fully adjusted model. This finding suggests that underweight mothers may also have an increased risk, but further study is needed to examine if this is a causal association. Cleft lip alone was overall not associated with BMI.
This pooled analysis represents the largest international study to date of environmental risk factors including ma-ternal weight, based on a consortium of studies with popu-lation-based ascertainment of orofacial clefts and controls. All studies collected similar data on pre-pregnancy weight and covariates. Study limitations included the potentialof recall bias inherent to case-control studies, though this would not apply to the Norwegian and Danish cohort studies since data were collected close to the end of the first trimester. Maternal pre-pregnancy height and weight were self-reported; thus some error in reporting is possible, as weight tends to be overestimated by underweight persons
and underestimated by obese persons.32Such errors would
be expected to bias BMI effects on orofacial cleft risk to-ward the null, and thus the observed associations for cleft
Table 4.Risk of isolated orofacial clefts by maternal body mass index (BMI) groupa
Maternal body mass index (BMI) group
Cleft lip only Cleft lip with
cleft palate
Cleft palate only All cleft palate
Partially adjusted odds ratiosb(95%confidence intervals)
Underweight BMI<18.5 1.07 (0.81, 1.42) 1.24 (1.00, 1.54) 1.15 (0.90, 1.48) 1.21 (1.02, 1.44)
Normal weight BMI18.5,<25 1.0 (Reference) 1.0 (Reference) 1.0 (Reference) 1.0 (Reference)
Overweight BMI25,<30 1.01 (0.86, 1.18) 1.02 (0.90, 1.16) 1.02 (0.88, 1.17) 1.02 (0.92, 1.13)
Obese Class I30,<35 BMI 1.07 (0.86, 1.33) 1.12 (0.94, 1.33) 1.11 (0.91, 1.35) 1.11 (0.97, 1.28)
Obese II & III35 BMI 1.04 (0.78, 1.37) 1.34 (1.09, 1.64) 1.32 (1.05, 1.67) 1.33 (1.13, 1.57)
Fully adjusted odds ratiosc(95%confidence intervals)
Underweight BMI<18.5 1.04 (0.78, 1.39) 1.12 (0.91, 1.40) 1.14 (0.89, 1.48) 1.14 (0.95, 1.36)
Normal weight BMI18.5,<25 1.0 (Reference) 1.0 (Reference) 1.0 (Reference) 1.0 (Reference)
Overweight BMI25,<30 1.00 (0.85, 1.17) 1.01 (0.89, 1.15) 1.02 (0.88, 1.18) 1.02 (0.92, 1.13)d
Obese Class I30,<35 BMI 1.05 (0.84, 1.31) 1.09 (0.91, 1.30) 1.09 (0.89, 1.33) 1.09 (0.95, 1.25)d
Obese II & III35 BMI 1.03 (0.78, 1.37) 1.30 (1.05, 1.60) 1.29 (1.02, 1.64) 1.29 (1.10, 1.53)d
aBody mass index, weight calculated as weight in kg/height in m2; sample includes 1030 cleft lip, 1743 cleft palate with cleft lip, 1275 cleft palate only, 3018
all cleft palate and 10 592 controls.
bCovariates in multiple logistic regression models include study site indicators.
cCovariates in multiple logistic regression models include study site indicators, maternal age, indicators for maternal smoking and alcohol use during first three
months of pregnancy, multivitamin or folic acid use and education (less than high school vs high school graduate or greater).
palate in the present study may be slightly underestimated. Despite inclusion of data on several potential confounders, including smoking, alcohol use, folic acid and multivitamin intake and education in multivariate models, residual con-founding is a possibility; however, whereas there were ob-servable differences between cases and controls in potential confounding factors, adjusting for them did not have a major impact on the results related to maternal weight. It is also uncertain whether these results can be generalized to populations in low-resource settings.
Our findings are consistent with several previous
stud-ies.7,12–14,16Queisser-Luftet al.were among the first to
re-port an elevated risk of orofacial clefts with maternal
obesity (OR¼1.7; 95% CI: 1.1, 2.8; orofacial cleft type
was unspecified).14 Cedergren et al., using Swedish
Medical Birth Registry data, found associations between
BMI>29 and cleft lip and palate (aOR¼1.42; 95% CI:
1.00, 1.84).13 A later paper from the Swedish registry
found that women with a>3-unit increase in
pre-pregnancy BMI at the beginning of their second pre-pregnancy compared with the beginning of their first pregnancy, had a 2.3-fold higher risk of cleft palate in their infant, but the
risk of cleft lip was not increased.16 In a meta-analysis,
Stothardet al. found that obese mothers had an increased
risk of isolated cleft palate and cleft palate with cleft lip,
but no increase in risk of cleft lip only.7In an analysis of
birth certificate data from Florida, Blocket al.found
obes-ity was associated with an increase in risk of cleft lip with or without cleft palate and with cleft palate only, but did
not evaluate cleft lip only.12Furthermore, the accuracy of
body weight and height and covariate data in birth
certifi-cates may be less than in data collected in interviews.33
Several other studies were less conclusive due to one or more of the following issues: limitations in study design including small sample sizes, limited data on potential con-founding or modifying factors, birth certificate data with excessive missing data or inconsistent definitions of BMI
groups and orofacial cleft types.15,17–21 Few studies have
examined the association between maternal pre-pregnancy underweight, only two studies found associations with
oro-facial cleft risk15,19 and five other studies were
inconclu-sive.12,13,18,21,22Our study is the largest population-based
sample to date that simultaneously evaluated five body weight categories—underweight, normal weight,
over-weight, class I obese and class IIþobese—for the three
oro-facial cleft types separately.
Our study strengthens and extends the findings of the
previously published NBDPS study15 based on a much
smaller sample size that found an elevated risk for cleft lip with or without cleft palate among underweight mothers; no other birth defects of any type were associated with ma-ternal underweight. An association was also reported
between maternal obesity (BMI30) and increased risk of
cleft lip with or without cleft palate in infants with mul-tiple (non-isolated) birth defects, but not in the children with isolated clefts; the group with cleft lip only was not analysed separately, and combining this group with cleft palates may be one reason why no association was found between obesity and isolated clefts in the combined lip and palate groups.
Cleft lip alone and cleft lip with cleft palate are often viewed as aetiologically similar, differing only in severity; a severe cleft in the lip can lead to a cleft in the hard palate which may be viewed as a secondary effect of disturbance
in the primary palate.34Cleft lip can however occur with a
cleft of the soft but not hard palate, evidence of two
separ-ate defects.35In a study of Norwegian cases, Harvilleet al.
found that cleft lip alone, compared with cleft lip and pal-ate, was less likely to occur with other birth defects, less common among boys and more likely among twins and
parents who were closely related.36 These authors
sug-gested that cleft lip only and cleft lip with cleft palate should be analysed separately, to explore the possibility that some risk factors may affect one but not the other. Our study supports the theory of different aetiological mechanisms between cleft lip alone and cleft lip with pal-ate, and suggests that they should be considered separately; furthermore, our studies suggest that cleft lip with cleft pal-ate and cleft palpal-ate alone may share certain risk factors or causal pathways.
The underlying mechanisms for the increased risk of cleft palate in both underweight and obese mothers are unclear and could be very different. In additional models, we added two indicators for maternal diabetes and
hypertension (Supplementary Table S10, available as
Supplementary dataatIJEonline), first combining isolated
and non-isolated orofacial clefts and then for isolated oro-facial clefts only. We found generally similar patterns for BMI results especially for the models combining isolated
and non-isolated cases; the class IIþ obesity associations
slightly decreased but remained strong for cleft palate. We did not control for diabetes and hypertension in the main model, as these may be causally influenced by body weight in which case they would be mediators rather than con-founders. Nonetheless, these additional results suggest that the observed associations with body weight are not ex-plained by these two risk factors.
Our results suggest that the substantial rise in the
preva-lence of obesity37may result in an increased occurrence of
pre-pregnancy weight, underscores the need for mechanis-tic studies to understand the underlying causes and for public health campaigns with periconceptional care that promote the maintenance of normal, healthy weight.
Supplementary Data
Supplementary dataare available atIJEonline.
Funding
This study was primarily funded by U.S. National Institutes of Health (NIH) / National Institute of Dental and Craniofacial Research (NIDCR) grant 1 R01 DE020895. Additional funding for data collection was provided by the following NIH grants, DE02089, DE05700, DE08559, DE09170 and HD39061; the Intramural Research Program of the NIH National Institute of Environmental Health Sciences (ZIA-ES-49027); U.S. Centers for Disease Control and Prevention grants DD000492,
U01-D000698 and U01-DD001035; and Utah State University
Agricultural Experiment Station project 1053. The findings and con-clusions in this report are those of the authors and do not necessarily represent the official position of the Utah Department of Health, the California Department of Public Health or of the Centers for Disease Control and Prevention.
Conflict of interest:None
Acknowledgements
We thank the Utah Department of Health and the California Department of Public Health Maternal Child and Adolescent Health Division for providing data.
References
1. Mossey PA, Little J, Munger RG, Dixon MJ, Shaw WC. Cleft lip
and palate.Lancet2009;374:1773–85.
2. Wehby GL, Cassell CH. The impact of orofacial clefts on quality
of life and healthcare use and costs.Oral Dis2010;16:310.
3. Wehby GL, Pedersen DA, Murray JC, Christensen K. The effects
of oral clefts on hospital use throughout the lifespan. BMC
Health Serv Res2012;12:58.
4. Mossey PA, Shaw WC, Munger RG, Murray JC, Murthy J, Little J. Global oral health inequalities: challenges in the prevention
and management of orofacial clefts and potential solutions.Adv
Dent Res2011;23:247–58.
5. Wehby GL, Felix TM, Goco Net al. High dosage folic acid
sup-plementation, oral cleft recurrence and fetal growth. Int J
Environ Res Public Health2013;10:590–605.
6. Malik VS, Willett WC, Hu FB. Global obesity: trends, risk
fac-tors and policy implications.Nat Rev Endocrinol2013;9:13–27.
7. Stothard KJ, Tennant PW, Bell R, Rankin J. Maternal over-weight and obesity and the risk of congenital anomalies: a
sys-tematic review and meta-analysis.JAMA2009;301:636–50.
8. Correa A, Gilboa SM, Besser LMet al. Diabetes mellitus and
birth defects.Am J Obstet Gynecol2008;199:237 e1–9.
9. King JC. Maternal obesity, metabolism, and pregnancy
out-comes.Ann Rev Nutr2006;26:271–91.
10. Hoellen F, Hornemann A, Haertel Cet al. Does maternal
under-weight prior to conception influence pregnancy risks and
out-come?In Vivo2014;28:1165–70.
11. Tobi EW, Goeman JJ, Monajemi R,et al. DNA methylation
sig-natures link prenatal famine exposure to growth and metabol-ism.Nat Commun2014;5:5592.
12. Block SR, Watkins SM, Salemi JLet al.Maternal pre-pregnancy
body mass index and risk of selected birth defects: evidence of a
dose-response relationship. Paediatr Perinat Epidemiol
2013;27:521–31.
13. Cedergren M, Kallen B. Maternal obesity and the risk for
orofa-cial clefts in the offspring. Cleft Palate Craniofac J
2005;42:367–71.
14. Queisser-Luft A, Kieninger-Baum D, Menger H, Stolz G, Schlaefer K, Merz E. [Does maternal obesity increase the risk of fetal abnormalities? Analysis of 20,248 newborn infants of the Mainz Birth Register for detecting congenital abnormalities]. Ultraschall Med1998;19:40–44.
15. Waller DK, Shaw GM, Rasmussen SAet al. Prepregnancy
obes-ity as a risk factor for structural birth defects. Arch
PediatrAdolesc Med2007;161:745–50.
16. Villamor E, Sparen P, Cnattingius S. Risk of oral clefts in relation
to prepregnancy weight change and interpregnancy interval.Am
J Epidemiol2008;167:1305–11.
17. Moore LL, Singer MR, Bradlee ML, Rothman KJ, Milunsky A. A prospective study of the risk of congenital defects associated
with maternal obesity and diabetes mellitus. Epidemiology
2000;11:689–94.
18. Oddy WH, De Klerk NH, Miller M, Payne J, Bower C. Association of maternal pre-pregnancy weight with birth defects:
evidence from a case-control study in Western Australia.Aust N
Z J Obstet Gynaecol2009;49:11–15.
19. Rankin J, Tennant PW, Stothard KJ, Bythell M, Summerbell CD, Bell R. Maternal body mass index and
congeni-tal anomaly risk: a cohort study. Int J Obes 2010;34:
1371–80.
20. Shaw GM, Todoroff K, Schaffer DM, Selvin S. Maternal height and prepregnancy body mass index as risk factors for selected
congenital anomalies. Paediatr Perinat Epidemiol 2000;14:
234–39.
21. Watkins ML, Rasmussen SA, Honein MA, Botto LD, Moore
CA. Maternal obesity and risk for birth defects. Pediatrics
2003;111(5 Pt 2):1152–58.
22. Marengo L, Farag NH, Canfield M. Body mass index and birth
defects: Texas, 2005-2008. Matern Child Health J
2013;17:1898–907.
23. Bille C, Olsen J, Vach Wet al.Oral clefts and life style factors - a
case-cohort study based on prospective Danish data. Eur J
Epidemiol2007;22:173–81.
24. Olsen J, Melbye M, Olsen SFet al.The Danish National Birth
Cohort - its background, structure and aim. Scand J Public
Health2001;29:300–07.
25. Wilcox AJ, Lie RT, Solvoll Ket al. Folic acid supplements and
risk of facial clefts: national population based case-control study.
BMJ2007;334:464.
26. Magnus P, Irgens LM, Haug K et al. Cohort profile: The
Norwegian Mother and Child Cohort Study (MoBa). Int J
27. Munger RG, Tamura T, Johnston KEet al. Oral clefts and maternal biomarkers of folate-dependent one-carbon
metabol-ism in Utah. Birth Defects Res A Clin Mol Teratol
2011;91:153–61.
28. Munger RG, Romitti PA, Daack-Hirsch S, Burns TL, Murray JC, Hanson J. Maternal alcohol use and risk of orofacial cleft
birth defects.Teratology1996;54:27–33.
29. Yoon PW, Rasmussen SA, Lynberg MCet al. The National Birth
Defects Prevention Study.Public Health Rep2001;116(Suppl 1):
32–40.
30. Rasmussen SA, Olney RS, Holmes LB et al. Guidelines for
case classification for the National Birth Defects
Prevention Study.Birth Defects Res A Clin Mol Teratol2003;
67:193–201.
31. Ogden CL, Carroll MD, Curtin LR, McDowell MA, Tabak CJ, Flegal KM. Prevalence of overweight and obesity in the United
States, 1999-2004.JAMA2006;295:1549–55.
32. Stommel M, Schoenborn CA. Accuracy and usefulness of BMI measures based on self-reported weight and height: findings
from the NHANES & NHIS 2001-2006.BMC Public Health
2009;9:421.
33. Srisukhumbowornchai S, Krikov S, Feldkamp ML. Self-reported maternal smoking during pregnancy by source in Utah,
2003-2007.Birth Defects Res A Clin Mol Teratol2012;94:996–1003.
34. Mossey PA, Little J. Epidemiology of oral clefts: an international
perspective. In: Wyszynski D (ed).Cleft Lip and Palate: from
Origin to Treatment. New York, NY: Oxford University Press, 2002.
35. Saal H. Classfication and description of nonsyndromic clefts. In:
Wyszynski D (ed). Cleft Lip and Palate: from Origin to
Treatment. New York, NY: Oxford University Press, 2002. 36. Harville EW, Wilcox AJ, Lie RT, Vindenes H, Abyholm F. Cleft
lip and palate versus cleft lip only: are they distinct defects?Am J
Epidemiol2005;162:448–53.
37. Ng M, Fleming T, Robinson Met al. Global, regional, and
na-tional prevalence of overweight and obesity in children and adults during 1980-2013: a systematic analysis for the Global