USE OF ATTENTION DEMANDING TASKS TO ESTIMATE FALL RISK AND DAILY WALKING ACTIVITY IN SUBACUTE STROKE
Jody Ann Feld
A dissertation submitted to the faculty at the University of North Carolina at Chapel Hill in partial fulfillment of the requirements for the degree of Doctor of Philosophy in Human
Movement Science.
Chapel Hill 2019
ABSTRACT
Jody Ann Feld: Use of attention demanding tasks to estimate fall risk and walking activity in subacute stroke
(Under the direction of Prudence Plummer)
This dissertation is dedicated to a few of my greatest role models: Reginald (Grandpa) Brian Newman
Jeane (GiGi) Darlington Feld Margaret (Aunt Peggy) F. Meinzer
Donald (Uncle Don) F. Newman Reginald (Uncle Reg) B. Newman, II
ACKNOWLEDGEMENTS
To my advisor, Dr. Prue Plummer, thank you for inspiring me to become a clinician scientist and scholar over the past four years. I can confidently say that coming back to school was one of the best decisions of my professional life. Thank you for your time, energy, patience, loyalty, and humor. Your passion and drive for moving science forward is infectious, and you have helped me accomplish more than I ever imagined possible. I am privileged to have been your student, and I am forever grateful for all you have given me.
To my committee members, Dr. Carol Giuliani, Dr. Vicki Mercer, Dr. Darcy Reisman, and Dr. Adam Goode, thank you for your ongoing support and guidance. Your diverse experience and expertise have strengthened my dissertation project and my development as a clinician researcher. Special thank you to Dr. Adam Goode for his guidance and patience in all things statistics.
To my wife, Tara, and our fur-babies, Molly and Bailey, thank you for being by my side for every step along this journey. You inspire me every day by your caring and generous heart, and love for our family, near and far. You make me smile and laugh at life’s rewards and challenges. Our life together makes me a better person every day and for that I am truly blessed.
For all of my extended family and friends, you bring joy, laugher, and adventure to my life. Thank you for your energy, support, understanding, patience, and high fives along the way. To be surrounded with such a strong network makes life a true blessing.
To my lab colleagues, thank you for all of your support over the past four years. Your energy and enthusiasm for our research and our natural camaraderie made coming to the lab each day motivating and fun. Thank you for always being there to pick me up through the rough moments and always being eager to celebrate the joyful moments.
To the physical, occupational and speech therapists at UNC Hospital in Chapel Hill and Duke Health for their support and effort towards this study.
To the HMSC program and faculty, thank you for the opportunity to complete my doctoral degree at UNC-CH and the HMSC Program. Each faculty member has taught me something meaningful along the way that I will carry with me into the next chapter. Thank you for continuing to strive to train well-rounded scientists.
To my patients, past and future, thank you for trusting me, teaching me more than you will ever know, and for inspiring me to become a clinician researcher focused on improving the quality of your lives in meaningful ways. You will always be my inspiration and driving force.
TABLE OF CONTENTS
LIST OF TABLES ... xiv
LIST OF FIGURES ... xx
LIST OF ABBREVIATIONS ... xxi
CHAPTER 1: INTRODUCTION ... 1
Specific Aims, Hypotheses, and Rationales ... 3
Specific Aim 1 ... 3
Specific Aim 2 ... 8
Exploratory Aim 3 ...10
Operational Definitions ... 11
CHAPTER 2: REVIEW OF LITERATURE ... 12
Disability Post Stroke: Impact on Falls and Walking Activity ... 12
Rationale for Methodological Design ... 14
Factors Associated with Falls Post Stroke ... 15
Obstacle Crossing ...16
Completion of task and gait performance ...16
Situational awareness during obstacle crossing...18
Additional Factors Associated with Falls ...19
Factors Associated with Walking Activity Post Stroke ... 22
Gait speed as an indicator of physical activity post stroke ...22
Dual-task Paradigm ...25
CHAPTER 3: EXPERIMENTAL DESIGN AND METHODS ... 33
Participants ... 33
Research design ... 34
Procedures ... 35
Recruitment ...35
Consent and Screening ...36
Baseline Assessments ...37
Clinical Assessments ...37
Self-report measures ...39
1. Activities-specific Balance Confidence (ABC) Scale ...39
2. Walking Impact Scale (Walk-12)...39
3. Patient Health Questionnaire 9 (PHQ-9) ...40
4. International Physical Activity Questionnaire (IPAQ) ...41
Physical Performance Measures ...42
1. 5-meter Walk Test (5mWT) ...42
2. 5 Times Sit to Stand (5XSTS) ...42
3. Step Test ...43
4. 2-minute Walk Test (2MWT) ...43
Attention-Demanding Task Assessments ...44
Obstacle-crossing (Aim 1) ...45
Dual-Task Paradigm (Aim 2) ...48
Fall and Rehabilitation Diary ...51
Phone Check-ins ...52
3-Month Post Discharge Follow-up ...53
Physical Activity Measures...53
1. Physical Activity Scale for Individuals with Physical Disability (PASIPD) ...53
1. Subjective Index of Physical and Social Outcome (SIPSO) ...55
Data processing and reduction ... 56
Obstacle-crossing (Aim 1) ...56
Outcome Variable ...56
Fall Status ...56
Main Exposure ...56
Obstacle-Crossing Ability ...56
Potential Covariates...57
Gait Performance ...57
Gaze Behavior ...60
Dual-Task Paradigm (Aim 2) ...62
Outcome ...62
Physical Activity ...62
Main Exposure and Covariates ...62
Spatiotemporal parameters of gait ...62
Cognitive Category Naming Task ...64
Data analysis ... 64
Aim 1 Data Analysis: ...64
Sample size justification for Aim 1: ...67
Aim 2 Data Analysis: ...68
Sample size justification for Aim 2: ...71
Exploratory Aim 3: ...72
Management of missing data ...72
CHAPTER 4: RESULTS ... 74
Participant recruitment and retention ... 74
Participants ... 76
Language, cognition, vision, and comorbidity ...78
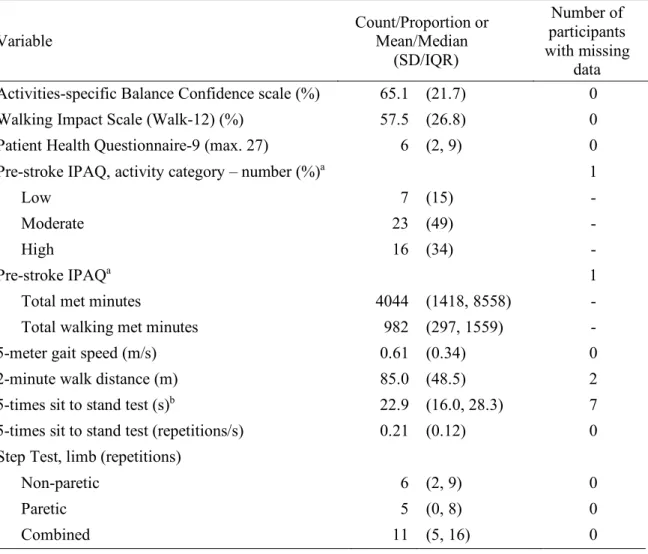
Clinical self-report and physical performance outcomes...79
Disability outcomes ...81
Descriptive summary of participants at 3-month follow-up assessment ... 82
Participant characteristic ...82
Phone Check-in...83
Self-reported physical activity, social participation and community...84
Obstacle-crossing exposure and fall status outcome results (Aim 1)... 84
Fall Characteristics ...85
Obstacle-crossing performance characteristics ...86
Obstacle-crossing spatial temporal parameters of gait during obstacle-crossing ...87
Visual tracking during obstacle-crossing ...88
Analysis of differences for participants classified as fallers or non-fallers at 3 months post hospital discharge ...90
Analysis of bivariate associations between demographic, stroke, language, cognition, vision, self-report, physical performance, disability, gait performance during obstacle crossing, visual tracking variables and outcome of fall status (faller/non-faller) ...92
Analysis of differences between participants classified as pass or fail for the obstacle- crossing task ...93
Analysis of bivariate associations between demographic, stroke, language, cognition, vision, self-report, physical performance, disability, gait performance during obstacle crossing, visual tracking variables and main exposure of obstacle crossing ...95
Assessment of correlations between covariates for the binary logistic regression models ...96
Binary Logistic Regression Results ...97
Dual-task walking exposure and daily walking activity outcome results (Aim 2): ... 100
Dual-task effect on gait and cognitive parameters ... 101
Pattern of Cognitive-Motor Dual-task Interference ... 102
Walking activity measured by PAMSys activity monitor ... 105
Functional Ambulation Categories ... 106
ambulators ... 109
Analysis of bivariate associations between demographic, stroke, language, cognition, vision, self-report, physical performance, disability, gait performance during obstacle crossing, visual tracking variables and outcome of ambulator status (household or community) ... 111
Bivariate linear regressions between variables and main exposure of dual-task gait speed ... 112
Assessment of correlations between covariates for the binary logistic regression models ... 113
Relationship between dual-task gait speed and steps per day ... 113
Binary Logistic Regression Results ... 114
Impact of discharge facility and amount of therapy on observed associations (Aim 3) ... 117
Summary of discharge facility and rehabilitation services ... 118
Impact of discharge facility on association between obstacle-crossing ability and falls ... 118
Analysis of differences for obstacle-crossing ability and falls ... 118
Stratified binary logistic regression for discharge facility ... 119
Impact of rehabilitation services on association between obstacle-crossing ability and falls ... 120
Analysis of differences for obstacle crossing ability and falls ... 120
Stratified binary logistic regression for rehabilitation services ... 120
Impact of discharge facility on association between dual-task gait speed and walking activity ... 121
Analysis of differences in dual-task gait speed and functional ambulation status ... 121
Stratified binary logistic regression for discharge facility ... 122
Impact of rehabilitation services on association between dual-task gait speed and walking activity ... 123
Analysis of differences in dual-task gait speed and functional ambulation status ... 123
Stratified binary logistic regression for rehabilitation services ... 123
CHAPTER 5: DISCUSSION ... 125
Incidence of falls in subacute stroke ... 125
Obstacle-crossing ability and fall-risk in subacute stroke ... 126
Dual-task gait speed and walking activity in subacute stroke ... 136
Limitations ... 139
Future research directions ... 141
Conclusions ... 142
APPENDIX 1: PHONE CHECK-IN QUESTIONNAIRE ... 143
APPENDIX 2: ADDITIONAL FIGURE FOR CHAPTER 3 ... 144
APPENDIX 3: ACTIVITY MONITOR INSTRUCTIONS AND LOG ... 145
APPENDIX 4: ADDITIONAL TABLES FOR CHAPTER 4 ... 149
Obstacle-crossing exposure and fall status outcome results (Aim 1) ... 149
Analysis of differences for participants classified as faller or non-faller ... 149
Analysis of bivariate associations between variables and outcome of fall ... 154
Analysis of differences between participants classified as pass or fail for the obstacle- crossing task... 159
Analysis of bivariate associations between variables and main exposure of obstacle- crossing... 164
Assessment of correlations between covariates for the binary logistic regression models ... 169
Dual-task walking and daily walking activity (Aim 2): ... 172
Analysis of differences for participants classified as household versus community ambulators ... 172
Analysis of bivariate associations between variables and outcome of ambulator status ... 177
Bivariate linear regressions between variables and main exposure of dual-task gait speed ... 181
Assessment of correlations between variables for the binary logistic regression models ... 183
LIST OF TABLES
Table 1.1. Summary of Specific Aim 1 ... 7
Table 1.2. Summary of Specific Aim 2 ... 10
Table 2.1. Functional walking categories, daily steps per day (SPD), and gait speed ... 24
Table 2.2. Regression model summary ... 25
Table 3.1. Selection criteria for study participants ... 34
Table 3.2: Baseline self-report and physical performance assessments. ... 38
Table 3.3. Participant instructions for the obstacle-crossing task ... 46
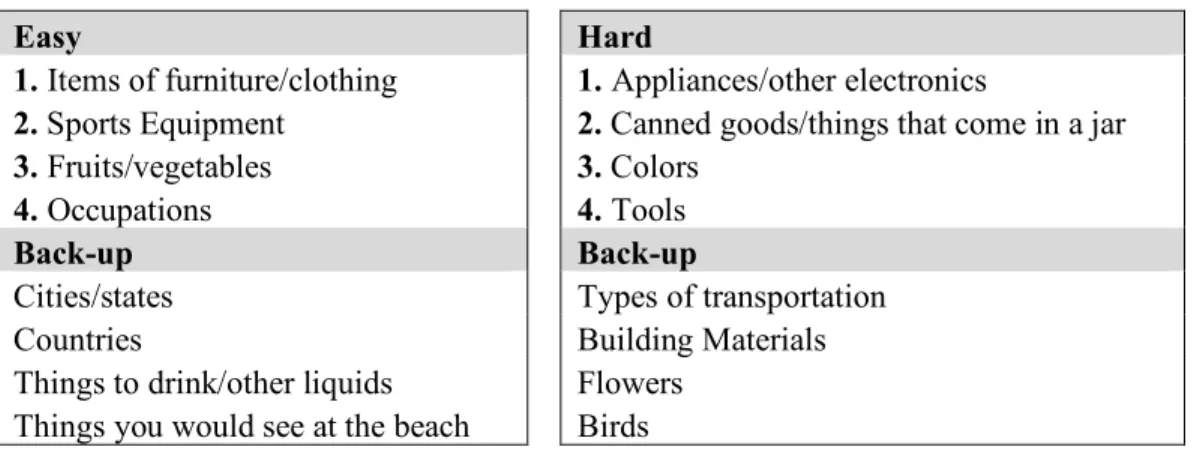
Table 3.4. Easy, hard, and back-upcategories for four trials of single- and dual-task conditions ... 50
Table 3.5. Participant instructions for single-task and dual-task walking conditions ... 51
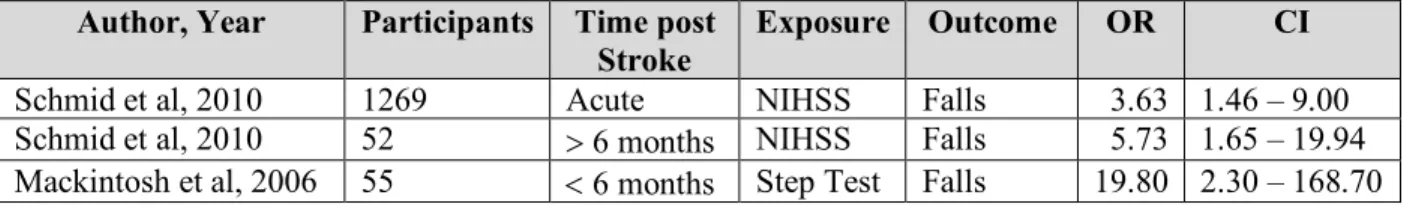
Table 3.6. Summary of previous reported exposure and outcome odds ratios and confidence intervals ... 68
Table 3.7. Summary of previous reported exposure and outcome odds ratios and confidence intervals ... 72
Table 4.1. Participant demographics (n = 47). ... 76
Table 4.2. Participant stroke characteristics (n = 47). Values are the count (proportion) or mean/median (SD/IQR). ... 77
Table 4.3. Participant (n = 47) language, cognition, vision, and comorbidity levels. Values are the count (proportion) or mean (SD). ... 78
Table 4.4. Participant (n = 47) self-report and physical performance outcomes.. ... 80
Table 4.5. Participant (n = 47) disability outcomes. ... 82
Table 4.6. Participant demographic characteristics at 3-month post discharge follow-up. ... 83
Table 4.8. Spatiotemporal parameters of gait during obstacle-crossing for
all participants... 87 Table 4.9. Visual tracking parameters during obstacle-crossing ... 89 Table 4.10. Unadjusted binary logistic regression model for the exposure
obstacle-crossing ability and outcome of faller ... 97 Table 4.11. Adjusted binary logistic regression model for the exposure
obstacle-crossing ability and outcome of faller considering covariates participant demographics (age and sex) and stroke characteristics (days
post stroke and post-stroke disability) ... 99 Table 4.12. Adjusted backward stepwise (Wald) binary logistic model for
the exposure obstacle-crossing ability and outcome of faller considering covariates of self-reported impact of stroke on walking (Walk-12), walking endurance (2MWT), balance and lower extremity motor control (Step Test -
paretic limb), and pre-obstacle step length variability (COV) ... 100 Table 4.13. Participant (n = 47) mean/median values (SD/IQR) for gait and
cognitive variables under single- and dual-task conditions and the mean difference between single- and dual-task conditions with associated P values
adjusted for multiple comparisons ... 102 Table 4.15. Participants (n = 43) activity monitor recording and walking
activity measures... 106 Table 4.16. Functional ambulation categories based on total number of steps
per day (SPD) ... 106 Table 4.17. Activity monitor recording and walking activity measures for all
participants and separately for household and community ambulators at 3
months post hospital discharge ... 108 Table 4.18. Unadjusted binary logistic regression model for the exposure
dual-task gait speed and outcome of community ambulator based on steps
per day (SPD). ... 115 Table 4.19. An adjusted binary logistic regression model for the exposure
dual-task gait speed, covariates of age and self-reported pre-stroke physical activity level category (IPAQ) and outcome of functional ambulation status
(household or community) based on steps per day (SPD) ... 116 Table 4.20. An adjusted backward stepwise (Wald) binary logistic model for
DTE on gait and cognition, ambulatory endurance (2MWT), and self-
reported pre-stroke physical activity level category (IPAQ) ... 117
Table 4.21. Binary logistic model for the exposure obstacle-crossing ability and outcome of faller considering the discharge facility ... 119
Table 4.22. Stratified binary logistic model for the exposure obstacle- crossing ability and outcome of faller considering rehabilitation services ... 121
Stratified binary logistic model for the exposure dual-task gait speed and outcome of functional ambulation status considering rehabilitation services. ... 122
Table 4.24. Stratified binary logistic model for the exposure dual-task gait speed and outcome of functional ambulator status considering rehabilitation services ... 124
APPENDIX Table A4.1. Demographics ... 149
Table A4.2. Stroke characteristics ... 149
Table A4.3. Language, cognition, vision, and comorbidity outcomes ... 149
Table A4.4. Self-report and physical performance measures ... 151
Table A4.5. Disability outcomes for all participants and separately for faller and non-faller status. ... 152
Table A4.6. Spatiotemporal parameters of gait during obstacle-crossing for all participants and separately for faller and non-faller status. ... 153
Table A4.7. Visual tracking parameters for all participants and separately for faller and non-faller status. ... 154
Table A4.8. Bivariate associations between demographic variables and the outcome of falling for all participants ... 154
Table A4.9. Bivariate associations between stroke variables and the outcome of falling for all participants ... 155
performance variables and the outcome of falling for all participants ... 156 Table A4.12. Bivariate associations between disability variables and the
outcome of falling for all participants ... 157 Table A4.13. Bivariate associations between spatiotemporal variables of
gait during obstacle-crossing and the outcome of falling for all participants ... 158 Table A4.14 Bivariate associations between visual tracking parameters and
the outcome of fall status for all participants ... 159 Table A4.15. Demographics for all participants and separately for obstacle
success and obstacle failure status. ... 159 Table A4.16. Stroke characteristics for all participants and separately for
obstacle fail and obstacle pass status. ... 159 Table A4.17. Language, cognition, vision, and comorbidity outcomes for
all participants and separately for obstacle fail and obstacle pass status. ... 160 Table A4.18. Self-report and physical performance measures for all
participants and separately for obstacle fail and obstacle pass status. ... 161 Table A4.19. Disability outcomes for all participants and separately for
obstacle fail and obstacle pass status. ... 162 Table A4.20. Spatiotemporal parameters of gait during obstacle-crossing
for all participants and separately for obstacle fail and obstacle pass status. ... 163 Table A4.21. Visual tracking parameters for all participants and separately
for obstacle fail and obstacle pass status ... 164 Table A4.22. Bivariate associations between demographic variables and
main exposure of obstacle-crossing performance for all participants ... 164 Table A4.23. Bivariate associations between stroke variables and main
exposure of obstacle-crossing for all participants ... 164 Table A4.24. Bivariate associations between language, cognition, vision,
and comorbidity variables and main exposure of obstacle-crossing for all
participants ... 165 Table A4.25. Bivariate associations between self-report and physical
performance variables and main exposure of obstacle-crossing for all
Table A4.26. Bivariate associations between disability variables and main
exposure of obstacle-crossing for all participants ... 167 Table A4.27. Bivariate associations between spatiotemporal parameters of
gait variables and main exposure of obstacle-crossing for all participants ... 168 Table A4.28. Bivariate associations between visual tracking parameters and
main exposure of obstacle- crossing for all participants ... 169 Table A4.29 Spearman correlation coefficients for stroke characteristics. ... 169 Table A4.30. Spearman correlation coefficients for self-report and physical
performance measures. ... 170 Table A4.31. Spearman correlation coefficients for spatiotemporal parameters
of gait during obstacle-crossing. ... 171 Table A4.32. Demographics for all participants and separately for household
and community ambulators at 3 months post hospital discharge. ... 172 Table A4.33. Stroke characteristics for all participants and separately household
and community ambulators at 3 months post hospital discharge. ... 173 Table A4.34. Language, cognition, vision, and comorbidity outcomes for all
participants and separately household and community ambulators at 3 months
post hospital discharge. ... 173 Table A4.35. Self-report and physical performance measures for all
participants and separately for household and community ambulators at 3
months post hospital discharge. ... 174 Table A4.36. Disability outcomes for all participants and separately for
household and community ambulators at 3 months post hospital discharge. ... 175 Table A4.37. Gait and cognitive variables under single- and dual-task
conditions for all participants and separately for household and community
ambulators at 3 months post hospital discharge. ... 176 Table A4.38. Bivariate associations between demographic variables and
the outcome of functional ambulation status based on total daily SPD at
3 months post hospital discharge for all participants ... 177 Table A4.39. Bivariate associations between stroke variables and the
outcome of functional ambulation status based on total daily SPD at 3
Table A4.40. Bivariate associations between language, cognition, vision, and comorbidity variables and the outcome of functional ambulation status
based on total daily SPD at 3 months post hospital discharge for all participants ... 177 Table A4.41. Bivariate associations between self-report and physical
performance variables and the outcome of functional ambulation status based on total daily SPD at 3 months post hospital discharge for all
participants ... 178 Table A4.42. Bivariate associations between disability variables and the
outcome of functional ambulation status based on total daily SPD at 3
months post hospital discharge for all participants ... 179 Table A4.43. Bivariate associations between gait and cognitive variables
under single- and dual-task conditions and the outcome of functional ambulation status based on total daily SPD at 3 months post hospital
discharge for all participants ... 180 Table A4.44. Bivariate linear regression models for demographic and
stroke characteristic measures. ... 181 Table A4.45. Bivariate linear regression models for language, vision,
and comorbidity variables. ... 181 Table A4.46. Bivariate linear regression models for self-report and
physical performance measures. ... 182 Table A4.47. Bivariate linear regression models for disability measures. ... 183 Table A4.48. Spearman correlation coefficients for stroke characteristics
and physical performance measures. ... 183 Table A4.49. Spearman correlation coefficients for single and dual-task
LIST OF FIGURES
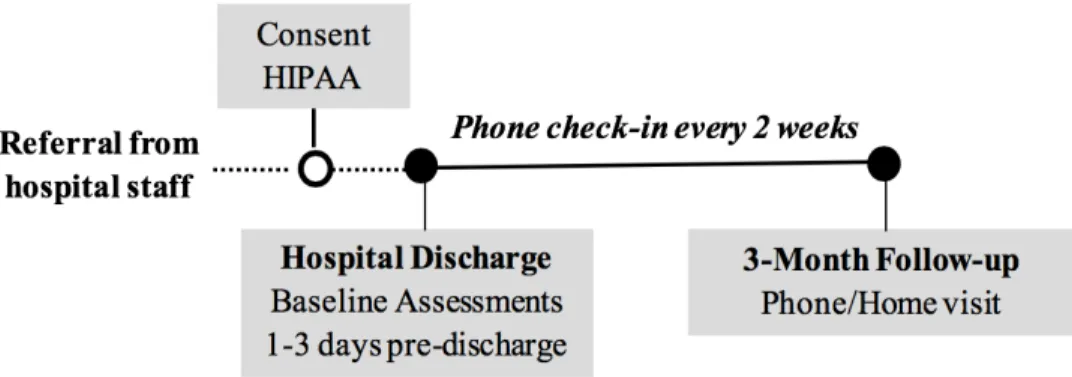
Figure 1.1. Study flow diagram ... 3
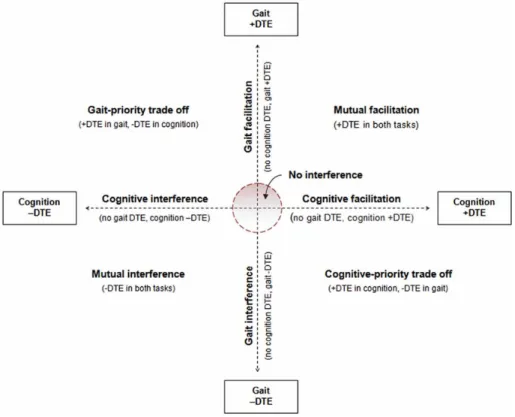
Figure 2.1. Illustration of conceptual model for characterizing pattern of cognitive motor interference... 27
Figure 3.1. Study Design Diagram ... 35
Figure 3.2. Obstacle-crossing task ... 46
Figure 3.3. SMI Natural GazeTM Eye Tracking Glasses and Smart Recorder eye image ... 48
Figure 3.4. Physical Activity Monitor (PAMSysÔ)and PAMWareÔ sofware ... 55
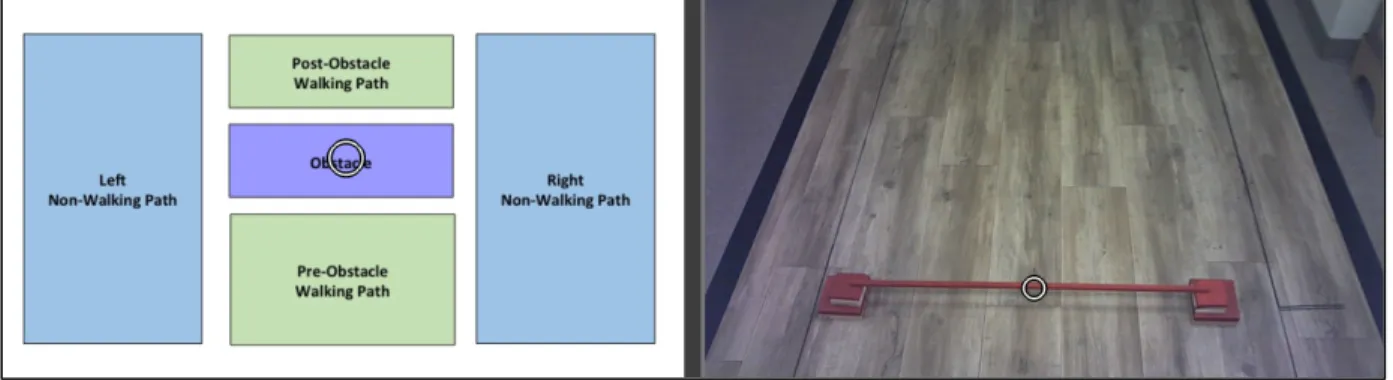
Figure 3.5. Obstacle-crossing walking path ... 58
Figure 3.6. Gaze mapping for obstacle trial in BeGazeTM gaze mapping software ... 61
Figure 4.1. Flow chart of participant recruitment and retention ... 75
Figure 4.2. Relative dual-task effects (DTE, %) for gait speed and cognition ... 104
Table 4.14. Distribution of patterns of cognitive-motor dual-task interference at hospital discharge among the participants ... 104
Figure 4.3. Characteristics associated with distinct inference patterns ... 105
Figure 4.4. Scatterplot of the average dual-task gait speed and total number of steps per day ... 114
LIST OF ABBREVIATIONS 2MWT 2-minute walk test
5mWT 5-meter walk test 5XSTS 5 times sit to stand test
AAFO articulating ankle foot orthosis
ABC Activities-specific Balance Confidence Scale AFO ankle foot orthosis
AM-PAC Activity Measure for Post-Acute Care AOI areas of interest
ASI asymmetry index
BBS Berg Balance Scale
C combined
CI confidence interval
cm centimeters
COV coefficient of variation DTE dual-task effect
DTEg dual-task effect on gait speed
DTEc dual-task effect on correct response rate EMR electronic medical record
ETG eye tracking glasses
FIM Functional Independence Measure
IPAQ International Physical Activity Questionnaire IQR interquartile range
kcal kilocalories
kg kilograms
LOS length of stay LR likelihood ratio
CIRS-G Cumulative Illness Rating Scale for Geriatrics
m meters
MCID minimal clinically important difference MET metabolic equivalent
min minutes
MoCA Montreal Cognitive Assessment mRS modified Rankin Scale
ms milliseconds
m/s meters per second
n number
NIHSS National Institutes of Health Stroke Scale
NP non-paretic
OR odds ratio
OT occupational therapy
P paretic
PKMAS ProtoKinetics Movement Analysis Software PT physical therapy
Rehab rehabilitation
RR relative risk
s seconds
SCT Star Cancellation Test SD standard deviation
SIPSO Subjective Index of Physical and Social Outcome SPD steps per day
ST speech therapy
CHAPTER 1: INTRODUCTION
Stroke is the leading cause of disability in the United States.1 The majority of stroke survivors who are discharged home from the hospital are extremely inactive2 and experiencing falls at a high rate,3 despite the fact that many have recovered the ability to walk independently prior to hospital discharge.4 Reduced walking activity and participation post-stroke is a serious public health concern associated with poor quality of life,social isolation, obesity, cardiovascular disease, and increased risk for a second stroke and mortality.5-7 Moreover, falls are a common adverse event after stroke,3 with a majority of first falls occurring within the first two months post hospital discharge.8 In addition to the risk of injury, a fall can result in reduced balance, walking self-efficacy, and walking activity.8,9 Therefore, identification of modifiable risk factors contributing to sedentary behavior and falls early post stroke is critical.
A critical gap remains in our understanding of modifiable factors measured at hospital discharge post stroke that are associated with ambulatory activity and fall risk in the sub-acute stroke population. Investigating the time period early post stroke is critical because patients remain in contact with the health care system and can thus benefit from support to promote ambulatory activity and participation while decreasing fall risk over the long term.
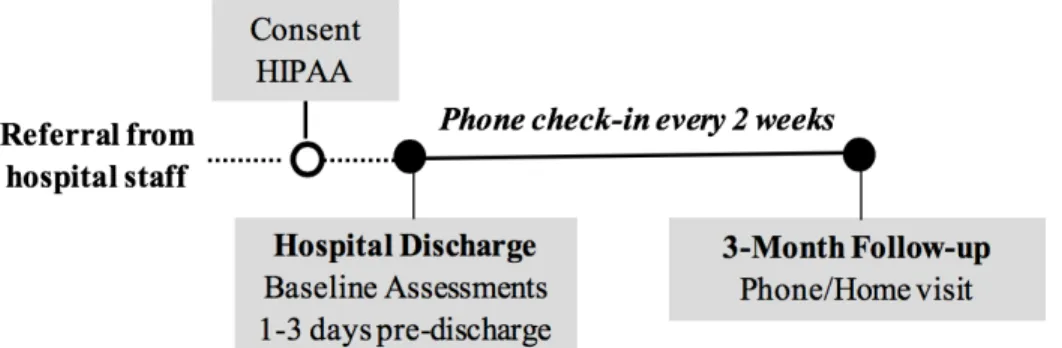
Our long-term research goal is to improve walking activity, participation, and safety in community dwelling stroke survivors. The purpose of this prospective observational study was to examine the ability of attention-demanding and community-relevant mobility tasks at hospital discharge to estimate fall risk and predict walking activity 3-months after hospital discharge post stroke (Figure 1.1). Our central hypothesis was that performance on attention-demanding and community-relevant mobility tasks would identify fallers and be strongly associated with ambulatory-activity post discharge because they more accurately reflect the demands of everyday community ambulation.
Figure 1.1. Study flow diagram.
Specific Aims, Hypotheses, and Rationales Specific Aim 1
To examine the likelihood that an obstacle-crossing task at hospital discharge will estimate fall status at 3-months post hospital discharge.
Research Questions:
Primary Research Question:
1.1. Does obstacle-crossing ability (success or failure) at hospital discharge estimate fall status (faller/non-faller) at 3 months post hospital discharge?
Secondary Research Questions:
1.2. Does the obstacle-crossing speed at hospital discharge relate to fall status (faller/non-faller) at 3 months post hospital discharge?
1.3. Does obstacle-crossing paretic swing duration at hospital discharge relate to fall status (faller/non-faller) at 3 months post hospital discharge?
1.5. Does visual fixation duration on obstacle prior to obstacle-crossing at hospital discharge relate to fall status (faller/non-faller) at 3 months post hospital discharge?
Hypotheses:
Primary Hypothesis:
1.1 Failure to cross an obstacle successfully at hospital discharge will estimate fall status (faller/non-faller) 3 months post hospital discharge. Specifically, we expected that people who fail the obstacle crossing task on at least one trial will be more likely to experience a fall within the 3-month follow up period than those who pass the obstacle task.
Secondary Hypotheses:
1.2 Slower obstacle-crossing gait speed at hospital discharge will estimate fall status at 3 months post hospital discharge because prior research has shown that individuals post stroke who fall are more likely to have a slower obstacle-crossing gait speed than those who are non-fallers.15,16
1.3 Longer obstacle-crossing paretic swing duration at hospital discharge will estimate fall status 3 months post hospital discharge because people who require increased time to clear the obstacle with the paretic limb (either lead or trailing) are likely to have greater motor impairments and dynamic balance limitations contributing to fall risk. Furthermore, paretic lead limb swing time over an obstacle is known to be significantly increased following stroke.16
variability while walking has been found to be associated with increased fall rates post stroke.17
1.5 Less time spent fixating on the obstacle prior to obstacle-crossing at hospital discharge will estimate fall status at 3 months post hospital discharge because less focus on relevant stimuli in the environment for the task at hand, the obstacle, likely contribute to decreased situational awareness and therefore, fall risk.
Rationale
The attentional and visual demands of gait are increased in the community by obstacles and variable terrain,18 which can be challenging for even well-recovered stroke survivors.19 Obstacle crossing requires the clearance of the obstacle by both the lead limb (which clears the obstacle first) and the trail limb. Failure to clear the obstacle may lead to a trip, loss of balance and, subsequently, a fall.20 Sensorimotor integration of visual and proprioceptive inputs is critical for producing appropriate walking modifications for safe and successful obstacle crossing.21 Impairment in the ability to focus awareness on the most relevant subset of stimuli in the environment (situational awareness) can prevent appropriate allocation of attentional resources, therefore reducing adaptability to challenging environments, and contributing to fall risk.22
while walking at comfortable speed was significantly associated with increased fall rates in the subsequent 6 months.
Traditional pen-and-paper clinical measures of visual awareness post stroke appear inadequate for accurately assessing one’s ability to effectively attend visually to the surrounding environment in the community after stroke.23 Furthermore, it is not known whether stroke survivors can use visual scanning effectively during obstacle-crossing. In a preliminary study, we examined gaze behavior during obstacle crossing in eight patients with chronic stroke. Results revealed that the patient with the highest risk of falling spent only 5% of the time fixating on the obstacle, whereas patients at lower risk of falling fixated on the obstacle up to 21% of the time, suggesting that they were looking ahead more often which may suggest greater planning and/or awareness of environmental factors that might influence successful completion of the task.
Table 1.1. Summary of Specific Aim 1
Specific Aim 1: To examine the likelihood that an obstacle-crossing task at hospital discharge will estimate fall status at 3-months post hospital discharge
Research Question Exposure Outcome Statistical Analysis
*1.1.Does
obstacle-crossing ability (success or failure) at hospital discharge post stroke estimate fall status at 3 months post hospital discharge?
Obstacle-crossing
status (Success/Failure) Fall Status (Faller/Non-Faller) - Group differences for all explanatory
variables - Binary logistic regression
- Multivariable logistic regression
1.2 Does the obstacle-crossing speed at hospital discharge estimate fall status (faller/non-faller) at 3 months post hospital discharge?
Difference in obstacle- crossing speed
Fall Status (Faller/Non-Faller)
- As above
1.3Does
obstacle-crossing paretic swing duration at hospital discharge post stroke estimate fall status at 3 months post hospital discharge?
Obstacle-crossing paretic swing duration
Fall Status (Faller/Non-Faller)
- As above
1.4 Does pre-obstacle step length variability at hospital discharge post stroke estimate fall status at 3 months post hospital discharge?
Pre-obstacle step length variability
Fall Status (Faller/Non-Faller)
- As above
1.5 Does visual fixation duration on obstacle prior to obstacle crossing at hospital discharge post stroke estimate fall status at 3 months post hospital discharge?
Visual fixation duration on obstacle prior to crossing
Total number of falls in 3 months post hospital discharge
- As above
Specific Aim 2
To examine the ability of walking performance during dual-task walking at hospital discharge post stroke to estimate daily walking activity at 3-months post hospital discharge.
Research Questions:
Primary Research Question:
2.1 Does dual-task gait speed at hospital discharge post stroke estimate daily total step counts at 3 months post hospital discharge?
Secondary Research Questions:
2.2 Does dual-task effect on gait speed at hospital discharge post stroke estimate daily total step count at 3 months post hospital discharge?
2.3 Does the combined dual-task effect on gait speed and cognition at hospital discharge post stroke estimate daily total step count at 3 months post hospital discharge?
Hypotheses:
Primary Hypothesis
2.1 Dual-task gait speed at hospital discharge post stroke will estimate daily total step count at 3 months post hospital discharge because of the relevance of dual-task walking speed to everyday community ambulation.
Secondary Hypotheses
2.3 The combined dual-task effect on gait speed and cognition at hospital discharge will estimate daily total step counts at 3 months post hospital discharge because of the ecological validity and importance of dual-task walking (gait speed and cognition) to safe and efficient everyday community ambulation.
Rationale
Table 1.2. Summary of Specific Aim 2
Specific Aim 2: To examine the ability of walking performance during dual-task walking at hospital discharge post stroke to estimate daily walking activity at 3-months post hospital discharge.
Research Question Explanatory Variable Dependent Variable Statistical Analysis *2.1 Does dual-task
gait speed at hospital discharge post stroke estimate daily total step counts at 3 months post hospital discharge?
Dual-task gait speed Total number of steps
taken per day - Group differences for all explanatory
variables
- Linear regression - Multivariable regression
2.2 Does dual-task effect on gait speed at hospital discharge post stroke estimate daily total step count at 3 months post hospital discharge?
Dual-task effect on gait speed
Total number of steps taken per day
- As above
2.3 Does the combined dual-task effect on gait speed and cognition at hospital discharge post stroke estimate daily total step count at 3 months post hospital discharge?
Combined dual-task effect on gait speed and cognition
Total number of steps taken per day
As above
*Primary Research Question
Exploratory Aim 3
Operational Definitions
For the purpose of this thesis, situational awareness was defined as the ability to identify, process, and comprehend the most relevant subset of stimuli in the environment within a specific time frame and space.30Dual-tasking was defined as the concurrent performance of two discrete tasks that can be performed and measured separately and have distinct goals (e.g., walking while talking to a companion).31,32 A fall was defined as an individual landing on the floor, ground, or on
a lower level due to an uncontrolled, unplanned, and non-purposeful descent that is not the result of a medical condition (e.g., orthostatic hypotension) or external force (e.g., assault, push, etc.).
Fallerstatus was defined as a person falling one or more times within a defined period of time.
CHAPTER 2: REVIEW OF LITERATURE Disability Post Stroke: Impact on Falls and Walking Activity
Stroke is the leading cause of disability in adults in the United States.1 Approximately 80% of the 5.5 million people living with stroke have some level of disability.34 Many stroke survivors face long-term consequences of stroke, which are usually complex and heterogeneous and may result in problems across multiple domains of functioning. Approximately two thirds of stroke survivors have residual neurological deficits that impair function and approximately 50% are left with disabilities making them dependent on others for activities of daily living.1 Sensorimotor, cardiovascular (e.g., deconditioning, fatigue), visual, and cognitive deficits significantly limit a stroke survivor’s mobility and physical activity and participation at home and in the community.18
financial burden on the individual, family, and healthcare system.40
Disability post stroke is a consequence of, and a risk factor for, physical inactivity.41 The amount an individual walks in their home and community is a critical indicator of their functional mobility and health status.42-44 Ambulation in the community requires negotiation of complex, dynamic environments, often while simultaneously performing cognitive tasks (dual-tasking) and obstacle-crossing or avoidance. Increases in the attentional demands of walking (e.g., crossing the street with time constraints imposed by traffic signal) in the community may further challenge community ambulation after stroke, especially under dual-task conditions in high-distraction environments.18,24 Chronic stroke survivors’ mean ambulatory activity profiles are extremely low (<3000 steps/day), cardiovascular deconditioning is profound, and the energy costs of hemiparetic gait are high, representing 76% of physiologic fitness reserve.45 A reduced capacity for dual-task walking and/or limited ability to adapt to changes in environmental context may substantially restrict the degree to which a person is able to participate in his/her life roles. Low physical activity post stroke is a serious public health concern because physical inactivity is associated with obesity, depression, cardiovascular disease, poor quality of life,social isolation, and increased risk for falls, a second stroke and mortality.5-7,46
to intervene and prevent the development of chronic sedentary behaviors, falls, and subsequent health sequelae.
This review focuses on three primary areas around the topic of falls and walking activity post stroke to support the study hypotheses and methodology: (1) rationale for the methodological design; (2) synthesizing and evaluating evidence that examines factors associated with falls post stroke including the ability to negotiate an obstacle while walking, stroke severity, lower extremity function, and balance; and (3) synthesizing and evaluating evidence that examines factors associated with walking activity/inactivity including dual-task performance, pre-stroke physical activity, and age.
Rationale for Methodological Design
A prospective study design can be used to make precise estimates of either the incidence of an outcome or the relative risk of an outcome based on exposure. A distinguishing feature of a prospective study is that at the time the investigators begin enrolling participants and collecting baseline exposure information, it is likely that a minimal number of the participants will have developed any of the outcomes of interest (e.g., fall or physical inactivity due to their stroke). For the proposed study, a prospective study will allow us to carry out our assessment using two attention demanding tasks at hospital discharge prior to collecting our outcome fall data from hospital discharge to the 3 months post hospital discharge follow-up time period.
the use of a prospective fall diary is the criterion standard.47 Using retrospective falls data can introduce threats to internal validity. Examining fall data retrospectively could lead to underestimation of the true rate of falls.
Factors Associated with Falls Post Stroke
Falls are a common adverse event at all stages after stroke.Individuals post stroke are not only more likely to fall but also fall more often than aged-matched individuals.3 Collective impairments in balance self-efficacy, mobility, postural control, cognition, sensation, and vision make previously automatic movements more difficult and attention demanding in persons post stroke.3,18,35,48 Fall risk post stroke is associated with a wide range of characteristics including older age; greater disability; more prevalent use of an assistive device; and reduced balance, motor function, and walking speed.35,37,49-51 Combined with limited ability to adapt to changes in environmental demands, collective impairments increase the risk of falling for persons post stroke.18,50
Obstacle Crossing
Completion of task and gait performance
A critical measure of performance in obstacle crossing is the successful completion of the task. Individuals post stroke who walk slowly typically have greater impairments of balance and lower-limb strength,56 which may reduce their ability to make the adaptive gait adjustments required to safely negotiate an obstacle while walking. For example, when comparing a population of older adults with minimal cognitive impairment (MCI) to a control group, older adults with MCI attenuate the anticipatory gait adjustments needed to avoid an obstacle when dual-tasking.57 Failure to clear the obstacle may lead to a trip, loss of balance and, subsequently, a fall.20 The following is a review of three studies examining obstacle-crossing around hospital discharge post stroke and fall risk over the subsequent 6 to 12 months.
The ability to step over various height and width obstacles (1–8 cm) for 24 individuals post stroke in inpatient rehabilitation (subacute) a median of 27 days post stroke (IQR 21.0, 44.5 days) was compared to 22 healthy controls.58 Fifty-four percent of the individuals post stroke failed 1 or more trials of obstacle-crossing task. There were significantly more fails in the participants with stroke than in the healthy participants (z=-3.976, P=.0001). More than half of the fails occurred on the largest obstacle (8 cm). Limitations in this study included a small sample size and the applicability of the findings to current practice based on the publication year (1999). The timeframe of the assessment of obstacle-crossing is a greater number of days post stroke (27 days post stroke) than we experienced due to the current hospital length of stay in acute care and acute inpatient rehabilitation.
who were non-fallers.15 Specifically, the incidence of fallers (incidence rate of 0.833) 6-months after the obstacle-crossing assessment was significantly higher (P=.007) in the group that failed to step over a 4-cm-high obstacle on even 1 of 8 attempts (incidence rate of 5.83) compared to the group that passed the task (incidence rate of 0.143).15 Furthermore, obstacle-crossing gait speed was significantly greater in people who passed the obstacle-crossing task compared with those who failed (U= 29.5, P=.001). Obstacle-crossing gait speed was calculated by averaging the speed for the lead and trail crossing strides. The median obstacle-crossing gait speed for the fail group was 0.42 m/s (IQR 0.14, 0.68) and the pass group was 0.92 m/s (IQR 0.72, 1.03 m/s). In addition, fallers were significantly older than non-fallers (U=19.5, P=.039). This study was limited by a small sample size (n = 32) and limited falls data (n = 20) over the 6-month follow-up period. In addition, there was no adjustment made in the obstacle height based on the height of the participants. The authors recommended a larger prospective study using a larger sample size to explore the interaction between stroke, age, and obstacle-crossing performance and falls.15
Situational awareness during obstacle crossing
Visual information comprises one of the most important sources of information used for dynamic postural control and walking.59,60 The attentional and visual demands of gait are increased in the community by unpredictable and moving obstacles and variable terrain,18 which can be challenging for even well-recovered stroke survivors.19 Impairment in the ability to focus awareness on the most relevant subset of stimuli in the environment (situational awareness) can prevent appropriate allocation of attentional resources, therefore reducing adaptability to challenging environments, and contributing to fall risk.22 Although it is well established that adults with stroke have a diminished ability to walk and simultaneously perform cognitive tasks,61,62 it is not known whether they can flexibly prioritize their visual attention during obstructed walking (e.g. obstacle-crossing). Traditional clinical measures of visual awareness post stroke are completed in the clinic using paper and pencil tasks which we believe are inadequate for accurately assessing one’s ability to function in the community after stroke.
Vision is primarily used in a feedforward manner to identify an obstacle’s attributes (e.g., height, width), as well as its location relative to body position.60 When approaching an obstacle, vision is used to intermittently scan the obstacle and the surrounding area, and during the step over the obstacle, vision is used to sample the upcoming landing area rather than the obstacle itself.60 A key aspect of this planning process is the need to integrate information concerning the obstacle, obtained from vision, together with an estimation of body and limb state.21
participant was a few steps from the obstacle allowing for planning for limb elevation control to successfully negotiate the obstacle. Participants did not fixate on the obstacle as they were stepping over the obstacle with all of the planning completed during their steps prior to reaching the obstacle. While crossing the obstacle, the participants fixated on the post-obstacle walking path (i.e., “landing path”).
There is no evidence to our knowledge examining visual scanning behavior during ambulatory tasks and specifically obstacle-crossing in individuals post stroke and specifically in the acute or subacute phase of recovery. This project addressed this problem by examining whether measures of visual scanning behavior during attention-demanding tasks at hospital discharge post stroke can distinguish those who fall from those who do not fall in the next 3 months.
In summary, obstacle crossing may be a useful tool in predicting who is at risk of falls following stroke, particularly in people who are able to walk. Risk factors for falling may be different for people who are more mobile following stroke compared with a more dependent group. The simplicity of classifying obstacle crossing as pass or fail means the task could be easily assessed in a clinical setting.
Additional Factors Associated with Falls
Measure (adjusted OR 9.85, 95% CI 1.22, 79.75) even after adjusting for age, stroke severity, gait abnormalities, and past stroke. The authors concluded that stroke severity defined as an NIHSS score ³8 may be clinically useful to identify patients with stroke at risk for falls. Limitations for this study include that fact that data were collected retrospectively and included only falls documented in the medical record which likely resulted in an underestimation of the true fall rate. In addition, the statistical analysis used does not indicate a causal relationship between stroke severity and fall risk.
For community-dwelling stroke survivors, multiple factors have been identified that differentiate fallers from non-fallers including living with a spouse, poor health, time since first stroke, urinary incontinence, pain, motor impairment, history of falls, depression, disability, sensory impairment, and visual impairment.51,54,64 However the literature regarding the association between risk factors and falls is inconsistent in community-dwelling chronic stroke survivors with two studies finding no difference between fallers and non-fallers on measures of balance and gait.65,66
Mackintosh et al35 examined predictors of recurrent falls in adults, a mean age of 68.1 (SD 12.8), who returned to community living after stroke rehabilitation. The participants were
evaluated for potential fall risk factors within 14 days of their discharge from rehabilitation and
then subsequently recorded falls over the next 6 months using a prospective fall diary. Using a
with sensitivity and specificity values greater than 80%. Limitations for this study included a relatively small sample size (n = 55), high refusal rate (21%) and that by the time their assessments
were done in the home, a large percentage of the participants had already experienced a fall. With
92% of their participants experiencing reported falls in the hospital and multiple falls, it is likely
that other factors, such as fear of falling or depression, were likely consequences of a fall history rather than factors leading to future falls.
Mansfield et al17 found that, for individuals discharged from acute inpatient rehabilitation (n = 63) with a mean age of 62.5 years (SD 13.1), greater step length variability while walking at their comfortable speed at hospital discharge was significantly associated with increased fall rates in the subsequent 6 months (rate ratio 1.4; 95% CI 1.2, 1.7; P=0.001). This study was limited by recruitment of only high-functioning individuals post stroke restricting the generalizability of the data. In addition, the researchers did not use an objective measure of daily physical activity (e.g., activity monitors) but instead used a self-report measure to obtain an estimate of daily physical activity (Physical Activity Scale for Individuals with Physical Disabilities).
Hyndman et al68 examined attention deficits among people with stroke living in the community (n = 48) who were a mean age of 68.4 (SD 11.2) years and median of 46 months (IQR 5, 204) post stroke. The authors reported that sustained and divided attention scores from the Test of Everyday attention69 moderately correlated with balance, ADL ability, and fall status (P < 0.01). As in the study described above the limitations of study include a small sample size and the retrospective nature of the study design.
In summary, the literature supports the use of obstacle-crossing as an assessment, including obstacle-crossing ability, obstacle-crossing gait speed, pre-obstacle step length variability, paretic obstacle-crossing swing time, and visual fixation duration on the obstacle prior to obstacle crossing as possible explanatory variables, for fall risk in the subacute phase of recovery post stroke. In addition, stroke severity as assessed by NIHSS and lower extremity function and balance as assessed by the Step Test are additional explanatory variables to consider.
Factors Associated with Walking Activity Post Stroke Gait speed as an indicator of physical activity post stroke
Advances in technology have allowed for the investigation of walking activity in the home
and community for healthy and non-healthy populations. Microprocessor-linked accelerometer
monitoring (e.g., StepWatch™ Activity Monitor, ActiGraph, PAMSys, etc.), but not use of
conventional accelerometers (e.g., pedometers), has been reported as an accurate and highly
reliable way of quantifying ambulatory activity levels using steps per day (SPD) in healthy and
In a recent review by Fini et al71 including 103 studies and 5306 participants aged 21 to 96 years old, physical activity monitors showed that people with stroke took an average of 5535 SPD (n = 406, 10 studies) in the subacute phase and 4078 SPD (n = 1280, 32 studies) in the chronic phase.
Matched healthy individuals took an average of 8338 SPD (n = 129). Based on these findings, time
spent inactive and sedentary is high at all times post stroke, supporting the need for developing
assessment tools to identify modifiable factors and interventions focused on addressing modifiable
factors related to sedentary behavior.
Gait speed has been emphasized as an important indicator of functional ambulatory status following stroke. Gait speed has been recognized as the sixth vital sign72 and there are well recognized functional walking categories defined by gait speed.25 Specifically, the ability to walk at least 0.8 m/s is required for unlimited community ambulation.25 Individuals who walk 0.4-0.8 m/s are limited in their community ambulation, while people whose gait speed is slower than 0.4 m/s are primarily household ambulators, rarely walking outside the home.25 The wide acceptance of these categories is illustrated by their frequent use in stroke rehabilitation studies to define clinically important outcomes.73-76 These functional walking categories in people with stroke have been validated demonstrating that transitions between the functional categories are associated with clinically meaningful improvement,77 and that gait speed classification is associated with daily step count.74 Bowden et al.74 found that ambulatory activity was significantly different between the three functional gait speed categories, such that the full-community ambulators had significantly higher daily step counts than limited-community and household ambulators, and limited-community ambulators had significantly higher daily step counts than household ambulators.
activity levels (SPD) (Table 2.1).78 In addition, as part of this retrospective cohort study that combined data from two randomized controlled trials, the study utilized data from two large multicenter randomized controlled trials (n = 441) to discriminate between the walking categories based on self-selected gait speed.78 Functional walking categories will be used in this study to help characterize the functional walking capability of our sample.
Table 2.1. Functional walking categories, daily steps per day (SPD), and gait speed
Category SPD Gait Speed (m/s)
Household Ambulator 100 to 2499 < 0.49
Most Limited Community Ambulator 2500 to 4999
0.49 – 0.93m/s
Least Limited Community Ambulator 5000 to 7499
Unlimited Community Ambulator ≥7500 > 0.93 m/s
Based on data presented in Fulk et al78
attentional demands of gait on daily ambulatory activity after stroke. The environment in which we live our daily lives is highly complex. This may explain why habitual gait speed, measured in a predictable and stable clinic setting, has not been found to be a sufficiently strong predictor of ambulatory activity after stroke.74
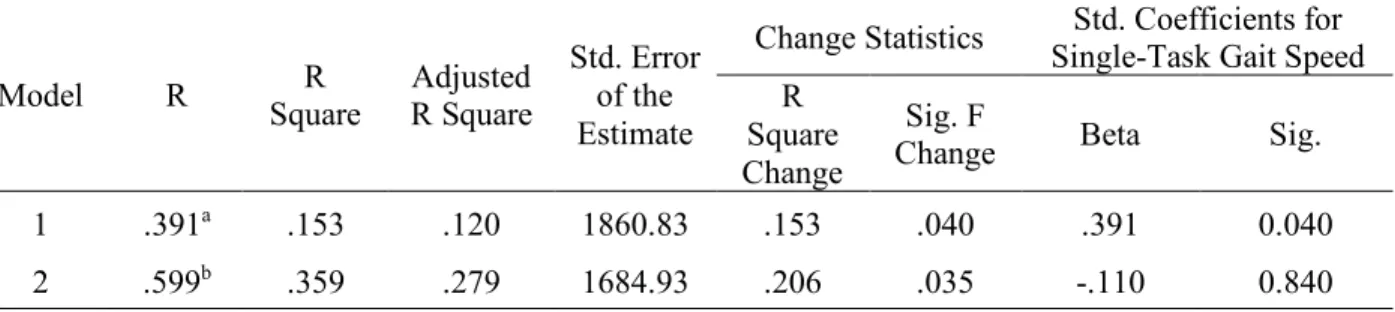
In our previous work,83 we found that for 28 participants, a mean age of 58.2 (SD 16.6) years and median of 8.9 months (IQR 3.7, 19.4) post stroke (chronic), single-task gait speed explained 15.3% of the variance in the number of SPD (P=0.04). Adding dual-task gait speed increased the R-squared value by 20.6% (P=0.04). Together, single and dual-task gait speed explained 35.9% (adjusted R2=27.9%) of the variance in daily ambulatory activity (Table 2.2).
Table 2.2. Regression model summary
Model R Square R R Square Adjusted
Std. Error of the Estimate
Change Statistics Std. Coefficients for
Single-Task Gait Speed R
Square Change
Sig. F
Change Beta Sig.
1 .391a .153 .120 1860.83 .153 .040 .391 0.040
2 .599b .359 .279 1684.93 .206 .035 -.110 0.840
a. Predictors: (Constant), Single-Task Gait Speed (m/s)
b. Predictors: (Constant), Single-Task Gait Speed (m/s), Dual-Task Gait Speed (m/s), (Dual-Task Gait Speed)²
Dual-task Paradigm
a decrement in performance in one or both of the tasks, relative to when each task is performed
alone. This is especially true when the attentional demands of one of the tasks is high. Individuals post stroke are susceptible to dual-task interference, likely due to a decrease in attentional
resources resulting in a need for reallocation of attentional resources (e.g., allocation of attention
to walking to control motor performance).32The ability to change the attention allocation strategy
during different dual-task situations is critical for safety during home and community mobility.
A complete assessment of dual-task performance requires the assessment of single and
dual-task performance for both tasks. Absolute measures of dual-task performance should be
assessed (e.g., actual gait speed in single-task and dual-task conditions) in addition to relative
Figure 2.1. Illustration of conceptual model for characterizing pattern of cognitive motor interference (Copyright © 2014 Prudence Plummer et al.88)
performance improves while cognitive performance deteriorates); (8) mutual interference (performance of both tasks deteriorates); or (9) mutual facilitation (performance of both tasks improves).32 Plummer et al32 report that the most common pattern of cognitive-motor interference post stroke appears to be cognitive-related motor interference, with some cognitive-motor tasks producing mutual interference (e.g., walking while performing spontaneous speech).32 In most cases, cognitive-motor interference effects on gait speed occurred without significant changes in cognitive performance.
Pre-stroke Physical Activity Level and Age
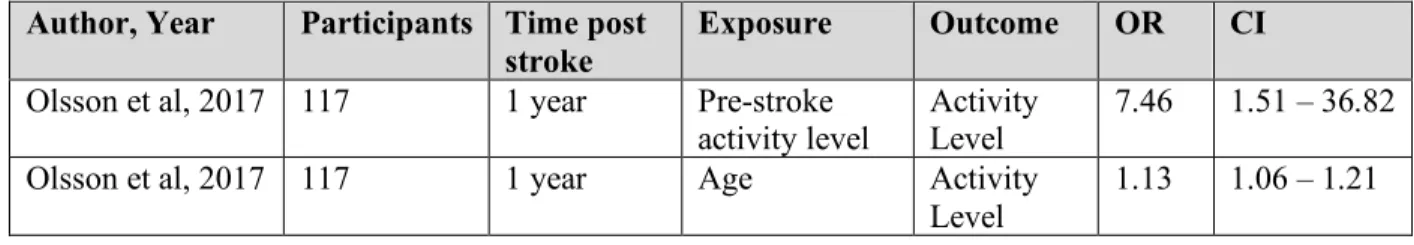
High levels of pre-stroke physical activity post stroke, > 1000 MET min/week, has been shown to be associated with good functional outcome (modified Rankin scale ≤ 2) after adjusting for age, sex, and stroke risk factors, severity, and treatment at 3 months post stroke.89 Significant associations have been demonstrated between premorbid walking habits and functional status after first-ever stroke.90 Participants who walked for more than 30 minutes for each walking bout achieved significantly better functional outcomes.90 Being active 1 year after stroke (n = 117) was predicted by pre-stroke physical activity (OR 7.46, 95% CI 1.51, 36.82).91 Low level of physical activity at 1 year after stroke (n = 117) was predicted by age at stroke onset (OR 1.13, 95% CI 1.06, 1.21).91
Additional factors associated with physical activity and walking activity post stroke
gait speed and functional mobility)93,94, and personal factors (e.g., depressive symptoms, female sex, older age, and self-efficacy)94 have been used in regression models to examine their ability to explain the variance observed in physical activity and participation in the community in chronic stroke survivors. Unfortunately, the results of these studies have not provided a clear or consistent picture of how these factors, alone or in combination, explain variance in physical activity including varying percentages (e.g., 12% to 45%).94,95 In addition, the literature does not provide a clear understanding of the primary contributing factors with conflicting findings including balance,45 walking endurance,78 self-efficacy,10,79,80,82,96 level of social support,93 ability to negotiate stairs,97 and low neighborhood income.98 Regardless of the mobility factors examined, the variability in walking activity accounted for by these factors is relatively small,45,78 suggesting that there are other factors and likely a multidimensional explanation for post stroke physical activity.
predictive of SPD in stroke survivors living in the community. The authors did not report the statistical analyses used to make this conclusion. In addition, there was no analysis of differences between sub-acute and chronic stroke survivors living in the community.
A limited number of studies have examined discriminators of ambulatory activity in the first 3 months post stroke. In a group of patients discharged from an acute care hospital directly home, participation in daily activities post hospital discharge at 3 months was best explained (46% of variance) by energy cost of transport, memory, and depressive symptoms.13 Improvement in participation in daily activities occurred primarily in the first 3 months after hospital discharge.13 Furthermore, estimates of the incidence of post stroke depression range from 5%100 to 63%101 of those living with stroke and has been shown to be correlated with reduced participation in community walking.92 Another study found fast gait speed and self-perceived balance measured at hospital discharge as valid predictors and discriminators of independent community walking at 6 months post-stroke.14
long walking bouts. A combination of pre-stroke activity, walking endurance, and attention predicted up to 79% of high intensity walking. Limitations of this study include a small sample size completing the 1-month (n = 42), 3-month (n = 31) and 6-month (n = 29) assessments, no assessment of attention demanding tasks at hospital discharge that are often required for community mobility (e.g., obstacle-crossing and dual-tasking), and use of 4 variables in their regression model with limited number of participants recommended for the analysis described at 3 and 6 months.
Comorbidity, the existence of one or more diseases or conditions in addition to stroke, is an important factor in stroke outcomes.103,104 Patients with stroke frequently have additional chronic diseases (e.g., metabolic, cardiovascular, or musculoskeletal) and/or conditions (e.g., hypertension, pain, or prior stroke), making comorbidity common in stroke.103,105 Evidence suggests that a stroke occurs in isolation with no comorbid conditions in less than 6% of patients. 106,107 Comorbidity post stroke has a negative impact on functional outcome.108 After adjusting for initial stroke severity in a post-stroke rehabilitation study, every 1-point increase on a comorbidity index was independently associated with a 15% increase in the odds of a poor outcome at discharge (P<0.005).109 The number of comorbidities post stroke has been shown to be related to the walking difficulty and activities of daily living in individuals poststroke.96 Danks et al10 found that in individuals greater than 3 months post stroke, comorbidities predicted walking activity. Comorbidity burden makes treatment and recovery for stroke increasingly complex as poorer outcomes for stroke patients are associated with comorbidity.103
CHAPTER 3: EXPERIMENTAL DESIGN AND METHODS Participants
The participants in this study were 56 men and women who had a stroke (ischemic or hemorrhagic) and were discharged from the hospital (acute care or inpatient rehabilitation center) to home. Home was operationally defined as the participant’s own home or that of another person, or residence in an independent living community. The participants were recruited from the University of North Carolina Hospital, Duke University Medical Center, and Duke Regional Hospital and Rehabilitation Institute. Participants were recruited without restriction in regard to sex, race, or socioeconomic status, other than the fact that only adults ages 35-85 years were recruited. Recruitment was limited to this age range because it is most representative of the adult stroke population. In addition, adults younger than 35 could have had other unique lifestyle factors that could influence how physically active they are (e.g., school, sporting events, etc.).
Eligible individuals had to satisfy the following criteria at hospital discharge: (1) diagnosis of stroke that was consistent with World Health Organization (WHO) definition with symptoms for ≥ 24 hours and preferred radiologic confirmation,110 (2) no cerebellar strokes due to added
affecting gait, (9) no history of falls (< 2 in 12 months prior to stroke) and (10) able to communicate verbally in English. Selection criteria are summarized in Table 3.1.
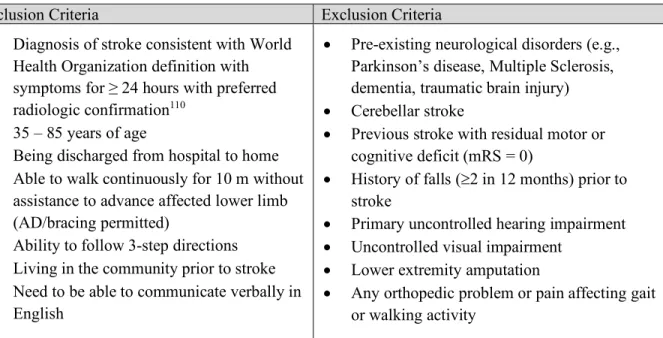
Table 3.1. Selection criteria for study participants
Inclusion Criteria Exclusion Criteria
• Diagnosis of stroke consistent with World
Health Organization definition with symptoms for ≥ 24 hours with preferred
radiologic confirmation110
• 35 – 85 years of age
• Being discharged from hospital to home
• Able to walk continuously for 10 m without
assistance to advance affected lower limb (AD/bracing permitted)
• Ability to follow 3-step directions
• Living in the community prior to stroke
• Need to be able to communicate verbally in
English
• Pre-existing neurological disorders (e.g.,
Parkinson’s disease, Multiple Sclerosis, dementia, traumatic brain injury)
• Cerebellar stroke
• Previous stroke with residual motor or
cognitive deficit (mRS = 0)
• History of falls (³2 in 12 months) prior to
stroke
• Primary uncontrolled hearing impairment
• Uncontrolled visual impairment
• Lower extremity amputation
• Any orthopedic problem or pain affecting gait
or walking activity
Research design