ASSOCIATIONS BETWEEN INORGANIC ARSENIC EXPOSURE AND THE DEVELOPMENT OF TYPE 2 DIABETES: DIETARY AND GENETIC SUSCEPTIBILITY
Xiaofan Xu
A dissertation submitted to the faculty at the University of North Carolina at Chapel Hill in partial fulfillment of the requirements for the degree of Doctor of Philosophy in the Department
of Nutrition in the Gillings School of Global Public Health.
Chapel Hill 2018
Approved by:
Penny Gordon-Larsen
Susan Sumner
Katie Meyer
Kari North
ii © 2018 Xiaofan Xu
iii ABSTRACT
Xiaofan Xu: Associations between Inorganic Arsenic Exposure and the Development of Type 2 Diabetes: Dietary and Genetic Susceptibility
(Under the direction of Penny Gordon-Larsen)
Compelling evidence has linked high exposure to inorganic arsenic (iAs) with increased risk of Type 2 diabetes (T2D). There is growing concern that low-to-moderate level of iAs exposure may contribute substantially to the epidemic of T2D. Nevertheless, the results of the current perspective studies are inconsistent, which could be attributable to varied susceptibility due for example to differences in intake of beneficial nutrients and existence of genetic variants of enzymes involved in iAs metabolism.
We capitalized on China Health and Nutrition Survey with measured baseline (i.e. 2009) iAs exposure using toenail; Mg and Zn intake at baseline; fasting glucose and insulin at follow-up (i.e. 2015). Using multivariable adjusted regression models, we investigated the associations between baseline toenail arsenic and T2D incidence and indicators of glucose homeostasis at follow-up. We also examined potential effect modification by Mg and Zn intake at baseline on iAs-associated diabetes. In addition, we determined the gene-environment interaction using data from Mexico.
iv
stronger among participants with adequate Zn intake, the joint association between iAs exposure and dietary intake of Mg and Zn supports the beneficial effects of adequate Mg and Zn intake. In addition, our findings confirm that several genetic variants of arsenic methyl transferase
(AS3MT) are in part responsible for the inter-individal differences in iAs metabolism, and roles of the variants may differ among populations with different levels of iAs exposure.
v
To my parents and grandparents,
vi
TABLE OF CONTENTS
LIST OF TABLES ... ix
LIST OF FIGURES ... xi
LIST OF ABBREVIATIONS ... xii
CHAPTER 1. INTRODUCTION ... 1
Background ... 1
Research Aims ... 3
CHAPTER 2. LITERATURE REVIEW ... 6
Inorganic arsenic is widely distributed in our environment and thought to contribute to the global epidemic of Type 2 diabetes ... 6
Toenail arsenic better captures chronic exposure to iAs than spot urine especially in low-to-moderately exposed populations ... 8
China provides a special opportunity to conduct this study ... 9
The role of AS3MT gene in iAs metabolism ... 9
Summary ... 11
CHAPTER 3. EXPOSURE TO INORGANIC ARSENIC AND DEVELOPMENT OF TYPE 2 DIABETES: A LONGITUDINAL STUDY IN A POPULATION OF LOW TO MODERATE INORGANIC ARSENIC EXPOSURE ... 12
Overview ... 12
Introduction: ... 13
Method ... 15
vii
Discussion ... 25
Tables and figures ... 32
CHAPTER 4. THE ASSOCIATIONS BETWEEN INTAKE OF MAGNESIUM AND ZINC—ALONE AND IN COMBINATION WITH INORGANIC ARSENIC EXPOSURE—AND DEVELOPMENT OF TYPE 2 DIABETES: A LONGITUDINAL STUDY IN A POPULATION LOW TO MODERATELY EXPOSED TO INORGANIC ARSENIC ... 44
Overview ... 44
Introduction ... 45
Method ... 47
Results ... 54
Discussion ... 59
Tables and figures ... 67
CHAPTER 5. ASSOCIATION BETWEEN VARIANTS IN ARSENIC (+3 OXIDATION STATE) METHYLTRANSFERASE (AS3MT) AND URINARY METABOLITES OF INORGANIC ARSENIC: ROLE OF EXPOSURE LEVEL ... 78
Overview ... 78
Introduction ... 79
Method ... 81
Results ... 85
Discussion ... 90
Tables and figures ... 94
ENDNOTES ... 105
CHAPTER 6. SYNTHESIS ... 106
Overview of findings ... 106
viii
Strengths ... 113
Significance and public health impact ... 114
Future directions ... 115
ix
LIST OF TABLES
Table 3.1. Characteristics of the Study Participants by Concentration of
Toenail Arsenic at Baseline (i.e. 2009).………...…..………..……...……32 Table 3.2. Associations between Baseline (i.e.2009) Toenail Arsenic and
Measures of DiabetesDevelopment during Follow-up (i.e.2015), Characterized by Follow-up Fasting Glucose, Fasting Insulin,
Glycated Hemoglobin, Pancreatic β-cell Function, Insulin Resistance,
and Odds of Incident Prediabetes and Diabetes….…..…..……...………..…….…35 Supplemental Table 3.1. Characteristics of Study Participants by Regions...……..…...……..37 Supplemental Table 3.2. Cross-sectional Associations between Baseline
(i.e.2009) Toenail Arsenic and Measures of Glucose Homeostasis
as well as Odds of Prediabetes and Diabetes at Baseline...……...….……..……….…….40 Supplemental Table 3.3. Baseline (i.e. 2009) Characteristics among
Participants Included in The Complete Case Analysis vs. Excluded
Due to Missing Data..……..……...…….………...……..41 Supplemental Table 3.4. Associations between Baseline (i.e. 2009) Toenail
Arsenic and Measures of Glucose Homeostasis as well as Odds of Prediabetes and Diabetes at Follow-up (i.e. 2015) Based on Multiple
Imputation …………...………...………..……...42 Supplemental Table 3.5. Sensitivity Analysis of Associations between
Baseline (i.e.2009) Toenail Arsenic and Measures of Diabetes
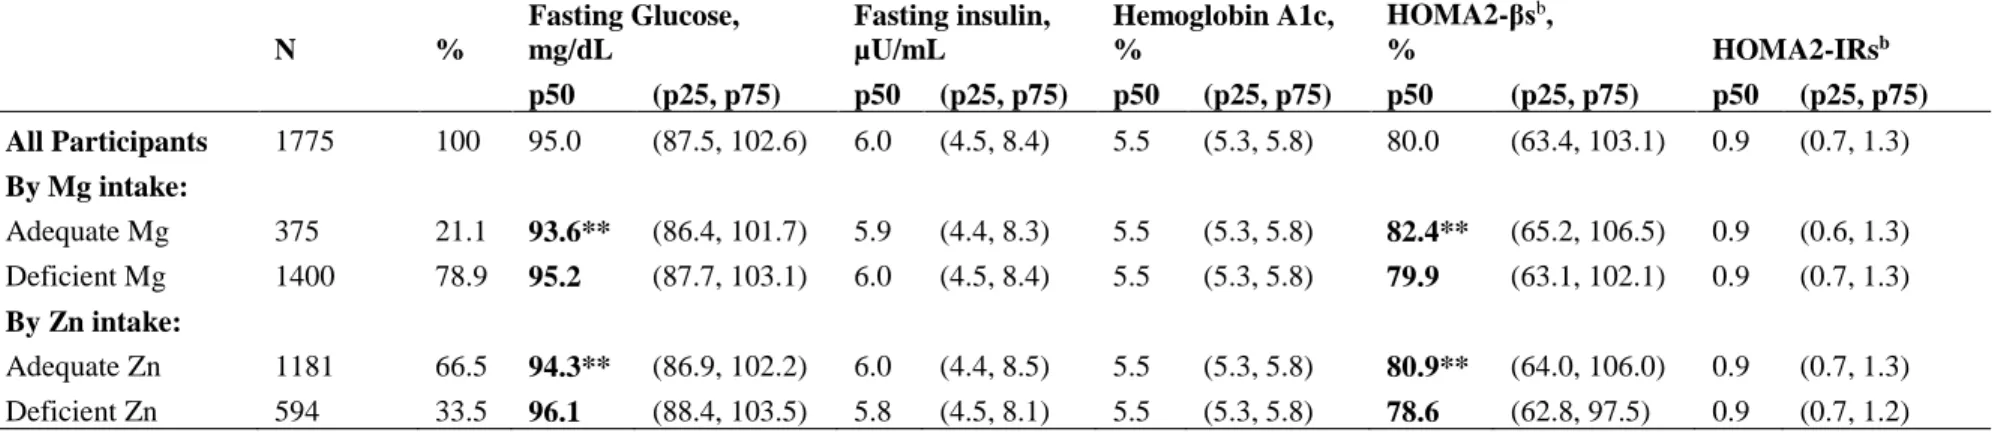
Development during Follow-up (i.e.2015)………..….43 Table 4.1. Characteristics of Study Participants by Regions...…………...…………...……...….67 Table 4.2. Indicators of Glucose Homeostasis, Characterized by Fasting
Glucose, Fasting Insulin, Glycated Hemoglobin, Pancreatic β-cell Function, and Insulin Resistance at Follow-up (i.e.2015), by Intake of Magnesium (Mg) and Zinc (Zn) at Baseline (i.e.2009) (Median,
25th, and 75th Percentiles)..….….……...……..…...……...……....…..………...….70 Table 4.3. Associations between Deficiency of Magnesium and Zinc Intake
at Baseline (i.e.2009) and T2D Incidence and Indicators of Glucose
Homeostasis at Follow-up (i.e.2015)..………...………...71 Table 4.4. Estimated Joint Associations of Inorganic Arsenic (iAs) Exposure
at Baseline (i.e.2009) and Dietary Intake of Magnesium (Mg) and Zinc (Zn)
x
Supplemental Table 4.1. Characteristics of Study Participants by Concentrations
of Toenail Arsenic, China Health and Nutrition Survey.………..………...……..73 Supplemental Table 4.2. Recommended Daily Allowances (RDA) for
Magnesium (Mg) and Zinc (Zn)..…...……...………..…………...…75 Supplemental Table 4.3. Comparison of Baseline (i.e. 2009) Magnesium (Mg)
and Zinc (Zn) Intake among Participants with vs. without Prediabetes
and Diabetes at Follow-up (i.e. 2015)...76 Supplemental Table 4.4. Interactions between ln-transformed Toenail Arsenic
at Baseline (i.e. 2009) and Deficiency of Magnesium (Mg) and Zinc (Zn) Intake at Baseline for Measures of Diabetes Development at Follow-up (i.e. 2015) Based on Multivariable-adjusted Linear Regression or
Multinomial Logistic Regression Models………...…....….77 Table 5.1. Urinary As profiles of arsenic metabolites overall and by AS3MT
variants (median and 25th, 75th percentiles).……….…...……….….94 Table 5.2. Adjusted associations between AS3MT variants and urinary
profiles of arsenic metabolites..….….……..……...……....……...……..…..………...….96 Supplemental Table 5.1a. Population characteristics and genotype frequencies
among subjects with complete data available for all AS3MT variants
and covariates..……….97 Supplemental Table 5.1b. Urinary profiles of As metabolites overall and by
AS3MT variants among subjects with complete data available for all
AS3MT variants and covariates: median and 25th, 75th percentiles………..….……..…..98 Supplemental Table 5.1c. Adjusted associations between AS3MT variants and
urinary profiles of As metabolites among subjects with complete data
available for all AS3MT variants and covariates..………...…...….…………..…..99 Supplemental Table 5.2a. Urinary profiles of As metabolites overall and by AS3MT
variants: median and 25th, 75th percentiles excluding subjects miss
information for diabetes..…… ………...……....100 Supplemental Table 5.2b. Adjusted associations between AS3MT variants and
urinary profiles of As metabolites..…..………..………...…..…….101 Supplemental Table 5.3. Global test statistics for interactions between variants with
categorical water iAs concentration..…………..………..………...…..102 Supplemental Table 5.4. Associations between AS3MT variants and urinary profiles
of As metabolites among subjects with higher (>50ppb) vs. lower (≤50ppb)
xi
LIST OF FIGURES
Figure 3.1a. Potential Confounders Based on Literature Showed in Directed
Acyclic Graphs………...34 Figure 3.1b. Confounders Identified by Stepwise Backward Selection Showed
in DAG….………34 Figure 3.2. Adjusted Mean Differences in Indicators of Glucose Homeostasis
at Follow-up as well as Odds Ratio of Incident Type 2 Diabetes Associated with Toenail Arsenic at Baseline Stratified by Sex, Age, Weight Status,
Smoking and Drinking Status, and Region………..……36 Supplemental Figure 3.1. Adjusted Mean Differences in Indicators of Glucose
Homeostasis at Follow-up as well as Odds Ratio of Incident Type 2 Diabetes Associated with Toenail Arsenic at Baseline Stratified by Sex, Age, Weight
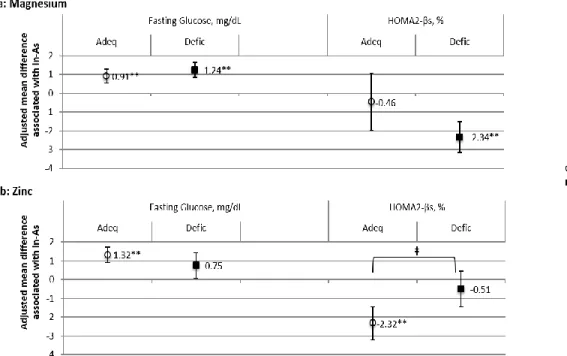
Status, Smoking and Drinking Status, and Region………...39 Figure 4.1. Adjusted Mean (SE) Difference in Follow-up Indicators of Glucose
Homeostasis Associated with Baseline iAs Exposure Stratified by Levels of Magnesium (Mg) and Zinc (Zn) Intake among Non-diabetic Individuals
at Baseline………..…..…69 Supplemental Figure 5.1. Associations between AS3MT variants and urinary
xii
LIST OF ABBREVIATIONS
AS3MT Arsenic (+3 Oxidation State) Methyltransferase
BMI Body Mass Index
CHNS China Health and Nutrition Survey
DMAs Dimethylated Arsenic
FG Fasting glucose
FI Fasting insulin
HbA1c Hemoglobin A1c
HOMA Homeostasis model assessment
iAs Inorganic Arsenic
MAs Monomethylated Arsenic
Mg Magnesium
RDA Recommended Daily Allowance
SNP Single nucleotide polymorphism
T2D Type 2 Diabetes
UL Tolerable upper intake level
1
CHAPTER 1. INTRODUCTION
Background
The prevalence of type 2 diabetes (T2D), which is a well-recognized cause of premature death and disability, has increased globally over the past two decades, especially in China1-5. It has become abundantly clear that both pancreatic β-cell dysfunction and insulin resistance are involved in the development of T2D, but the interplay between pancreatic β-cell dysfunction and insulin resistance remains highly complex and somewhat undefined6,7. Though obesity is a
well-known risk factor for T2D and is associated with insulin resistance, it has been suggested that obesity alone cannot fully explain the escalating epidemic of T2D, especially in regions where the prevalence of obesity is low3,8-12. Recent studies stress on the importance of pancreatic β-cell dysfunction in the development of diabetes as participants with insulin resistance are still be able to maintain normal glucose tolerance as pancreatic β-cells with normal function are able to compensate for insulin resistance7,13,14. Thus, there is urgent need to identify and understand other T2D risk factors beyond obesity and insulin resistance, especially factors involved in pancreatic β-cell dysfunction15.
Inorganic arsenic (iAs) is widely distributed in the environment, such as drinking water, contaminated food, rice, air, dust, and soil16. Growing literature has linked exposure to high
low-to-2
moderately exposed populations, and most studies have been cross-sectional19,22-24. This is of concern as T2D has been shown to affect the metabolism of iAs, posing the risk that altered iAs biomarkers in diabetic individuals may be a consequence—vs. a cause—of T2D in
cross-sectional studies17. Thus, longitudinal studies are urgently needed in the low-to-moderately iAs
exposed population, such as China and Mexico, to examine the association between iAs exposure and development of diabetes3,8-12.
Effective strategies to counter the adverse effects of low-to-moderate iAs exposure are critical as it is challenging to eliminate iAs from daily life18,19. Recently, Petriello et al.20
advocated identifying nutritional strategies to mitigate cardio-metabolic effects of toxic metals, such as iAs. Laboratory data also suggests that the adverse health effects of toxic metals could be reduced with optimal intake of dietary essential metals, such as magnesium (Mg) and zinc (Zn), which may decrease uptake or counter adverse metabolic effects of toxic metals21-27. However, human evidence on the effectiveness of such dietary strategies to reduce the adverse health effects of iAs is limited, and epidemiological studies have yet to access whether susceptibility to the diabetogenic effects of iAs may vary depending on levels of Mg and Zn intake28-30.
Arsenic (+3 oxidation state) methyltransferase (AS3MT) is a key enzyme in the pathway for the methylation of iAs31. Previous studies have linked several polymorphic sites in AS3MT to significant differences in urinary measures of iAs metabolism—namely proportions of the methylated metabolites—in various populations32-40. However, to our knowledge, no population
3 with environmental iAs exposure.
To sum up, the literature is lacking how, in a population with low-to-moderate iAs exposure, baseline (i.e.2009) iAs exposure relates to the development of T2D during follow-up (i.e.2015), and potential effect modification by Mg and Zn intake at baseline on the
iAs-associated T2D. In the proposed study, we took advantage of the genetic data from Mexico as well as rich longitudinal data from the ongoing longitudinal China Health and Nutrition Survey (CHNS), which include: toenail concentration of arsenic that reflects iAs exposure level in recent months at baseline; baseline dietary Mg and Zn intake captured using 3-day 24 hour recall; fasting glucose and insulin at follow-up (i.e. 2015). Using these unique data, we sought to 1) determine how, in a population with low-to-moderate iAs exposure, iAs exposure at baseline relates to the T2D incidence and indicators of glucose homeostasis at follow-up; 2) determine whether adequate intake of Mg and Zn at baseline may mitigate the diabetogenic effects of iAs; 3) determine gene-environment interactions between genetic variants of AS3MT and iAs exposure.
Research Aims
The primary goal of this dissertation was to determine the associations between baseline (i.e.2009) iAs exposure, which was captured using toenail arsenic concentration, and T2D incidence during 6-years follow-up as well as the indicators of glucose homeostasis, which was characterized by fasting glucose, fasting insulin, glycated hemoglobin, pancreatic β-cell
4
Aim 1: Determine the associations between baseline iAs exposure and the development of
T2D over 6 years. Measures of T2D development include a) indicators of glucose homeostasis
at follow-up: fasting glucose (FG), fasting insulin (FI), pancreatic β-cell function and insulin resistance, which were assessed using the updated homeostasis model assessment (HOMA2)41-43,
and b) incidence of pre-diabetes (FG≥110mg/dL and <126mg/dL) and T2D (FG≥126mg/dL) over 6 years of follow-up.
We hypothesize that among adults without diabetes at baseline, higher toenail arsenic at baseline will be associated with elevated FG and decreased pancreatic β-cell function at follow-up. We hypothesize null association between baseline toenail arsenic and insulin resistance at follow-up since β-cell dysfunction, rather than insulin resistance, is thought to be primarily involved in iAs-associated T2D. We also hypothesize positive associations between toenail arsenic at baseline and odds of incident T2D and pre-diabetes over 6 years.
Aim 2: Determine the associations between intake of Mg and Zn at baseline and
iAs-associated T2D. We prospectively assess whether the susceptibility to the diabetogenic effects
of low-to-moderate iAs exposure may vary depending on levels of Mg and Zn intake at baseline. We also examine the associations between Mg and Zn intake at baseline and the T2D incidence and indicators of glucose homeostasis at follow-up.
5
allowance (RDA) and < tolerable upper intake level) comparing with people have Mg and Zn deficiencies (intake <RDA).
Aim 3: Examine the consistency of previously established associations between multiple
AS3MT variants and the profiles of urinary arsenic metabolites and determine evidence of heterogenic in the magnitude of these associations depending on exposure level.
We hypothesize AS3MT SNPs previously reported to be associated with higher DMAs% are consistently associated with higher DMAs% in our study. We also hypothesize the
6
CHAPTER 2. LITERATURE REVIEW
Inorganic arsenic is widely distributed in our environment and thought to contribute to the
global epidemic of Type 2 diabetes
Type 2 diabetes (T2D) which is a well-recognized cause of premature death and
disability, is a complex disease with multiple contributing factors, such as obesity, environmental pollution, diet, and genetic components1-5,44-48. China has the greatest number of diabetes cases— an estimated 98.4 million—worldwide, and the prevalence of T2D doubles during the last two decades4. Though obesity is a well-known risk factor for T2D and is associated with insulin resistance, it has been suggested that obesity alone cannot fully explain the escalating epidemic of T2D, especially in regions where the prevalence of obesity is low3,8-12. Recent studies stress on the importance of pancreatic β-cell dysfunction in the development of diabetes as participants with insulin resistance are still be able to maintain normal glucose tolerance as pancreatic β-cells with normal function are able to compensate for insulin resistance7,13,14. Thus, there is a urgent need to identify and understand other T2D risk factors beyond obesity and insulin resistance, especially factors involved in pancreatic β-cell dysfunction15.
iAs is widely distributed in our environment, such as in drinking water, contaminated food, rice, air, dust, and soil16. Previous studies reported that more than 100 million people
7
Institute of Environmental Health Science-National Toxicity Program panel has agreed that existing data support an association between high exposure of iAs and increased risk of T2D49-54. There is growing concern that low-to-moderate level of iAs exposure, which is the exposure level much more common worldwide, may contribute substantially to the epidemic of T2D. Nevertheless, the results of the few prospective studies conducted in the low-to-moderately exposed populations are inconsistent51,55-57. The mixed results could be due in part to factors that include: 1) varied susceptibility due for example to differences in intake of beneficial nutrients, such as magnesium and zinc21,58-60; 2) misclassification of disease: laboratory studies have indicated the association between iAs exposure and hemoglobin concentration61,62, which raises
concern about using HbA1c to diagnose diabetes among participants exposed to iAs63,64.
Furthermore, the established association between biomarkers of iAs exposure and T2D is subject to criticism as it comes largely from cross-sectional studies. Yet diabetes has been shown to affect iAs metabolism and excretion53, posing the risk that altered iAs biomarker in diabetic individuals may be a consequence—vs. a cause—of disease17.
Adequate intake of essential metals—notably Magnesium (Mg) and Zinc (Zn)—may
mitigate iAs uptake and improve the glucose homeostasis
It is challenging to eliminate iAs from daily life due to the diverse sources of iAs exposure and limited awareness of being exposed18,19. Thus, effective strategies to counter the adverse health effects of low-to-moderate iAs exposure are critical. Recently, Petriello et al.20
8
However, human evidence on the effectiveness of such dietary strategies to reduce the adverse health effects of iAs is limited, and epidemiological studies have yet to access whether
susceptibility to the diabetogenic effects of iAs may vary depending on levels of Mg and Zn intake28-30. Indeed, population differences in intake of Mg and Zn may contribute to the
heterogeneous findings on iAs-associated diabetes to date, especially among the population low-to-moderately exposed to iAs21,26,30,58,59.
In addition, deficiencies of Mg and Zn intake, which is defined as intake < recommended dietary allowance (RDA), are common worldwide, including China and the US54,65-69. The existing evidence thus indicates that promoting adequate intake of Mg and Zn, defined as intake ≥RDA and < tolerable upper intake level (UL), could potentially be an effective strategy to counter the adverse effects of iAs, such as T2D. However, human evidence that such dietary strategies effectively counter iAs-associated T2D is limited.
Toenail arsenic better captures chronic exposure to iAs than spot urine especially in
low-to-moderately exposed populations
There is now increasing interest in using of nails as a routine biomarker of iAs exposure70-72. On ingestion, soluble iAs is absorbed from the gastro-intestinal tract and
distributed to all bodily systems in the blood. iAs is thought to accumulate in hair and nails as a result of its affinity for sulfhydryl groups and remains isolated from the body’s metabolic processes after nail formation73. In addition, researchers found toenails preferentially sequester
inorganic arsenic species, which is a more toxic form than organic arsenic70-72.
9
variation (up to 13-fold) in an individual’s total iAs urine content throughout the day75, calling into question the robustness of the routinely used spot urine sampling for iAs analysis, especially in the population that is low-to-modernly exposed to iAs.
Collectively, studies indicate toenail arsenic is a better biomarker for chronic iAs exposure comparing with spot urine, which is frequently used, especially among people low-to-moderately exposed to iAs.
China provides a special opportunity to conduct this study
First, Chinese are at higher risk of T2D at relatively lower body mass index, which highlight the need to better understand the T2D risk factors beyond obesity3,4,47,76. Secondly, to
determine the association between low-to-moderate iAs exposure and development of T2D, studies are largely needed to be conducted among populations with low-to-moderate iAs
exposure, which is the exposure level in most part of China77. Thirdly, the prevalence of Mg and Zn deficiency are high in China54,65,67. The Chinese then provide a great opportunity for us to determine whether adequate intake of Mg and Zn could be an effective strategy to counteract the adverse metabolism effects of iAs. Lastly, the China Health and Nutrition Survey (CHNS) with rich longitudinal data, especially high-quality dietary data and toenail concentration of arsenic that reflects iAs exposure level in recent months at baseline (i.e. 2009), provides a special
opportunity for us to conduct this study. All these factors make China a unique model to conduct the proposed study.
The role of AS3MT gene in iAs metabolism
In humans, the primary pathway for metabolism of iAs involves sequential methylation to form monomethylated As (MAs) and dimethylated As (DMAs) metabolites, which are
10
and lower percentages of MAs or the unmethylated iAs (MAs% and iAs%, respectively) in urine have been hypothesized to be indicators of higher capacity to metabolize iAs 31,78,79. The ratios of MAs to iAs (MAs/iAs) and of DMAs to MAs (DMAs/MAs) in urine have also been widely used as indicators of capacity for the first and second methylation steps. However, the measures of iAs metabolism most predictive of increased health risks remain to be established, given the conflicting associations reported in recent studies 31,80-83.
Arsenic (+3 oxidation state) methyltrasferase (AS3MT) is a key enzyme in the pathway for the methylation of iAs, and variants in the AS3MT have been shown to be associated with inter-individual differences in iAs metabolism 32-35,84,85. Previous studies have linked
polymorphic sites in this gene to significant differences in urinary measures of iAs metabolism in various populations 32-35,84,86. It has been suggested that iAs exposure level may modify iAs metabolism, as reflected by changes in urinary As methylation profiles, with a shift in the proportions of urinary metabolites among persons exposed to levels approximately >50ppb vs. ≤50ppb 85,87-89. We have previously reported based on laboratory experiments that levels and
proportions of the methylated products, including DMAs/MAs ratio, differ between recombinant variants of human AS3MT and depend on the substrate concentration 36. However, to our
knowledge, no population study has formally explored to what extent associations between
11 Summary
The proposed study better informs how, in a population low-to-moderately exposed to iAs, baseline dietary Mg and Zn intake relates to the association between baseline iAs exposure and development of T2D during six years of follow-up. In addition, we examined whether the influence of genetic variants in AS3MT on iAs metabolism varied by level of iAs exposure. In this dissertation, we used geographically–diverse longitudinal CHNS data to address these questions. First, we determined the association between baseline iAs exposure, which was captured by toenail arsenic at baseline, and T2D incidence as well as indicators of glucose homeostasis, which were characterized by fasting glucose, fasting insulin, glycated hemoglobin, pancreatic β-cell function, and insulin resistance at follow-up (i.e.2015). Second, we determined whether adequate intake of Mg and Zn at baseline, which was defined as intake≥ RDA and <UL, might protect against the development of T2D associated with iAs exposure. We used the
12
CHAPTER 3. EXPOSURE TO INORGANIC ARSENIC AND DEVELOPMENT OF TYPE 2 DIABETES: A LONGITUDINAL STUDY IN A POPULATION OF LOW TO
MODERATE INORGANIC ARSENIC EXPOSURE
Overview
Compelling evidence has linked high inorganic arsenic (iAs) exposure with increased risk of type 2 diabetes (T2D), however, inconsistent results were seen among populations low-to-moderately exposed to iAs. The inconsistent results could due in part to most studies are cross-sectional, whereas longitudinal study should be conducted to better capture the association between baseline iAs exposure and development of T2D. Though the underlying mechanism for iAs-associated T2D is not well established, laboratory studies indicate β-cell dysfunction, rather than insulin resistance, is predominately involved.
13
findings also suggest that instead of insulin resistance, pancreatic β-cell dysfunction is primarily involved in iAs-associated diabetes.
In addition, we also found that men, younger adults, participants who consumed alcohol, and participants from North China were more susceptible to the diabetogenic effects of iAs. In addition, though previous studies suggested reduced susceptibility of iAs-associated adverse health outcomes among obese individuals, our findings support that iAs exposure promoted rapid progression to more severe diabetes for obese individuals.
Introduction:
The prevalence of T2D, which is a well-recognized cause of premature death and
disability, has increased globally over the past two decades, especially in China1-5. It has become abundantly clear that both pancreatic β-cell dysfunction and insulin resistance are involved in the development of T2D, but the interplay between pancreatic β-cell dysfunction and insulin
resistance remains highly complex and somewhat undefined6,7. Though obesity is a well-known risk factor for T2D and is associated with insulin resistance, it has been suggested that obesity alone cannot fully explain the escalating epidemic of T2D, especially in regions where the prevalence of obesity is low3,8-12. Recent studies stress on the importance of pancreatic β-cell dysfunction in the development of diabetes as participants with insulin resistance are still be able to maintain normal glucose tolerance as pancreatic β-cells with normal function are able to compensate for insulin resistance7,13,14. Thus, there is urgent need to identify and understand
other T2D risk factors beyond obesity and insulin resistance, especially factors involved in pancreatic β-cell dysfunction15.
14
Recent reviews and meta-analyses of the epidemiological literature also suggest that exposure to levels of iAs in drinking water >150µg/L may increase the risk of T2D55,57,90. There is growing concern that low-to-moderate level of iAs exposure, which is much more common worldwide, may contribute substantially to the current epidemic of T2D, especially in countries with low prevalence of obesity. However, evidence of an association between iAs and development of T2D at low to moderate level of iAs exposure is limited and inconsistent51,55-57. In addition, most previous studies are cross-sectional, which is problematic since diabetes has been shown to affect iAs metabolism53, posing the risk that altered iAs biomarker in diabetic individuals may be a consequence—as opposed to a cause—of disease17. Thus, longitudinal studies are urgently
needed in the low-to-moderately iAs exposed population, such as China, to examine the association between iAs exposure and development of diabetes3,8-12.
In vitro studies of the pathogenesis of iAs-associated T2D have implicated the involvement of several biological processes, including impairments in the cellular adaptive response of oxidative stress and inhibition of glucose-dependent insulin secretion as a
consequence of pancreatic β-cell dysfunction53,91-96. However, the pathway (i.e. insulin resistance
vs. β-cell dysfunction) primarily involved in diabetogenic effects of iAs remains unclear. To date, few epidemiological studies have examined associations between low-to-moderate iAs exposure and pancreatic β-cell function vs. insulin resistance. Such studies are especially needed to provide insight into the potential pathogenesis of iAs-associated T2D.
To address this gap, we examined the association between baseline (i.e.2009) iAs exposure and measures of T2D development, characterized by fasting glucose, fasting insulin, glycated hemoglobin, and odds of incident prediabetes and diabetes six years later, in a
15
examine the associations between iAs exposure and insulin resistance vs. pancreatic β-cell function, which were assessed using the updated homeostasis model assessment (HOMA2)41-43, to inform the understanding of iAs-associated T2D.
Method
China Health and Nutrition Survey. The China Health and Nutrition Survey (CHNS) is an ongoing longitudinal survey, which collected health, economic, sociological, and
demographic data in nine diverse provinces throughout China from 1989-2015. Using a
multistage random cluster design, a stratified probability sample was used to select counties and cities stratified by income using State Statistical Office definitions, and then communities and households were selected from these strata. The CHNS cohort initially mirrored national age-gender-education profiles and the nine provinces in the CHNS constituted 44% of China’s population in 2009 (according to 2009 census). Questionnaires were used to collect
demographic, socioeconomic, anthropometric, behavioral and health information. Biomarker data, including fasting glucose (FG), fasting insulin (FI), and glycated hemoglobin (HbA1c), were collected at baseline (i.e. 2009) and follow-up (i.e. 2015). Toenail clippings were collected at baseline and analyzed for arsenic concentration. Survey procedures have been described elsewhere97,98. The study was approved by the Institutional Review Board at the University of North Carolina at Chapel Hill, the China-Japan Friendship Hospital, National Institute for Nutrition and Health in China, and the Chinese Center for Disease Control and Prevention.
16
(N=34), province (N=7), any blood biomarkers (FG, FI, and HbA1c, N=478). For the complete case analysis, we further excluded participants missed any blood biomarkers (i.e. FG, FI, and HbA1c) at follow-up (N=3479). Participants with extreme biomarkers, defined as 6 standard deviation above or below the mean, were also excluded (N=15). We further excluded individuals with diabetes at baseline to reduce the possibility of reverse causality (N=220), resulting in final analytic samples for the complete case analysis N=1918.
Ascertainment of diabetes. Blood samples of all participants were collected by
venipuncture after an overnight fasting. Whole blood was immediately centrifuged, serum was aliquoted and frozen at -70 degrees. Aliquots were collected in EDTA-coated vacutainers
containing sodium fluoride to prevent glucose degradation. All blood samples were analyzed in a national central lab in Beijing (medical laboratory accreditation certificate ISO15189:2007). Both baseline and follow-up FG were measured by colorimetric assay methods (GOD-PAP; Randox Laboratories Ltd, UK) using a Hitachi 7600 analyzer (Hitachi Inc., Tokyo, Japan). Both baseline and follow-up HbA1c was measured with high performance liquid chromatography (HPLC) system (model HLC-723 G7; Tosoh Corporation, Tokyo, Japan). FI at baseline was measured using a radioimmunoassay (North Institute of Bio-Tech,China) and a gamma counter (XH-6020), while FI at follow-up was measured using a chemiluminescent immunoassay.
Diabetes was defined by FG≥126mg/dL, or HbA1c≥6.5%, or self-reported diabetes diagnosis or medication use. Pre-diabetes was defined by FG≥110mg/dL to <126mg/dL, or HbA1c≥5.7% to <6.5%. Measured FI and FG were used to calculate steady state pancreatic β-cell function and insulin resistance (IR) using the Homeostasis Model Assessment (HOMA2) calculator updated in 2015 (University of Oxford,
17
updated version (computer model) of the original HOMA model (HOMA1). HOMA2 is suggested as a more accurate method than the original HOMA1, since HOMA2 accounts for variations in hepatic and peripheral glucose resistance and the reduction of peripheral glucose-stimulated glucose uptake41,42. Regular HOMA2, including regular HOMA2-IR and regular
HOMA2-β, were calculated for baseline as it is suggested for insulin measured using
radioimmunoassay. Specific HOMA2s (i.e. HOMA2-IRs and HOMA2-βs) were calculated for follow-up since specific HOMA2s were suggested to be used when insulin were measured using a chemiluminescent immunoassay41,42.
Measurement of toenail arsenic. Participants were asked to let toenails grow for at least two weeks, and stainless-steel nail scissors were used to collect toenail clippings from all ten toes. Toenail clippings were washed and sonicated for 30 minutes and dried at 80℃. After microwave-assisted digestion, toenails were analyzed using inductively coupled plasma mass spectroscopy99. The limit of detection (LOD) for arsenic by this method is 0.01μg/g. Toenail arsenic concentrations lower than the LOD were imputed at half of the LOD as 0.005μg/g (N=82/1918).
Dietary assessment. Dietary intake was assessed using three consecutive days 24-hour recalls (two weekdays and one weekend day) at the individual level and a food inventory at the household level during the same 3-day period. Trained investigators interviewed the participants to collect detailed types and amounts (in grams) of all foods and beverages consumed during the preceding 24 hours with the assistance of food pictures to aid quantification. Daily intake was calculated by the mean of three days 24-hour recalls. China Food Composition Table was used to calculate the daily total energy intake, which was validated with the doubly labeled water
18
between the two methods were 0.56 for men and 0.60 for women)100,101. Daily total energy and rice intake were calculated and categorized into tertiles. After combining all kinds of fish, we characterized participants as consumers vs. non-consumers of fish during the survey period. We used the tailored Alternate Healthy Eating Index (tAHEI), which was generated by tailoring the Harvard AHEI 2010, to assess diet quality in our study191. Details of tAHEI have been described elsewhere191.
Other variables. Standard height (in meters) and weight (in kilograms) were measured using standard protocol by trained nurses. Body mass index (BMI) was calculated as weight in kilograms divided by the square of the height in meters (kg/m2). We generated weight status
based on BMI according to the World Health Organization cutoffs for Asian adults (<18kg/m2 for underweight, 23.0-27.4kg/m2 for overweight, and ≥27.5kg/m2 for obese)102,103. Information on age (in years), sex, smoking (current, former, never smokers), drinking status (< vs. ≥once per month) was collected using questionnaires.
We used a validated urbanization index to measure degrees of urbanization104. The index
19
time (hours) spent on each type of physical activities by its specific metabolic equivalent (MET) intensity value, resulting in measures of total MET-hours/week for each domain. We calculated the overall energy expenditure for each individual by summing MET-hours spent in each domain and categorizing into tertiles.
Statistical analyses. We used natural log-transformed toenail arsenic to account for the non-normal distribution of toenail arsenic. ANOVA (continuous variables) and chi-square tests (categorical variables) were used to determine the significance of differences in baseline characteristics across tertiles of iAs exposure.
Multinomial (diabetes, prediabetes, vs. neither) logistic regression models were used to determine the association between baseline toenail arsenic and odds of incident prediabetes and diabetes during follow-up. Multivariable-adjusted linear regression models were used to examine the association between baseline toenail arsenic and FG, FI, HbA1c, IRs, and HOMA2-βs for both cross-sectional and longitudinal complete case analysis.
20
risk of T2D. We also adjusted for the geographic region due to substantial regional variation in exposure sources, diet, cooking method, and lifestyle factors across China.
In the model 2, we adjusted for the confounders that were identified based on stepwise backward selection (p<0.10) in our study. The confounders identified in our study include age, sex, weight status, drinking status, physical activity level, rice intake, and region (Figure 3.1b). Gribble et al.114 found there was substantial change in the associations between iAs exposure and development of T2D before vs. after adjusting for region. To better understand how region is related to iAs-induced T2D, we examined the associations between iAs exposure and
development of T2D adjusting for all identified confounders in our study except region (Model 3).
Gribble et al.114 found several characteristics of the population were associated with the risk of adverse health effects of iAs exposure. To better compare with previous studies and examine the consistency of the associations between iAs exposure and development of T2D by participant characteristics, we tested the interactions between iAs exposure and characteristics of the population that were suggested to be associated with iAs-associated adverse health outcomes. We also stratified our analyses by the characteristics, i.e. age (<55, 55-64, or ≥65 years), sex, body mass index (<18, 23.0-27.4, or ≥27.5kg/m2), smoking status (current, former, or never), drinking status (<, or ≥once/month), and geographic region (North, Central, South).
21
exposure in our study population112, we conducted sensitivity analysis by including all identified confounders in our study except rice intake to demine the impact of adjusting source of iAs exposure in our study. We also compared the associations between baseline toenail arsenic and development of diabetes (i.e. FG, FI, HbA1c, and HOMA2s) before vs. after excluding
participants with pre-diagnosed diabetes at follow-up (N=18), who might have adjusted their behaviors (e.g. reduced rice consumption); results did not differ meaningfully. In addition to complete case analysis, we conducted multiple imputation using predictive mean matching (five closest observations was drawn) to account for the impact of missing data.
Statistical significance of main effects was set at p<0.05 with p<0.10 indicating marginal significance. All the statistical analyses were performed in Stata, version 13.1 (StataCorp LP, College station, Texas).
Results
Baseline (i.e. 2009) sociodemographic and anthropometric characteristics, as well as biomarkers at both baseline and follow-up (i.e. 2015), arsenic exposure level at baseline
characterized by toenail arsenic are provided in Table 3.1. The concentrations of baseline toenail arsenic ranged from below the limit of detection (LOD) to 115.6μg/g, with a median of 0.32μg/g. Participants from Southern China had significantly higher toenail arsenic compared to
participants from North and Central China (Supplemental Table 3.1).
22
be estimated. The mean FI at baseline was 12.1µU/mL, mean baseline HOMA2-IR and HOMA2-β were 1.5 and 119.5%, respectively. The mean follow-up FI was 7.1µU/mL, mean HOMA2-IRs and HOMA2-βs at follow-up were 1.1 and 86.5%, respectively.
Overall, 6.7% and 46.6% of the study participants developed diabetes and prediabetes during the six years of follow-up. Compared to participants in the lower tertiles of baseline toenail arsenic distribution, participants in the highest tertile of toenail arsenic exposure (toenail arsenic concentration>0.44μg/g) had marginally higher incidence of prediabetes during follow-up (Tertile 3, Tertile 2, Tertile 1: 49.3, 45.5, 44.8%, p=0.06).
Baseline characteristics of participants across tertiles of toenail arsenic concentration were shown in Table 3.1. Toenail arsenic concentration at baseline was positively associated with rice intake as well as physical activity, and negatively associated with weight status and urbanization index. There was no significant difference in age, sex, smoking status, drinking status, and total energy intake for participants across tertiles of toenail arsenic.
Participants with lower toenail arsenic at baseline had significantly higher baseline FI (T1 vs. T2 vs. T3: 12.9± 10.5 vs. 11.8± 9.5 vs. 11.7±7.7µU/mL), HbA1c (5.5±0.4 vs. 5.4±0.4 vs. 5.3±0.4%), and HOMA2-β (123.8±47.5 vs. 117.0± 43.5 vs. 117.7± 44.7%), while we found no significant difference in baseline FG and HOMA2-IR. In contrast, we found no significant difference in follow-up FI and HbA1c among participants in different tertiles of baseline toenail arsenic, while participants with higher baseline toenail arsenic had significantly higher FG (T1 vs. T2 vs. T3: 95.1±15.8 vs. 96.7±14.4 vs. 98.7±17.4 mg/dL) and lower HOMA2-βs (89.9±32.8 vs. 86.1±32.3 vs. 83.7±32.9%) at follow-up.
23
and HbA1c (-0.05±0.01%), and the associations remained statistically significant after adjusting for region (Supplemental Table 3.2). We also found statistically significant negative association between baseline toenail arsenic and odds of diabetes at baseline (OR: 0.85, 95% CI: 0.74 - 0.97), and the association remained statistically significant after adjusting for region. In contrast, we found no significant association between baseline toenail arsenic and baseline FG, HOMA2-β, HOMA2-IR, as well as odds of prediabetes at baseline.
Our findings for the prospective analyses were different from the cross-sectional analyses. In multivariable-adjusted models (Model 3, Table 3.2), natural log transformed
baseline toenail arsenic was associated with significantly higher FG (1.44±0.30mg/dL) and lower HOMA2-βs (-1.98±0.60%) at follow-up. Moreover, we found baseline ln-toenail arsenic was positively associated with odds of incident prediabetes (OR:1.14, 95% CI:1.05-1.24) and
diabetes (OR:1.24, 95% CI: 1.10-1.46) during follow-up. The associations remained statistically significant but were attenuated after further adjustment for regions (Model 2, Table 3.2). We found no significant association between baseline toenail arsenic and FI, HbA1c, and HOMA2-IRs at follow up before and after adjusting for region.
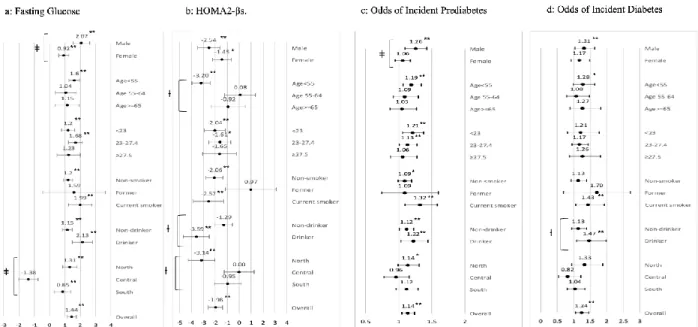
We found statistically significant interactions between baseline toenail arsenic and sex for FG at follow-up (Figure 3.2). The positive association between ln-toenail arsenic and FG at follow-up was statistically significantly stronger among men vs. women (2.07±0.54 vs.
24
For the HOMA2-βs at follow-up, we noticed marginally significant interactions between ln-toenail arsenic and age group as well as drinking status before adjusting for regions (Figure 3.2). The negative association between ln-toenail arsenic at baseline and HOMA2-βs at follow-up was stronger and only statistically significant among participants age<55 (-3.20±0.78%, P<0.05) compared with participants with age ≥55. The magnitude of the negative association between ln-toenail arsenic at baseline and HOMA2-βs at follow-up was stronger among
participants who drank alcohol vs. non-drinkers (-3.59±1.09 vs. -1.29±0.72%, respectively). We also found marginally significant interaction between ln-toenail arsenic and region for HOMA2-βs at follow-up, participants from North had significantly stronger negative association between ln-toenanil arsenic and HOMA2-βs at follow-up (North vs. Central vs. South: -3.14±1.11 vs. 0.00±1.25 vs. -0.95±1.12%).
For the odds of incident prediabetes, we found a statistically significant interaction between toenail arsenic and sex, and it remained significant after adjusting for region. The association was significantly stronger in men versus women (OR:1.17 vs. 1.03). We also found significant interaction between drinking status and ln-toenail arsenic for odds of incident diabetes, the association was significantly stronger among alcohol consumers (OR: 1.30 vs. 1.01).
We compared baseline characteristics of participants included in the complete case
25
study reflect the full population. Moreover, there was no significant change of the associations between iAs exposure and development of T2D before vs. after adjusting for rice intake, which is an important source of iAs exposure in our study population and was identified as one of the confounders in our study. However, the magnitude of the associations between iAs exposure and fasting glucose as well as HOMA2-βs attenuated after adjusting for rice intake (Supplemental Table 3.5).
Discussion
The results of our study support the association between chronic low-to-moderate iAs exposure and development of diabetes which supports the previous literature, although our study is the first to use longitudinal study data in the context of low-to-moderate iAs
exposure55,57,90,115,116.
Toenail arsenic was used as a measurement of individual chronic iAs exposure since toenails have shown to preferentially sequester iAs species, which is a more toxic form than organic arsenic70-72,74,117. Most previous studies have estimated iAs exposure level based on iAs
concentration in the primary drinking water. However, there is a growing concern that iAs from other sources, such as rice especially among Asians with rice based diet118,119. A few studies estimated individual iAs exposure based on urinary arsenic, which is generally regarded as the most reliable indicator of recent exposure to iAs. Nonetheless, a rice-feeding trial conducted by Meharg et al showed considerable variation (up to 13-fold) in an individual’s total iAs urine content throughout the day, calling into question the robustness of the routinely used spot urine samples, especially among participants low-to-moderately exposed75. The long-term
26
Endemic arsenism in China is mainly caused by breathing indoor air contaminated by iAs from coal or charcoal combustion and drinking water contaminated by iAs from natural sources, such as mining120,121. Consistent with the patterns of mineral exploitation in China, mining areas and endemic arsenism caused by coal combustion is mainly observed in rural areas of southern China, such as Guizhou122,123. Recent studies suggest that rice is another important source of iAs since rice accumulates iAs in the soil and groundwater, and iAs-contaminated rice is an
important concern especially in southern China where people are more likely to have a rice-based diets124-131. In some areas near mining districts in southern China, arsenic content in rice is around 0.7mg/kg, 2.5 times greater than the acceptable limit proposed by the Minister of Health in China121,132,133. As expected, the distribution of toenail arsenic measured in our study is consistent with the distribution of the primary sources of iAs exposure across regions: participants from southern China had higher toenail arsenic.
27
induced by iAs exposure. The real association between iAs exposure and development of diabetes could be ignored if only HbA1c is used to define diabetes139. Additional research is needed to assess the association between iAs exposure and hemoglobin, and the validity of using HbA1c to diagnose diabetes in the population exposed to iAs.
A few studies have examined the association between iAs exposure and insulin resistance, which has been regarded as the mechanism underlying typical T2D7,140, however, with inconsistent results. In line with our findings, Rotter et al.83 and Baek et al.141,142 found null association between iAs exposure and insulin resistance. In contrast with our findings, Lin et al.143 found higher insulin resistance associated with iAs exposure among obese children and
adolescents, and Del Razo et al.80 found negative association between iAs exposure and insulin resistance. As most of these studies are cross-sectional, the inconsistent results could be partially due to presence of individuals with T2D who may progressively develop insulin resistance over time, even if it is not the primary pathway leading to iAs-associated T2D144.
We found significantly negative association between baseline iAs exposure and
pancreatic β-cell function at follow-up, even after adjusting for region. Notably, In line with our findings, several in vitro and in vivo studies investigating the pathogenesis of iAs-induced T2D have implicated the involvement of β-cell dysfunction, which may be attributed to the
inflammatory and oxidative damage induced by iAs145-149. Collectively, these results indicate that instead of insulin resistance, which is the mechanism underlying typical T2D, pancreatic β-cell dysfunction is primarily involved in diabetogenic effects of iAs.
28
different results for the association between toenail arsenic and risk of diabetes using longitudinal vs. cross-sectional analysis. The longitudinal analysis suggests higher FG, aggravated β-cell dysfunction and higher odds of incident diabetes and prediabetes associated with chronic iAs exposure, whereas the cross-sectional analysis suggests lower odds of diabetes associated with iAs exposure. Our findings further suggest that the inconsistent results for the association between iAs exposure and risk of diabetes reported in previous studies could be partially explained by the different study designs.
We found the magnitude of the associations between baseline toenail arsenic and FG as well as odds of incident prediabetes was significantly stronger among men vs. women. Similarly, the magnitude of the association between baseline iAs exposure and HOMA2-βs was stronger among men vs. women, though the interaction was not statistically significant. Consistent with our findings, others have reported that men are more susceptible to toxic effects related to chronic exposure to iAs than women due to their higher capacity for iAs metabolism150-152.
Consistent with current literature, we found obese individuals tended to have lower toenail arsenic. The reasons for the inverse association between biomarkers of iAs exposure and obesity remain uncertain. Several researchers have hypothesized that the inverse association between biomarkers of iAs exposure and adiposity may ascribe to the improvement in the efficiency of iAs metabolism and secretion among obese individuals105,106,153. Alternatively, another possible explanation is that exposure to iAs may itself promote reduce adiposity and adipocyte differentiation154-159. Little is known about how obesity may modify the association between iAs exposure and development of diabetes though Fatmi et al.160 found obese
29
stronger among obese participants though the interaction between toenail arsenic and weight status was not statistically significant. The association between baseline toenail arsenic and odds of incident diabetes was only significant among obese participants. In line with our findings, Tseng et al.161 also found stronger association between iAs exposure and risk of diabetes among
the obese participants in the cross-sectional study conducted in Taiwan. Our findings suggest that iAs exposure may promote rapid progression to severe diabetes for those who are obese. Since Chinese are known to have lower BMI but higher percent body fat162-164, further research is needed to examine the association between obesity with iAs-associated diabetes, especially in the population with double burden from iAs contamination and obesity.
Our analyses were robust to adjustment for several sociodemographic and diabetes risk factors. Consistent with what was observed in the Strong Heart Study, adjustment for region attenuated the associations between iAs exposure and development of diabetes114. The associations between iAs exposure and FG, HOMA2-βs, and odds of incident diabetes were stronger among participants from North China, though the interaction was not significant for odds of incident diabetes. Our findings suggest that participants from North may be more susceptible to iAs-associated diabetes, though participants from North had lower baseline iAs exposure. The results could be partially due to other potential confounders highly correlated with region153, thus further research is needed to examine the association between other
region-correlated factors with iAs-associated diabetes, such as intake of macronutrients.
To the best of our knowledge, this is the first prospective longitudinal study designed to understand the association between baseline iAs exposure and development of T2D in a
30
dysfunction. The consistency of our multivariable-adjusted results and those from sensitivity analysis excluding participants age>70 or pre-diagnosed diabetes at follow-up also supports the positive association between iAs exposure and development of diabetes in the population with low-to-moderate iAs exposure.
Strengths of our study include the standard protocol used to collect data over the follow-up period, high-quality laboratory methods used for individual and direct measurement of chronic iAs exposure. In addition, we excluded participants with diabetes at baseline to better capture the early stage changes of iAs-associated glucose homeostasis indicators. Moreover, we take accounted for different measures of T2D (insulin resistance vs. pancreatic β-cell
dysfunction), by testing the associations between iAs exposure and insulin resistance vs. β-cell dysfunction, thus informing understanding of the underlying biological mechanism of iAs-associated diabetes.
Our study has several limitations. First, our study used toenail arsenic as the
31
32 Tables and figures
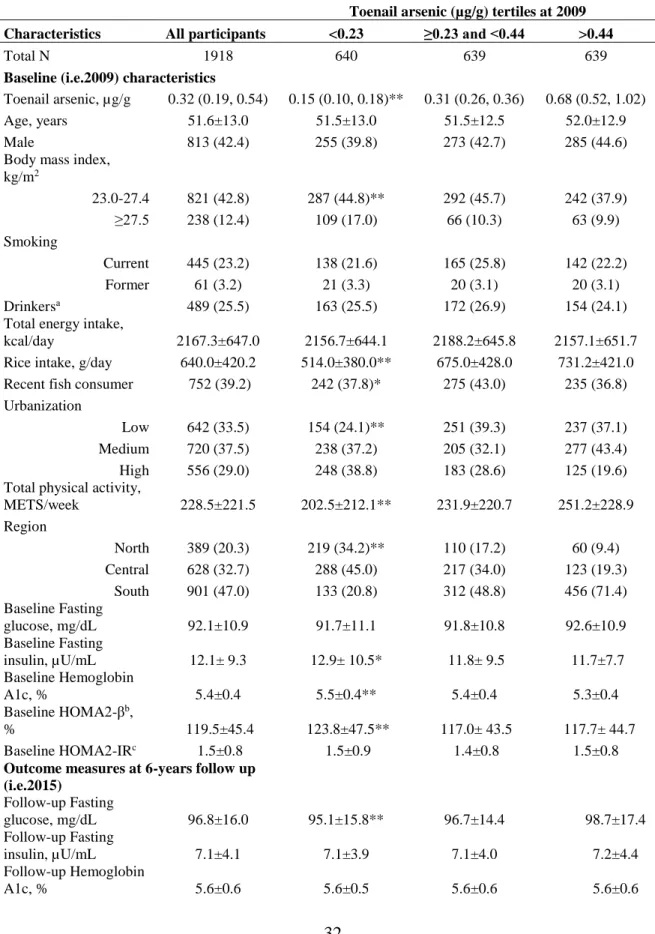
Table 3.1. Characteristics of the Study Participants by Concentration of Toenail Arsenic at baseline (i.e. 2009)
Toenail arsenic (µg/g) tertiles at 2009 Characteristics All participants <0.23 ≥0.23 and <0.44 >0.44
Total N 1918 640 639 639
Baseline (i.e.2009) characteristics
Toenail arsenic, µg/g 0.32 (0.19, 0.54) 0.15 (0.10, 0.18)** 0.31 (0.26, 0.36) 0.68 (0.52, 1.02)
Age, years 51.6±13.0 51.5±13.0 51.5±12.5 52.0±12.9
Male 813 (42.4) 255 (39.8) 273 (42.7) 285 (44.6)
Body mass index, kg/m2
23.0-27.4 821 (42.8) 287 (44.8)** 292 (45.7) 242 (37.9)
≥27.5 238 (12.4) 109 (17.0) 66 (10.3) 63 (9.9)
Smoking
Current 445 (23.2) 138 (21.6) 165 (25.8) 142 (22.2)
Former 61 (3.2) 21 (3.3) 20 (3.1) 20 (3.1)
Drinkersa 489 (25.5) 163 (25.5) 172 (26.9) 154 (24.1)
Total energy intake,
kcal/day 2167.3±647.0 2156.7±644.1 2188.2±645.8 2157.1±651.7
Rice intake, g/day 640.0±420.2 514.0±380.0** 675.0±428.0 731.2±421.0 Recent fish consumer 752 (39.2) 242 (37.8)* 275 (43.0) 235 (36.8)
Urbanization
Low 642 (33.5) 154 (24.1)** 251 (39.3) 237 (37.1)
Medium 720 (37.5) 238 (37.2) 205 (32.1) 277 (43.4)
High 556 (29.0) 248 (38.8) 183 (28.6) 125 (19.6)
Total physical activity,
METS/week 228.5±221.5 202.5±212.1** 231.9±220.7 251.2±228.9
Region
North 389 (20.3) 219 (34.2)** 110 (17.2) 60 (9.4)
Central 628 (32.7) 288 (45.0) 217 (34.0) 123 (19.3) South 901 (47.0) 133 (20.8) 312 (48.8) 456 (71.4) Baseline Fasting
glucose, mg/dL 92.1±10.9 91.7±11.1 91.8±10.8 92.6±10.9
Baseline Fasting
insulin, µU/mL 12.1± 9.3 12.9± 10.5* 11.8± 9.5 11.7±7.7
Baseline Hemoglobin
A1c, % 5.4±0.4 5.5±0.4** 5.4±0.4 5.3±0.4
Baseline HOMA2-βb,
% 119.5±45.4 123.8±47.5** 117.0± 43.5 117.7± 44.7
Baseline HOMA2-IRc 1.5±0.8 1.5±0.9 1.4±0.8 1.5±0.8
Outcome measures at 6-years follow up (i.e.2015)
Follow-up Fasting
glucose, mg/dL 96.8±16.0 95.1±15.8** 96.7±14.4 98.7±17.4
Follow-up Fasting
insulin, µU/mL 7.1±4.1 7.1±3.9 7.1±4.0 7.2±4.4
Follow-up Hemoglobin
33
Follow-up
HOMA2-βsd, % 86.5±32.8 89.9±32.8** 86.1±32.3 83.7±32.9
Follow-up
HOMA2-IRse 1.1±0.6 1.1±0.6 1.1±0.6 1.1±0.7
Follow-up Dysglycemiaf
Diabetes 128 (6.7) 32 (5.0)** 49 (7.7) 47 (7.4)
Prediabetes 893 (46.6) 287 (44.8)** 291 (45.5) 315 (49.3) Data are n (%), mean±SD, or median (25th-75th percentile) among individuals involved in the complete case analysis (N=1918). a Any alcohol consumption ≥once per month. b HOMA2-β: Regular β-cell function calculated by
Homeostasis Model Assessment (HOMA2) calculator updated in 2015 (University of Oxford,
website; http://www.dtu.ox.ac.uk/homacalculator/index.php) based on fasting glucose and fasting insulin, regular HOMA2 is suggested for insulin measured using radioimmunoassay. c HOMA2-IR: Regular insulin resistance
calculated by HOMA2. d HOMA2-βs: Specific β-cell function calculated by HOMA2, specific HOMA2 is suggested
when insulin is measured using a chemiluminescent immunoassay. e HOMA2-IRs: Specific insulin resistance
calculated by HOMA2. f Diabetes: FG≥126mg/dL, or HbA1c≥6.5%, or self-reported diabetes diagnosis or
34
Figure 3.1
a. Potential Confounders Based on Literature Showed in Directed Acyclic Graphs (DAG)
b. Confounders Identified by Stepwise Backward Selection (p<0.10) Showed in DAG
35
Table 3.2. Associations between Baseline (i.e.2009) Toenail Arsenic and Measures of Diabetesa Development during Follow-up, (i.e.2015) Characterized by
Follow-up Fasting Glucose, Fasting Insulin, Glycated Hemoglobin, Pancreatic β-cell Function, Insulin Resistance, and Odds of Incident Prediabetes and Diabetes ln-toenail arsenic at baseline
Model 1:
Age, sex, weight statusb, smoking, drinking
status, daily total energy intake, dietary quality index, rice intake, fish intake, urbanization index, physical activity level,
and region adjusted
Model 2:
Age, sex, weight statusb, drinking status, rice
intake, physical activity level, and region adjusted
Model 3:
Age, sex, weight statusb, drinking
status, rice intake, and physical activity level adjusted
Fasting glucose 0.94±0.33** 1.01±0.32** 1.44±0.30**
Fasting insulin -0.08±0.08 -0.07±0.08 0.06±0.08
Hemoglobin A1c 0.01±0.01 0.01±0.01 0.01±0.01
HOMA2-βsc -1.3740±0.67** -1.59±0.65** -1.98±0.60**
HOMA2-IRsc -0.01±0.01 -0.01±0.01 0.01±0.01
Dysglycemia
Diabetes 1.18 (0.98 - 1.42)* 1.19 (0.99, 1.42)* 1.24 (1.05 - 1.46)**
Prediabetes 1.08 (0.99 - 1.19)* 1.10 (0.92 - 1.31)** 1.14 (1.05 - 1.24)**
Results are derived from multivariable-adjusted linear regression (continuous outcomes) or multinomial logistic regression (diabetes, prediabetes, vs. neither) models. Model 1 adjusted for potential confounders based on literature (Figure 3.1a), including age and sex, weight status (body mass index<18, 23.0-27.4, or ≥27.5), smoking, drinking status, daily total energy intake, dietary quality index, rice intake, fish intake, urbanization index, physical activity level and region. Model 2 adjusted for all the confounders in our study identified by stepwise backward selection (p<0.10) (Figure 3.1b). Model 3 adjusted for all identified confounders in our study except region. a Diabetes: FG≥126mg/dL, or HbA1c≥6.5%, or self-reported diabetes diagnosis or medication use. Prediabetes:
FG≥110mg/dL to <126mg/dL, or HbA1c≥5.7% to <6.5%. b Weight status defined as Underweight: BMI<18kg/m2; Normal weight: BMI≥23.0 to <27.5kg/m2;
Obese: BMI≥27.5kg/m2. c Specific pancreatic β-cell function (HOMA2-βs) and specific insulin resistance (HOMA2-IRs) calculated by Homeostasis Model
36
Figure 3.2. Adjusted Mean (SE) Differences in Indicators of Glucose Homeostasis at Follow-up (i.e.2015) as well as Odds Ratio of Incident Type 2 Diabetes (T2D) Associated with Toenail Arsenic at Baseline (i.e.2009) Stratified by Sex, Age, Weight Status, Smoking and Drinking Status, and Region.
Results are derived from multivariable-adjusted linear regression (continuous outcomes) or multinomial logistic regression (diabetes, prediabetes, vs. neither) models adjusted for all the confounders in our study identified by stepwise backward selection (p<0.10), except region. The confounders identified in our study include age, sex, weight status, drinking status, physical activity level, rice intake. a HOMA2-βs: Specific β-cell function calculated
by Homeostasis Model Assessment (HOMA2) calculator updated in 2015 (University of Oxford,
website; http://www.dtu.ox.ac.uk/homacalculator/index.php) based on fasting glucose and fasting insulin. b
37
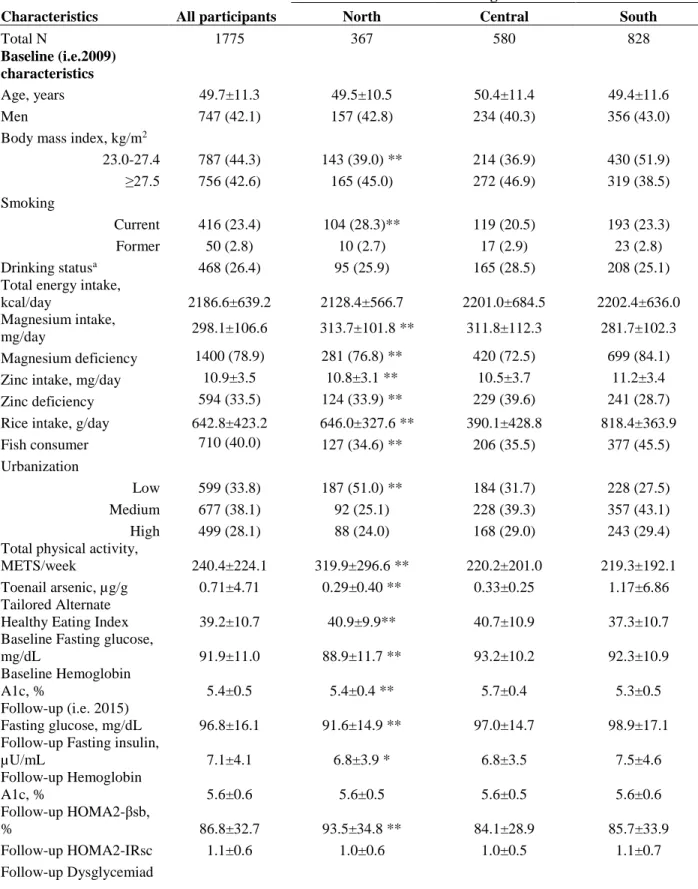
Supplemental Table 3.1. Characteristics of Study Participants by Regions
Regions
Characteristics All participants North Central South
Total N 1918 389 628 901
Baseline (i.e.2009) characteristics
Toenail arsenic,
µg/g 0.32 (0.19, 0.54) 0.21 (0.10, 0.35)** 0.25 (0.16, 0.40) 0.44 (0.29, 0.74)
Age, years 51.6±13.0 51.0±11.8 52.3±12.9 51.5±13.2
Male 813 (42.4) 170 (43.7) 256 (40.8) 387 (43.0)
Body mass index, kg/m2
23.0-27.4 821 (42.8) 178 (45.8)** 299 (47.6) 344 (38.2)
≥27.5 238 (12.4) 60 (15.4) 95 (15.1) 83 (9.2)
Smoking
Current 445 (23.2) 109 (28.0) 130 (20.7) 206 (22.9)
Former 61 (3.2) 15 (3.9) 21 (3.3) 25 (2.8)
Drinkersa 489 (25.5) 98 (25.2) 174 (27.7) 217 (24.1)
Total energy intake,
kcal/day 2167.3±647.0 2125.4±566.8 2195.8±702.6 2165.5±638.8
Rice intake, g/day 640.0±420.2 636.7±326.3** 395.4±432.8 811.9±358.3 Recent fish
consumer 752 (39.2) 137 (35.2)** 220 (35.0) 395 (43.8)
Urbanization
Low 642 (33.5) 189 (48.6)** 200 (31.9) 253 (28.1)
Medium 720 (37.5) 99 (25.5) 239 (38.1) 382 (42.4)
High 556 (29.0) 101 (26.0) 189 (30.1) 266 (29.52)
Total physical activity,
METS/week 228.5±221.5 303.8±295.6** 208.7±199.2 209.8± 189.9
2009 Fasting
glucose, mg/dL 92.11±10.99 89.27±11.93** 93.31±10.09 92.50±10.96 2009 Fasting
insulin, µU/mL 12.16± 9.35 11.97±8.94** 13.20±11.22 11.52±7.93 2009 Hemoglobin
A1c, % 5.44±0.46 5.45±0.35** 5.68±0.39 5.27±0.46
2009 HOMA2-IRb 1.51±0.89 1.48±0.93** 1.60±0.92 1.47±0.86
2009 HOMA2-β, %c 119.53±45.40 125.33±48.46** 121.98±47.44 115.33±42.11 Outcome measures at 6-years follow up (i.e.2015)
2015 Fasting
glucose, mg/dL 96.8±16.0 91.6±15.0** 97.1±14.5 98.9±16.9
2015 Fasting
insulin, µU/mL 7.1±4.1 6.8±3.9* 6.8±3.5 7.5±4.5
2015 Hemoglobin
A1c, % 5.6±0.6 5.6±0.5 5.6±0.5 5.6±0.6
2015 HOMA2-IRsd 1.1±0.6 1.0±0.6** 1.0±0.5 1.1±0.7
2015 HOMA2-βs,
%e 86.5±32.8 93.6±35.3** 83.6±28.9 85.6±33.8
2015 Dysglycemiaf
38
Prediabetes 893 (46.6) 146 (37.5)** 319 (50.8) 428 (47.5) Data are n (%), mean±SD, or median (25th-75th percentile) among individuals involved in the complete case analysis (N=1918). a Any alcohol consumption ≥once per month. b HOMA2-IR: Regular insulin resistance calculated
by Homeostasis Model Assessment (HOMA2) calculator updated in 2015 (University of Oxford,
website; http://www.dtu.ox.ac.uk/homacalculator/index.php) based on fasting glucose and fasting insulin, regular HOMA2 is suggested for insulin measured using radioimmunoassay. c HOMA2-β: Regular β-cell function
calculated by HOMA2. d HOMA2-IRs: Specific insulin resistance calculated by HOMA2, specific HOMA2 is
suggested when insulin is measured using a chemiluminescent immunoassay. e HOMA2-βs: Specific β-cell function
calculated by HOMA2. fDiabetes: FG≥126mg/dL, or HbA1c≥6.5%, or self-reported diabetes diagnosis or
39
Supplemental Figure 3.1. Adjusted Mean (SE) Differences in Indicators of Glucose Homeostasis at Follow-up (i.e.2015) as well as Odds Ratio of Incident Type 2 Diabetes (T2D) Associated with Toenail Arsenic at Baseline (i.e.2009) Stratified by Sex, Age, Weight Status, Smoking and Drinking Status, and Region.
Results are derived from multivariable-adjusted linear regression (continuous outcomes) or multinomial logistic regression (diabetes, prediabetes, vs. neither) models adjusted for all the confounders in our study identified by stepwise backward selection (p<0.10) (Figure 3.1b). The confounders identified in our study include age, sex, weight status, drinking status, physical activity level, rice intake, and region. a HOMA2-βs: Specific β-cell function
calculated by Homeostasis Model Assessment (HOMA2) calculator updated in 2015 (University of Oxford, website; http://www.dtu.ox.ac.uk/homacalculator/index.php) based on fasting glucose and fasting insulin. b