THE EFFECTS OF MATERNAL PREPREGNANCY BODY MASS INDEX AND PSYCHOLOGICAL FACTORS ON INFANT FEEDING BEHAVIORS
Ushma J. Mehta
A dissertation submitted to the faculty of the University of North Carolina at Chapel Hill in partial fulfillment of the requirements for the degree of Doctor of Philosophy in
the Department of Nutrition, Gillings School of Global Public Health.
Chapel Hill 2010
ii
iii
ABSTRACT
USHMA J. MEHTA: The Effects of Maternal Prepregnancy Body Mass Index and Psychological Factors on Infant Feeding Behaviors
(Under the direction of Dr. Anna Maria Siega-Riz)
iv
Data came from the postpartum component of the Pregnancy, Infection, and Nutrition study. Pregnant women, recruited from the University of North Carolina hospitals between January 2001 and June 2005, were followed from pregnancy to postpartum. Using multivariable regression analysis, we found that women who entered pregnancy overweight or obese were less likely to adhere to current infant feeding recommendations. Specifically, overweight or obese women were less likely to initiate breastfeeding; more likely to breastfeed for shorter duration (any or exclusive); and more likely to introduce complementary foods before 4 months of age compared to women of normal BMI. We did not find evidence to support the hypothesis that the association between pregravid BMI and infant feeding was mediated by psychological factors.
Our results showed a strong association between maternal pregravid BMI and infant feeding behaviors but, contrary to our expectations, we did not find evidence for a mediatory psychological pathway. This suggests that other factors may be more
v
DEDICATION
vi
TABLE OF CONTENTS
LIST OF TABLES ... viii
LIST OF FIGURES ...x
LIST OF ABBREVIATIONS ... xi
I. INTRODUCTION ...1
Research Aims ...2
II. LITERATURE REVIEW ...3
Infant Feeding Definitions ...4
Infant Feeding Determinants...6
Mechanisms Linking Maternal Obesity and Infant Feeding Behaviors ...11
III. METHODS ...17
Study Design and Population ...17
Study Variables and Statistical Analysis ...18
IV. MATERNAL OBESITY, PSYCHOLOGICAL FACTORS AND BREASTFEEDING INITIATION ...20
Introduction ...20
Methods...21
Results ...27
vii
V. MATERNAL OBESITY, PSYCHOLOGICAL FACTORS, AND BREASTFEEDING DURATION:
IS THERE A LINK? ...41
Introduction ...41
Methods...43
Results ...49
Discussion ...52
VI. PREGRAVID BMI IS ASSOCIATED WITH EARLY INTRODUCTION OF COMPLEMENTARY FOODS ...62
Introduction ...62
Methods...63
Results ...68
Discussion ...70
VII. CONCLUSION ...77
Summary of Key Findings ...77
Review of Aims ...78
Study Strengths ...79
Study Limitations ...80
Public Health Implications ...82
Directions for Future Research ...83
APPENDIX ...86
viii
LIST OF TABLES
Table
1. Maternal characteristics of participants who completed the 3 month postpartum interview in the Pregnancy,
Infection and Nutrition study (n = 688). ...34 2. Maternal psychological characteristics of participants
who completed the 3 month postpartum interview in the
Pregnancy, Infection and Nutrition study. ...36 3. Unadjusted regression analysis of possible mediation by psychological
factors of the effect of pregravid BMI on breastfeeding
initiation in the Pregnancy, Infection and Nutrition Study1. ...38 4. Maternal characteristics by pregravid BMI and
breastfeeding status among women in the Pregnancy,
Infection and Nutrition postpartum study (n = 550). ...57 5. Pregravid BMI and breastfeeding status by levels of
depressive symptoms, stress and anxiety in the Pregnancy,
Infection and Nutrition study. ...58 6. Crude and adjusted results for multinomial logit
regression models of the association between
pregravid BMI and breastfeeding duration. ...59 7. Maternal characteristics by pregravid BMI and age of
complementary food introduction among women in the
Pregnancy, Infection and Nutrition postpartum study (n = 550). ...74 8. Multinomial regression results of the association between
pregravid BMI and age of complementary food introduction. ...76 9. Mediation analysis of the association between pregravid
BMI and duration of any breastfeeding by depressive
symptoms in the Pregnancy, Infection and Nutrition study. ...87 10. Mediation analysis of the association between pregravid
BMI and duration of any breastfeeding by perceived stress
in the Pregnancy, Infection and Nutrition study. ...88 11. Mediation analysis of the association between pregravid
ix
in the Pregnancy, Infection and Nutrition study. ...90 12. Mediation analysis of the association between pregravid
BMI and exclusive breastfeeding duration by depressive
symptoms in the Pregnancy, Infection and Nutrition study. ...92 13. Mediation analysis of the association between pregravid
BMI and exclusive breastfeeding duration by perceived stress
in the Pregnancy, Infection and Nutrition study. ...93 14. Mediation analysis of the association between pregravid
BMI and exclusive breastfeeding duration by state anxiety
in the Pregnancy, Infection and Nutrition study. ...94 15. Mediation analysis of the association between pregravid
BMI and age of complementary food introduction by depressive
symptoms in the Pregnancy, Infection and Nutrition study. ...96 16. Mediation analysis of the association between pregravid
BMI and age of complementary food introduction by perceived stress
in the Pregnancy, Infection and Nutrition study. ...97 17. Mediation analysis of the association between pregravid
BMI and age of complementary food introduction by state anxiety
x
LIST OF FIGURES
Figure
1. Influences of breastfeeding choices as represented
by a Social Ecological Framework ...7 2. Attrition in the Pregnancy, Infection and Nutrition
Study, from pregnancy to postpartum. ...19 3. Relationship between pregravid BMI, breastfeeding
initiation, psychological factors and covariates. ...40 4. Predicted probability of any breastfeeding duration
by pregravid BMI status in the Pregnancy,
Infection and Nutrition study. ...60 5. Predicted probability of exclusive breastfeeding duration
by pregravid BMI status in the Pregnancy,
xi
LIST OF ABBREVIATIONS
AAP American Academy of Pediatrics BMI Body Mass Index
CDC Centers for Disease Control and Prevention PIN Pregnancy, Infection, and Nutrition Study
PIN3 Pregnancy, Infection, and Nutrition Study, third cohort PINPost Pregnancy, Infection, and Nutrition Postpartum Study
RR Risk Ratio
CHAPTER I
INTRODUCTION
In the U.S., adherence to infant feeding guidelines is low. Almost three-quarters of women initiate breastfeeding but rates decline considerably in the first few months postpartum1 and many women introduce complementary foods before the recommended age.2, 3 Low breastfeeding rates may be explained, in part, by the rise in obesity among women of childbearing age. More than half of all women of childbearing age are overweight or obese and recent studies associate entering pregnancy at this high body mass index (BMI) with being less likely to initiate breastfeeding, breastfeeding for a shorter duration, and introducing complementary foods at an earlier age.4-7 The reason behind the increased rate of cessation among overweight/obese women is unclear although there is evidence of a biological, physical, and psychological basis for this relationship.8, 9
The overall goal of this dissertation was to determine the association between pregravid BMI and infant feeding behaviors and whether psychological reasons help to explain this relationship. Infant feeding practices include breastfeeding initiation,
breastfeeding duration (any and exclusive), and age of complementary food introduction.
2
Aim 1: Determine the relationship between pregravid BMI and infant feeding
outcomes.
Hypothesis: Women who are overweight or obese before pregnancy will be more
likely to not breastfeed, to breastfeed for shorter duration, and to introduce complementary foods earlier than women of normal pregravid BMI.
Aim 2: Explore whether pregravid BMI is associated with infant feeding via a
psychological pathway, represented by depressive symptoms, perceived stress,
anxiety and self-esteem during pregnancy.
Hypothesis: That the psychological factors will explain part of the effect of
CHAPTER II
LITERATURE REVIEW
According to the World Health Organization (WHO), ―inappropriate feeding practices and their consequences are major obstacles to sustainable socioeconomic development and poverty reduction.‖10 The WHO and the American Academy of
Pediatrics (AAP) promote breastfeeding as the ideal method of meeting the nutrient needs of infants.10, 11 Breastfeeding provides short and long-term health benefits for both mother and child. Women who breastfeed their infants have lower risk of developing ovarian and premenopausal breast cancers, osteoporosis, and reduced risk of postpartum bleeding.12, 13 Children benefit from breastfeeding through lower risk of ear and respiratory infections, gastrointestinal illness, type 2 diabetes, and sudden infant death syndrome.14-16
The WHO and AAP recommend exclusive breastfeeding (breast milk only) for the first 6 months of life.10, 11 Despite these recommendations, a quarter of infants are supplemented with formula before they are 2 days old; 33.1% of infants are exclusively breastfed until 3 months and 13.6% until 6 months of age.1
4
increased risk of childhood obesity because infants who are formula or mixed-fed have a faster growth rate and weigh more than exclusively breastfed infants.7, 18 Several meta-analyses have found conflicting evidence of the suggested protective effect of
breastfeeding initiation and longer duration against childhood overweight 19-21 but this may be due to differences in sample size and population, follow-up time, reporting bias,
confounders, and definitions of exposure and outcome.22
Maternal obesity may be a risk factor for poor infant feeding behaviors. Studies worldwide have found that women who are overweight or obese before pregnancy may be less likely to initiate breastfeeding and breastfeed for a shorter duration; there is some evidence that they may also be more likely to introduce complementary foods earlier.6, 7, 23-25, 26
The reason behind the increased rate of cessation among overweight/obese women is unclear although there is evidence of a biological, physical, psychological and
psychosocial basis for this relationship.8, 9 The Pregnancy, Infection and Nutrition Postpartum study (PINPost), a longitudinal cohort study following women from pregnancy to postpartum, provided the unique opportunity to better understand the associations between maternal pregravid weight status, psychological factors during pregnancy and infant feeding practices.
Infant Feeding Definitions
This section provides a background of infant feeding definitions and current guidelines. Exclusive breastfeeding is feeding the infant only breast milk with the exception of drops or syrups consisting of vitamins, mineral supplements or medicines.27
5
feeding refers to breastfeeding as well as feeding solid foods or other liquids (including formula).
6
Infant Feeding Determinants
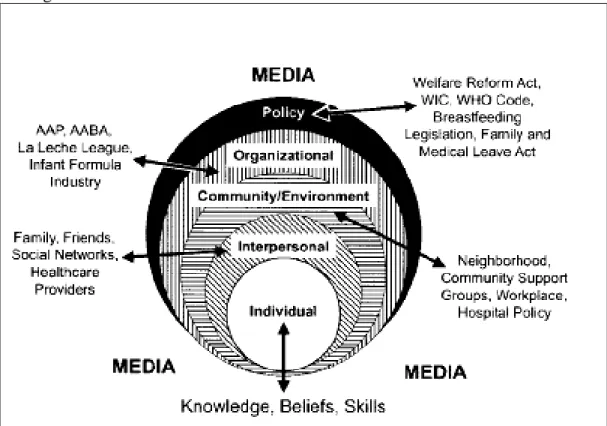
A multitude of individual-, interpersonal-, societal-, community/environmental-, organizational-, and policy-level factors influence maternal decisions related to infant feeding. In this section, we briefly discuss these determinants of infant feeding utilizing a social ecological framework as created by Bentley, Dee and Jensen in 2003.34 A visual representation of this framework can be seen in Figure1 below.
Determinants discussed here were chosen based on a literature review of infant feeding risk factors. Main exposures (maternal pregravid BMI, depressive symptoms, stress, anxiety and self-esteem) will be discussed in greater detail in upcoming sections. We start with policy-level risk factors and narrow down to the center of the sphere, placing particular emphasis on the individual-level determinants of infant feeding as these were the primary factors measured in the PIN study.
Policy
National and international policies affect environmental or community-level factors which, in turn, influence intrapersonal or individual-level determinants. In the U.S., laws addressing breastfeeding rights are both federal and state-specific. The most recent enacted breastfeeding legislation affirmed the right to breastfeed on federal property or in federal buildings. The Breastfeeding Promotion Act of 2009 was recently introduced in the House of Representatives; its objective is ―to amend the Civil Rights Act of 1964 to protect breastfeeding by new mothers; to provide for a performance standard for breast pumps; and to provide tax incentives to encourage breastfeeding.‖35
7
government also provides funding support for breastfeeding promotion through programs as WIC (Special Supplemental Nutrition Program for Women, Infants, and Children).36 WIC infant feeding policies were recently improved to better promote breastfeeding based on recommendations of the Institute of Medicine (IOM).37, 38
Most US states have enacted breastfeeding laws but these vary considerably in the level of rights that are protected. For example, 39 states, the District of Columbia, and the Virgin Islands currently have laws specifically allowing women to breastfeed in any public or private location while only twenty states have addressed workplace
breastfeeding.39
Figure 1. Influences of breastfeeding choices as represented by a Social Ecological Framework. 34
8
International policies relating to breastfeeding are established by organizations such as the WHO and UNICEF and these can greatly influence national policies. A prominent policy affecting the marketing of formula was the International Code of Marketing of Breast-Milk Substitutes, adopted by the World Health Assembly in 1981. This Code was created to protect and promote appropriate infant feeding by regulating the marketing of breast-milk substitutes, feeding bottles, and teats.16
Organizational
Organizations such as the American Academy of Pediatrics and La Leche League promote breastfeeding which influences policy-makers and health-care professionals; however, they do not create policy. Consequently, formula companies are able to
aggressively market infant formula. Formula promotion activities occur through multiple paths; media is a potent marketing vehicle and includes television shows and
advertisements for infant formula, bottles and other supplies. This creates an atmosphere where feeding formula is the norm and breastfeeding is unconventional.34 Another method used by formula companies to establish formula as easier than breastfeeding and as nutritionally comprehensive as breast milk is through distribution of hospital discharge packs and provision of coupons for free or discounted formula.11, 40
Community/Environment
9
However, child care facilities, paid maternity leave, lack of long mother-infant separations, and the option to work part-time can promote successful breastfeeding.41
Hospital policies regarding rooming-in also impact the initiation of breastfeeding; keeping the infant in the mother’s room after birth is shown to increase the chances of breastfeeding initiation because it is thought to promote demand feeding (feeding every 2-3 hours) and mother-infant contact.11, 42 Lack of timely routine follow-up care and postpartum home health visits also result in reduced duration of breastfeeding.11
Interpersonal
At the interpersonal level, the woman’s network of family, friends, and healthcare providers exert influence over infant feeding decisions.42, 45 The woman’s partner is often the most influential factor in feeding decisions; partners who are supportive of
breastfeeding increase the likelihood of breastfeeding initiation.46 Women are also more likely to initiate and continue breastfeeding if they find support from other members of their social network such as their mother and friends and guidance from healthcare providers.42, 47, 48
Individual
Sociodemographic
10
CDC data on breastfeeding rates for children born during 2003-2006 show stark ethnic differences in the rates of breastfeeding. 49 Asian/Pacific Islander (80.9%) and Hispanic women (80.4%) have the highest rates of any breastfeeding, followed by non-Hispanic white (74.3%) and, lastly, non-non-Hispanic black women (54.4%).49 Time spent in the US may also affect breastfeeding prevalence. A study of immigration status and ethnicity revealed US-born women of Hispanic descent had lower rates of breastfeeding compared with foreign-born Hispanic mothers.50
Psychological
Psychological factors associated with poor infant feeding practices include high levels of stress, anxiety, and pregnancy/ postpartum depression.51-53 Mothers
experiencing higher levels of stress, depression and anxiety may be at greater risk of following a nonresponsive feeding style.53 High maternal breastfeeding self-efficacy, parental confidence in infant care, and confidence in breastfeeding and are also related to feeding decisions.51, 52, 54
Maternal health
Smoking and entering pregnancy overweight or obese is negatively associated with initiation and continuation of breastfeeding.9, 55 Women who experience pregnancy or birth complications such as a cesarean section and lengthy duration of labor or are given labor medications may be less likely to initiate breastfeeding. 46, 56, 57
11
Infants that are male, born with higher birth weight, and whose mothers perceived them as ready for food other than breast milk or formula are more likely to be fed solid foods early.52, 58, 59 Infants born preterm and those admitted into the neonatal intensive care unit following birth have a greater risk of not being breastfed and of early weaning.57
Mechanisms Linking Maternal Obesity and Infant Feeding Behaviors
Currently, more than half of all women in the US are overweight or obese.60 Maternal pregravid BMI appears to be a strong predictor of infant feeding practices but the number of observational studies in U.S. populations is limited and the ability to control for confounding has been suboptimal.
Using the Danish National Birth Cohort (DNBC), Baker and colleagues
(N=37,459 mother-infant pairs) found that women classified as overweight and obese had increased odds of early breastfeeding cessation compared with women of normal
pregravid BMI (12% and 39% increase in odds of early termination respectively).7 Oddy et al (2006) found similar associations from prospective cohort data collected in an
12
Maternal obesity before pregnancy is thought to affect infant feeding behavior via several pathways.62 Obesity may delay lactogenesis II by altering prolactin or
progesterone levels in the body.63, 64 Lactogenesis II is the stage of breastfeeding occurring one to three days postpartum in which production of abundant milk supply is stimulated.64 Delayed lactogenesis II may affect a mother’s perception of the adequacy of her milk supply which, in turn may influence her decision to discontinue breastfeeding early.65 Maternal obesity before conception also places women at greater risk for adverse pregnancy outcomes such as preterm birth, cesarean section, or a large-for-gestational age baby which are all associated with reduced lactation success; possible reasons may be because of delayed lactogenesis II or resulting hospital practices that interfere with successful breastfeeding initiation.8
Researchers have also suggested a physical basis for breastfeeding decisions. Infants of obese women may have difficulty latching on to the breast, which is critical to the stimulation of breast milk.66 Obese women may be more likely to have larger breasts which may make proper positioning of the infant problematic.62, 66 They may also be more likely to have flattened areolas and nipples which would make latching on difficult.62, 66
Psychological pathway
13
status, possibly in a bidirectional relationship.67, 68 Evidence from the National Epidemiologic Survey on Alcohol and Related Conditions (NESARC), the largest psychiatric epidemiology study conducted thus far showed that being obese predicted increased odds of any mood, anxiety, alcohol use disorders and personality disorders.69 Being moderately overweight was also associated with anxiety and some substance disorders. There is some evidence that obesity disproportionately affects
psychopathology in women70 and that it affects psychological status during pregnancy. Prior analyses of PIN data revealed that higher pregravid BMI increased the risk of poor psychological status during pregnancy as characterized by higher perceived stress, trait anxiety, depressive symptoms, and lower self-esteem.71 Another study found a dose-response relationship between pregravid BMI and Major Depressive Disorder occurrence during pregnancy.68
Research on the relationship between psychological factors and infant feeding has focused more on the protective role of breastfeeding on postpartum psychological status than the relationship between psychological factors in pregnancy and infant feeding. Researchers have found an association between depressive symptoms/stress/anxiety in postpartum and early cessation of breastfeeding.48, 72-77 Most studies have not used clinically diagnosed depression or anxiety in their analysis but used questionnaires to assess symptoms of these psychological factors. However, a study among 1745
14
Fewer studies have examined the effect of psychological status in pregnancy on infant feeding behaviors. In a study of 1448 women, Pippins et al78 used the Center for Epidemiologic Studies Scale (CES-D) to measure depressive symptoms experienced in the month prior to pregnancy and at three subsequent time points during pregnancy.
Depressive symptoms prior to or during pregnancy were not associated with breastfeeding initiation but were related to breastfeeding less than 1 month. However, the presence of depressive symptoms in the month prior to pregnancy was measured around 15 gestational weeks and responses may have been affected by recall bias. Fairlie et al79 reported that high levels of depressive symptoms and anxiety during pregnancy were not associated with breastfeeding initiation but were related to increased risk of planning to formula feed. There is less epidemiologic evidence for the associations between stress/self-esteem and infant feeding. In a cohort study of 2420 Australian women, Li et al. found that stressful life events during pregnancy predicted shorter duration of breastfeeding.80 In addition, stress may result in hormonal changes that impede the onset of lactogenesis.81 A recent qualitative study of 17 adolescent mothers in the U.K. identified self-esteem as being important to breastfeeding intention, especially as being protective against societal pressures to not breastfeed82 . Further, self-esteem may be related to infant feeding through its association with self-efficacy, which significantly predicts breastfeeding duration.54
15
did not estimate age of introduction. A more recent study among 37,919 mothers participating in the Norwegian Mother and Child Cohort Study found that maternal negative affectivity, conceptualized as the combination of anxiety and depression, predicted greater likelihood of introducing solid foods by 3 months of age and sweet drinks by month 6.84
It is difficult to compare across studies since they vary in their definitions of the psychological factors and breastfeeding, their method of assessment of both exposure and outcome, and the time span involved. Most of the information on the relationship between psychological factors and breastfeeding has come from observational studies.
Consequently, it is difficult to determine causality. For example, breastfeeding and
depression may be associated but the direction of the relationship is difficult to determine. There is evidence that women who are depressed are less likely to initiate breastfeeding and to breastfeed for a shorter duration than women who do not experience perinatal depression.51, 74, 78, 85 On the other hand, studies have shown that breastfeeding may be protective of postpartum depression.14, 75 There may, in actuality, be an interdependent relationship.
16
satisfaction, behavioral beliefs regarding breastfeeding and bottle-feeding, and social learning.
CHAPTER III
METHODS
Study Design and Population
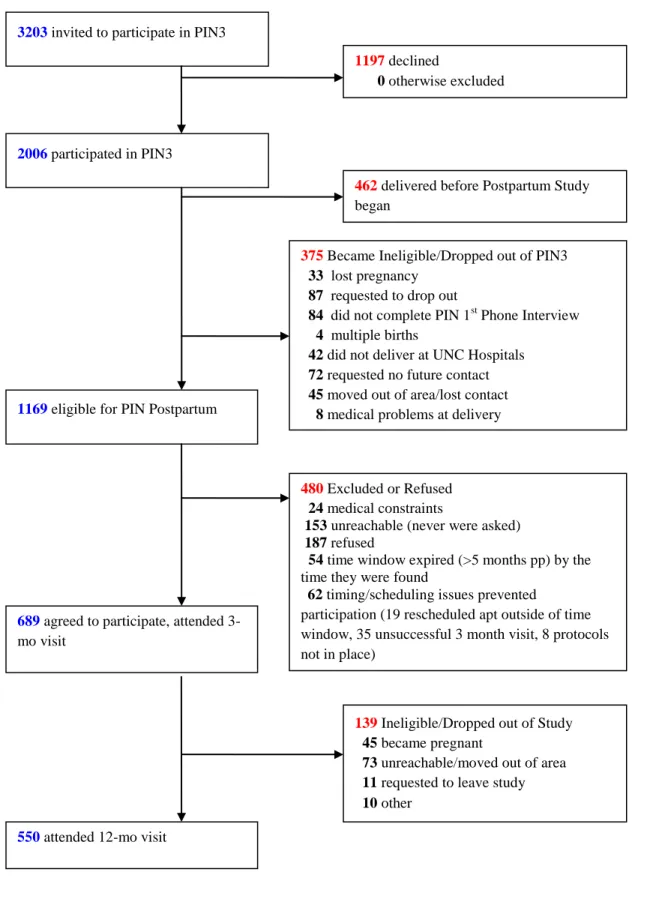
We used data from the postpartum component of the Pregnancy, Infection, and Nutrition study cohort 3 (PIN3), a longitudinal prospective cohort study identifying etiologic factors for preterm delivery. Of the 3203 women eligible to participate in the PIN3 study, 2,006 were followed through pregnancy. Pregnant women seeking prenatal services from University of North Carolina (UNC) hospitals between January 2001 and June 2005 were recruited for the pregnancy component. Exclusionary criteria included women younger than 16, non-English speaking, greater than or equal to 20 weeks’ gestation on their second prenatal visit, not planning to continue care or deliver at the study site, and those carrying multiple gestations. Women were interviewed during pregnancy at 15-20 weeks (clinic visit 1), 17-22 weeks (telephone interview 1), 24-29 weeks (clinic visit 2), 27-30 weeks (telephone interview 2), and after delivery in the hospital. Participants for the postpartum component were those women followed through pregnancy and who gave birth after the postpartum study recruitment began; 1169 women were eligible to participate in the postpartum period. Exclusionary criteria
18
be contacted after delivery were phoned at 6 weeks postpartum; 480 refused or were ineligible, leaving 689 who participated in the 3 month interview. 550 completed both 3 and 12 month interviews. Reasons for attrition from 3 to 12 months postpartum included moving out of study area/being unreachable, request to drop out, and becoming pregnant. Attrition from pregnancy to postpartum is shown in Figure 2.
Study variables and statistical analyses
19
Figure 2. Attrition in the Pregnancy, Infection and Nutrition study, from pregnancy to postpartum.
3203 invited to participate in PIN3
2006 participated in PIN3
375Became Ineligible/Dropped out of PIN3
33 lost pregnancy
87 requested to drop out
84 did not complete PIN 1st Phone Interview
4 multiple births
42 did not deliver at UNC Hospitals
72 requested no future contact
45 moved out of area/lost contact
8 medical problems at delivery
1169 eligible for PIN Postpartum
689 agreed to participate, attended 3-mo visit
1197 declined
0 otherwise excluded
139 Ineligible/Dropped out of Study
45 became pregnant
73 unreachable/moved out of area
11 requested to leave study
10 other
550 attended 12-mo visit
462 delivered before Postpartum Study began
480 Excluded or Refused
24 medical constraints
153 unreachable (never were asked)
187 refused
54 time window expired (>5 months pp) by the time they were found
62 timing/scheduling issues prevented
CHAPTER IV
MATERNAL OBESITY, PSYCHOLOGICAL FACTORS AND BREASTFEEDING INITIATION
Introduction
Leading health organizations world-wide recognize breastfeeding as the ideal method of meeting an infant’s nutritional needs.10, 11 Despite this, 25% of mothers in the United States (U.S.) do not initiate breastfeeding.1 Recent studies suggest that women who enter pregnancy at a higher body mass index (BMI) are less likely to initiate breastfeeding.4, 5, 25, 86 Reasons for this association are unclear although biological, physical, and psychological pathways are thought to be involved.8, 9 Psychological factors during pregnancy may be modifiable with the appropriate interventions and, therefore, are an important avenue of research.
Currently, there is little research of a potential mediatory pathway between pregravid BMI and breastfeeding initiation by psychological factors. Prior research shows that maternal obesity is associated with women’s psychological status during the perinatal period (pathway ―a‖ in Figure 3)68, 71
21
initiation have found conflicting results, and the use of different measurement scales makes it difficult to compare results across studies.78, 79, 87 One study that examined anxiety during pregnancy found no relationship to breastfeeding initiation although higher levels were related to a lower intent to breastfeed, which is known to predict initiation.26, 79, 88 To our knowledge, the effects of prenatal perceived stress and self-esteem on breastfeeding initiation has not previously been studied.
In this paper, we present findings on the associations between pregravid BMI, psychological factors (prenatal depressive symptoms, stress, anxiety, self-esteem) and breastfeeding initiation. We hypothesize that women who are overweight or obese before pregnancy are less likely to initiate breastfeeding. Furthermore, we expect that part of the association between pregravid BMI and breastfeeding initiation is mediated by the
presence of higher levels of depressive symptoms, stress, and anxiety and lower levels of self-esteem among overweight and obese women during pregnancy. Levels of these psychological factors during pregnancy may be indicative of a woman’s overall mental health status during the prenatal period and are modifiable risk factors for future breastfeeding interventions.
Methods
Subjects
22
Women between 15 to 20 weeks’ gestation were recruited at their second prenatal clinic visit at University of North Carolina hospitals between January 2001 and June 2005. Women younger than 16, non-English speaking, greater than or equal to 20 weeks’ gestation on their second prenatal visit, not planning to continue care or deliver at the study site, and those carrying multiple gestations were not eligible to participate. Of the 2006 women who were followed through pregnancy, 1169 were eligible for the
postpartum component (PINPost) of the study. To be eligible, they must have delivered live-born infants between October 2002 and December 2005 and have lived within a 2 hour radius of UNC (in order to facilitate home visits). We excluded 239 women: 24 due to medical constraints, 153 were unreachable, 54 were more than 5 months postpartum by the time they were contacted, and 8 for whom study protocols were not in place at the time of their eligibility window. The remaining 930 women were phoned at 6 weeks postpartum with a description of the postpartum component; 688 women consented and were interviewed in their homes by trained staff at approximately 3 months postpartum. Protocols for this study were approved by the University of North Carolina, School of Medicine Institutional Review Board.
Outcome
The dependent variable, breastfeeding initiation, was assessed at 3 months postpartum by the question ―Did you ever breastfeed this baby?‖
23
Pregravid BMI, the main exposure, was calculated from self-reported weight (checked for implausible values) and height measured during screening at 15 to 20 weeks’ gestation. For our analysis, pregravid BMI was dichotomized at 26 kg/m2
based on Institute of Medicine cutpoints in use at the time participants attended prenatal care; women > 26 kg/m2 before pregnancy were identified as overweight or obese and those ≤ 26 kg/m2 as being of normal or underweight BMI (the referent category).90
Psychological variables
Depressive symptoms during pregnancy were assessed using the Center for Epidemiologic Studies-Depression scale (CES-D).91 Participants were given
questionnaires to return by mail at the first and second prenatal visits; 640 (93% of 688) completed the CES-D component of the questionnaire given between 15 to 20 weeks’ gestation and 598 (87% of 688) completed the CES-D given between 24 to 29 weeks’ gestation. The 20-item scale had Likert response categories that assessed the
24
the range still lay between 0 and 60; no differences in results were found. Internal consistency as indicated by Cronbach’s alpha ranged from 0.83 to 0.92.94
The Perceived Stress Scale 95 measured the degree to which respondents found situations to be stressful. 687 women completed the 14-item scale administered over the phone at 17 to 22 gestational weeks, and 652 (94.8%) completed a modified 10-item scale during a phone interview conducted between 27 to 30 gestational weeks. Questions were on a Likert scale, and higher overall scores indicated higher levels of perceived stress. After summing across items for each time period, the variables were categorized into three levels: 0 to < 17 (low stress; referent), 17 to < 23 (moderate), and ≥ 23 (high) for the 14-item scale; 0 to < 11 (low stress; referent), 11 to < 17 (moderate), and ≥ 17 (high) for the 10-item scale. Cronbach’s alpha was 0.83 in three non-pregnant samples tested by Cohen.96
The State-Trait Anxiety Inventory was used to assess state and trait anxiety during pregnancy.97 For this analysis, we used the state anxiety measurement because it
assessed ―immediate‖ feelings of anxiety, which better represented how women felt during pregnancy than the trait-anxiety scale, a stable measure of anxiety. The state-anxiety scale had 20 questions on a 4-point Likert scale. 636 (92.4%) participants completed the mail-in questionnaire given at screening (15 to 20 weeks) while 593 (86.2%) completed the questionnaire provided at the second prenatal visit (24 to 29 weeks). The variables were categorized into three levels: 0 to < 29 (low anxiety;
25
The Self-esteem Scale 98 was completed by 635 women (92.3%) during a phone interview between 15 to 20 gestational weeks. This variable was measured only once because we did not believe self-esteem was likely to change considerably during the course of the pregnancy. Ten questions on a 6-point Likert scale were used to determine the respondent’s sense of self-worth and positive or negative orientation towards oneself. The variables were categorized into three levels that indicated low, moderate and high self-esteem: 0 to < 50, 50 to < 56, and ≥ 56 (referent). Test-retest correlations have been shown to be in the 0.82 to 0.88 range, and Cronbach’s alpha ranged from 0.77 to 0.88.99
Both measurements for the CES-D, perceived stress, and state anxiety were separately assessed as mediators to determine which time point had a greater effect on the pregravid BMI-breastfeeding initiation relationship.
Covariates
26
weight gain during pregnancy, type of delivery (vaginal or cesarean) and whether the infant was hospitalized following delivery.
Statistical methods
Descriptive statistics were generated for the variables of interest. Student’s t test and chi-squared tests were used to examine associations between study variables and breastfeeding initiation. Variables were assessed as both effect measure modifiers and confounders. Modification was tested using a likelihood ratio test to compare models with and without an interaction term between the potential modifier and pregravid BMI (a priori significance criterion of p < 0.15). If variables failed to meet the criteria for modification, they were tested for confounding. Covariates were kept as confounders in the final model if they changed the beta coefficient of the exposure by greater than 10%. Binomial regression produced risk ratios (RR) of the association between pregravid BMI and breastfeeding initiation..
27
psychological factor was tested in separate mediation analyses. All statistical analyses were conducted using Stata software (version 9.2; College Station, TX).
Results
The cohort was comprised primarily of women who were white (76.5%), married (80.4%), an average of 29 years old, had a college degree (65.5%), and were living above the poverty line (61.1%) (Table 1). Most women had a BMI of ≤ 26 kg/m2 before pregnancy (68.1%) and gained above IOM-recommended weight gain guidelines during pregnancy (63.7%). Compared to women who started pregnancy underweight or normal weight, women who started their pregnancy overweight or obese were more likely to be non-white, less educated, unmarried, living below the poverty line, multiparous, and have gained excessively during pregnancy. Of the women who did not breastfeed, most were overweight or obese before pregnancy (72.1%), multiparous (72.6%), did not have a college degree (78.7%), and nearly half lived below the poverty line (47.5%).
Mean scores for depressive symptoms at 15 to 20 weeks and perceived stress at 17 to 22 weeks were significantly higher for those who did not breastfeed compared with those who breastfed (p < 0.05; Table 2). Compared with breastfeeders,
non-breastfeeders had a greater proportion of women in the higher depressive symptoms category at 15 to 20 weeks but not at 24 to 29 weeks gestation (p < 0.01); however, there was no difference in stress, anxiety or self-esteem levels between breastfeeders and non-breastfeeders. Those with a BMI > 26 kg/m2 prior to pregnancy had lower levels of self-esteem and higher levels of depressive symptoms, stress, and anxiety at both
measurement times than those ≤ 26 kg/m2
28
The majority of women who completed both CES-D assessments at 15 to 20 and 24 to 29 weeks gestation (n = 581) remained at a low level of depressive symptoms (72.1%) ; 9.3% increased to high and 6.2% decreased from high to low levels. Of the 652 women who completed both perceived stress measurements, 17.8% increased to a higher stress level during pregnancy while a quarter of women (24.8%) remained at a low level of stress. Almost a third (31.2%) of women who completed both anxiety
measurements (n = 573) decreased to lower levels of anxiety as pregnancy progressed while 14.8% increased. A greater proportion of non-white participants reported higher levels of depressive symptoms, stress, and anxiety at both measurements during
pregnancy (p < 0.05). Proportions of high and low self-esteem were not different between white and non-white participants.
29
We then tested the hypothesis that the pathway between pregravid BMI and breastfeeding initiation was partially mediated by depressive symptoms, stress, anxiety, and self-esteem. Results from crude regression analyses are shown in Table 3,
categorized by psychological factor. Model 1, the crude association between pregravid BMI and breastfeeding initiation, is the same for each psychological factor and is noted as a footnote in Table 3. Perceived stress and state anxiety were not related to
breastfeeding initiation at either of the measured time points and, therefore, did not fit the definition of a mediator variable.102 Self-esteem and depressive symptoms at 15 to 20 weeks (but not 24 to 29 weeks) were significantly related to both pregravid BMI and breastfeeding initiation (Models 2 and 3). In Model 4, depressive symptoms at 15 to 20 weeks slightly reduced the effect of pregravid BMI on breastfeeding initiation (8% change in estimate) and was, thus, considered to be a weak mediator in crude analyses. Self-esteem increased the magnitude of the relationship between the exposure on outcome, possibly acting as a suppressor variable as explained by McKinnon and
colleagues.104 However, the Sobel test found no significant reduction in the effect of the exposure on outcome via any of the hypothesized mediators (data not shown). In addition, once we accounted for race, education, marital status, and poverty status, pregravid BMI no longer predicted the psychological factors. Further, depressive symptoms and self-esteem were not associated with breastfeeding initiation.
Discussion
30
who entered pregnancy overweight or obese were much more likely to not breastfeed compared to normal or underweight women. We further explored whether this
association could be explained in part by psychological factors present during pregnancy. Although we did not find evidence of mediation by depressive symptoms, stress, anxiety and self-esteem during pregnancy, our analysis contributes to the growing body of literature aiming to understand why overweight and obese women are less likely to breastfeed.
There are several possible reasons why we did not find evidence of mediation by the psychological factors. Of the psychological variables tested, only depressive
symptoms at 15 to 20 weeks gestation and self-esteem predicted the outcome,
breastfeeding initiation. The lack of association may be a consequence of the recruitment pool. Out of the 1169 women that were eligible to participate in the postpartum
component, 480 were excluded or refused. We compared these 480 women to the 688 who attended the 3-month visit and found that those who refused to participate or were excluded had significantly higher levels of depressive symptoms and anxiety (data not shown). There was no difference in self-esteem or stress between the two groups. Thus, it is possible that we did not see a mediating effect of psychological factors on the pregravid BMI-breastfeeding initiation relationship because the women who chose to participate in PINPost had better overall mental health status during pregnancy than those who were excluded or refused, reducing the likelihood of finding an association.
31
Although we found that depressive symptoms, perceived stress, anxiety and self-esteem did not mediate the association between pregravid BMI and initiation of
breastfeeding, it was important to explore their role given their potential as targets in breastfeeding interventions. Moreover, this is one of a few studies to examine how psychological factors in pregnancy can influence breastfeeding initiation. Previous studies have focused primarily on the postpartum period and the relationship between psychological factors and breastfeeding duration, excluding women who chose not to breastfeed. However, we wanted to look specifically at the effect of pregravid BMI on breastfeeders versus non-breastfeeders. Our results provide further support for the findings by Fairlie et al.79 that perinatal anxiety levels are not associated with
breastfeeding initiation. We did find that higher levels of depressive symptoms between 15 to 20 weeks’ gestation significantly increased risk of not breastfeeding but this association attenuated and became non-significant after adjusting for confounders. To our knowledge, this is the first quantitative study to examine the effects of stress and self-esteem on breastfeeding initiation.
A further strength of this study includes its prospective cohort study design. This enabled measurement of the exposure and mediators prior to the outcome and, thus, allowed for the assessment of risk. In addition, previous work has failed to examine as many potential modifiers and confounders as comprehensively as we were able to do in the PINpost study.
32
socioeconomic status and received prenatal care limits the generalizability of the findings. Our population is different from the general population of women who give birth in that 91% initiated breastfeeding, which is much higher than the national average of 73.8%.1 We also have a much lower prevalence of overweight/obese women (31.9%) compared to the average for women of childbearing age in the U.S. (59.5%).60
Furthermore, we did not have sufficient power to analyze racial or ethnic differences, although African American women in the U.S. have higher rates of obesity and lower rates of breastfeeding initiation than Caucasian women.1, 40, 105
An additional limitation of this analysis is in the assessment of the outcome variable. Breastfeeding initiation was determined by asking women, ―Did you ever breastfeed this baby?‖ at the 3 month interview and it is possible that participants varied in their interpretation of the question. However, we found similar results when we compared our current definition of breastfeeding initiation to that of initiation defined as breastfeeding for one week or longer. This suggests that we are capturing women who persevered with breastfeeding rather than women who made a brief attempt to breastfeed.
In this paper, we found that prepregnancy obesity negatively influenced
breastfeeding initiation and that higher levels of depressive symptoms, stress, anxiety and lower levels of self-esteem did not alter this adverse association. Studies examining the role of psychological factors should explore the possible mediating role of clinically diagnosed depression and anxiety. It may be that clinical levels of depressive symptoms and anxiety, not diagnosed by the CES-D or the STAI, may be associated with
33
34
Table 1. Maternal characteristics of participants who completed the 3 month postpartum interview in the Pregnancy, Infection and Nutrition study (n = 688).
Breastfeeding initiation Pregravid BMI
Overall n [%] % Breastfed
(n = 626)
% Did not breastfeed (n = 62)
p1 < ≤ 26 kg/m2 > 26 kg/m2 p1 <
Age [mean in yrs] 688 [29.4] 29.7 26.7 0.012 29.7 28.9 0.082
Prepartum BMI
≤ 26 kg/m2 465 [68.1] 72.2 27.9 - -
> 26 kg/m2 218 [31.9] 27.8 72.1 0.01 - -
Race
White 526 [76.5] 78.9 51.6 83.7 61.5
Non-white 162 [23.5] 21.1 48.4 0.01 16.3 38.5 0.01
Education status
High School 118 [17.2] 14.2 47.5 11.9 28.0
Some college 119 [17.3] 16.0 31.2 12.7 27.5
College graduate & beyond 450 [65.5] 69.8 21.3 0.01 75.4 44.5 0.01
Marital Status
married 553 [80.4] 82.6 58.1 87.1 66.5
other (single, divorced, separated,
widowed) 135 [19.6] 17.4 41.9 0.01 12.9 33.5 0.01
Percent of 2001 Poverty Line
<185% 123 [18.5] 15.7 47.5 12.4 31.1
185-350% 136 [20.4] 19.3 32.2 19.3 23.0
≥350% 407 [61.1] 65.1 20.3 0.01 68.4 45.9 0.01
Parity (live births and still births)
nulliparous 334 [48.6] 50.6 27.4 53.8 38.1
1 or more 354 [51.5] 49.4 72.6 0.01 46.2 61.9 0.01
Maternal Smoking
no 600 [87.2] 93.0 82.1 94.4 86.4
35
Gestational weight gain
inadequate 96 [14.1] 13.3 21.3 14.6 12.8
adequate 152 [22.3] 23.0 14.8 29.3 7.3
excessive 435 [63.7] 63.7 63.9 0.12 56.1 79.8 0.01
1
36
Table 2. Maternal psychological characteristics of participants who completed the 3 month postpartum interview in the Pregnancy, Infection and Nutrition study.
Breastfeeding initiation Pregravid BMI
Overall N [%]1
% of those who breastfed
% Did not
breastfeed p BMI ≤ 26 kg/m2 BMI > 26 kg/m2 p
Depressive symptoms at 15
to 20 wks’ gestation 640 10.8 ± 8.6 [91.4]2 14.7 ± 1.6 [8.6] 2 < 0.013 10.2 ± 0.4 [68.4]2
13.2 ± 0.7 [31.6]
2 < 0.013
low level of depressive
symptoms (scores < 17) 516 [80.63] 81.9 67.3 < 0.01
4
83.22 75.12 0.024
high level of depressive
symptoms (scores ≥ 17) 124 [19.38] 18.1 32.7 16.78 24.88
Depressive symptoms at 24
to 29 wks' gestation 598 11.1 ± 8.9 [92.3] 12.7 ± 9.8 [7.7] 0.26 10.6 ± 8.6 [69.7] 12.7 ± 9.7 [30.3] < 0.01
low level of depressive
symptoms (scores < 17) 465 [77.8] 78.4 69.6 80.2 71.7
high level of depressive
symptoms (scores ≥ 17) 133 [22.2] 21.6 30.4 0.16 19.8 28.3 0.02
Perceived stress at 17 to 22
wks’ gestation 687 19.7 ± 7.5 [91.0] 21.7 ± 9.7 [9.0] 0.05 19.1 ± 7.4 [68.2] 21.4 ± 8.2 [31.8] < 0.01
scores 0 to < 17 248 [36.1] 36.2 35.5 0.15 39.6 28.6 0.01
scores 17 to < 23 207 [30.1] 31.0 21.0 29.7 31.3
37
Perceived stress at 27 to 30
wks’ gestation 652 13.2 14.1 0.28 12.8 14.2 < 0.01
scores 0 to < 11 237 [36.3] 36.4 35.7 0.45 38.3 31.7 0.01
scores 11 to <17 237 [36.4] 36.9 30.4 37.6 33.2
scores ≥17 178 [27.3] 26.7 33.9 24.1 35.2
State Anxiety (3-level categorical) at 15 to 20 wks’ gestation
636 34.8 ± 10.3 [91.4] 36.6 ± 11.8 [8.6] 0.22 33.7 ± 10.1[68.4] 37.5 ± 10.9 [31.6] < 0.01
scores 0 to < 29 213 [33.5] 33.6 32.7 0.93 37.7 24.5 < 0.01
scores 29 to <39 218 [34.3] 34.4 32.7 34.5 33.5
scores ≥39 205 [32.2] 32.0 34.6 27.8 42.0
State Anxiety(3-level categorical) at 24 to 29 wks' gestation
593 32.0 ± 10.6 [92.2] 33.6 ± 12.3 [7.8] 0.34 31.6 ± 10.2 [69.8] 33.2 ± 11.8 [30.2] 0.09
scores 0 to < 29 271 [45.7] 45.9 43.5 0.89 46.1 44.9 0.02
scores 29 to <39 184 [31.0] 31.2 30.4 33.5 25.3
scores ≥ 39 138 [23.3] 23.0 26.1 20.4 29.8
Self-esteem (3-level) at 15
to 20 wks’ gestation 635 51.5 ± 7.3 [91.5] 50.2 ± 10.6 [8.5] 0.25 51.9 ±7.4 [68.5] 50.2 ± 8.1 [31.5] 0.01
scores 0 to <50 206 [32.4] 32.0 37 0.18 28.5 40.7 < 0.01
scores 50 to <56 213 [33.5] 34.6 22.2 35.7 29.2
scores ≥ 56 216 [34.0] 33.4 40.7 35.9 30.2
1Not all of the 688 women who completed the 3 month interview completed the assessments for depressive symptoms, stress, anxiety and self-esteem
during pregnancy. 2Mean ± standard deviation; percent of overall N in brackets. 3Student's t-test p-value conducted to compare means of those who breastfed vs. did not breastfeedand those with BMI ≤ 26 kg/m2 vs. BMI > 26 kg/m2 (all such values). 4Pearson's chi-squared test p-value comparing proportions between those who breastfed vs. did not breastfeed and those with BMI ≤ 26 kg/m2
38
Table 3. Unadjusted regression analysis of possible mediation by psychological factors of the association between pregravid BMI and breastfeeding initiation in the Pregnancy, Infection and Nutrition Study1.
Effect of pregravid BMI on mediator (Model 2)2
Effect of mediator on not initiating breastfeeding
(Model 3)
Effect of pregravid BMI on not initiating breastfeeding while controlling for the effect of mediator
(Model 4)
Mediators RR (95% CI) RR (95% CI)3 RR (95% CI)3
Depressive symptoms at 15 to 20 wks
gestation (continuous) 2.78 (1.15, 4.42)
4 1.04 (1.02, 1.06) 5.51 (2.88, 10.57)
Depressive symptoms at 15 to 20 wks
(dichotomous; scores ≥ 17 vs. < 17) 1.48 (1.02, 2.16) 2.40 (1.32, 4.39) 5.63 (2.95, 10.74)
Depressive symptoms at 24 to 29 wks
(continuous) 1.86 (0.24, 3.49)
4 1.02 (0.99, 1.05) 5.88 (3.08, 11.22)
Depressive symptoms at 24 to 29 wks
(dichotomous; scores ≥ 17 vs. < 17) 1.46 (1.04, 2.04) 1.57 (0.83, 2.96) 5.85 (3.06, 11.16)
Perceived stress at 17 to 22 wks (continuous) 2.26 (0.84, 3.68)4 1.04 (1.00,1.07) 5.70 (2.98, 10.92)
Perceived stress at 17 to 22 wks (3-level) 5.97 (3.12, 11.40)
scores 11 to <17 vs. scores < 11 1.50 (0.95, 2.37) 0.84 (0.39, 1.80)
scores ≥17 vs. scores < 11 1.85 (1.18, 2.89) 1.34 (0.69, 2.59)
Perceived stress (continuous) at 27 to 30 wks 1.58 (0.50, 2.66)4 1.04 (0.99, 1.09) 5.80 (3.03, 11.10)
Perceived stress (3-level) 5.86 (3.06, 11.21)
scores 11 to <17 vs. scores < 11 1.13 (0.73, 1.75) 0.95 (0.46, 1.94)
scores ≥17 vs. scores < 11 1.95 (1.23, 3.10) 1.50 (0.75, 3.00)
39
State Anxiety (3-level categorical) 6.10 (3.19, 11.65)
scores 29 to <39 vs. scores < 29 1.35 (0.85, 2.13) 1.11 (0.55, 2.24)
scores ≥39 vs. scores < 29 1.94 (1.23, 3.07) 1.07 (0.52, 2.22)
State Anxiety at 24 to 29 wks (continuous) 1.79 (-0.19, 3.77)4 1.01 (0.99, 1.04) 5.93 (3.11, 11.31)
State Anxiety at 24 to 29 wks (3-level
categorical) 6.15 (3.22, 11.73)
scores 29 to <39 vs. scores < 29 0.71 (0.45, 1.12) 1.09 (0.55, 2.14)
scores ≥39 vs. scores < 29 1.47 (0.94, 2.31) 1.08 (0.52, 2.25)
Self-esteem at 15 to 20 wks (continuous) -1.98 (-3.40, -0.57)4 0.97 (0.94, 1.00) 5.75 (3.01, 10.99)
Self-esteem 15 to 20 wks (3-level
categorical) 6.11 (3.21, 11.63)
scores 0 to <50 vs. scores ≥ 56 1.99 (1.27, 3.13) 1.00 (0.54, 1.87)
scores 50 to <56 vs. scores ≥ 56 1.19 (0.74, 1.89) 0.34 (0.14, 0.82)
1The sample size was restricted to those women who completed all the above-listed questionnaires and for whom we had information on pregravid
BMI (n = 546). 2Restricting the sample size to 546 (see footnote a) resulted in a crude RR of 5.98 (3.14, 11.38) for the association between pregravid BMI and breastfeeding initiation; this was considered Model 1. 3Models 3 and 4 used binomial regression analysis to determine risk ratios (RR) unless otherwise stated; breastfeeding initiation was the dependent variable (not initiating breastfeeding was the index category).
40
Figure 3. Relationship between pregravid BMI, breastfeeding initiation, psychological factors and covariates.
Demographic factors (age, race, marital status,
education, parity)
)
Health Indicators (smoking, weight gain during pregnancy, type of
delivery, infant hospitalized after birth)
Work/school status Economic factors
(income)
c
Pregravid BMI
Breastfeeding initiation b
a
CHAPTER V
MATERNAL OBESITY, PSYCHOLOGICAL FACTORS, AND BREASTFEEDING DURATION: IS THERE A LINK?
Introduction
The American Academy of Pediatrics (AAP) promotes exclusive breastfeeding as the ideal method of meeting the nutrient needs of infants for the first six months of life followed by partial breastfeeding up to at least one year of age.10, 11 However, in the U.S., adherence to these recommendations is low. Three-quarters of women initiate breastfeeding but by six and twelve months postpartum, the prevalence of any
breastfeeding is 43.4% and 22.7%, respectively.1 Further, although exclusive
breastfeeding is recommended, only 33.1% of US women exclusively breastfeed for the first three months postpartum; by six months of age, the prevalence decreases to 13.6%.1 Low breastfeeding rates may be explained, in part, by the rise in obesity among women of childbearing age. Women with higher pre-pregnancy body mass index (BMI) are less likely to initiate breastfeeding and more likely to breastfeed for a shorter duration.4-7 Women who start pregnancy overweight and obese may face more biological, physical, psychosocial and psychological barriers to breastfeeding than women of lower BMI.9, 62
42
possible psychological pathway. In this study, we explore whether depressive symptoms, perceived stress and anxiety during pregnancy explain part of the association between pregravid BMI and breastfeeding duration. There is some evidence to support the hypothesis of a mediatory pathway. Previous studies have shown that obesity may increase risk of poor mental health status in the perinatal period 68, 71 and, in turn, psychological factors have been associated with breastfeeding duration.51, 74, 76, 106, 107 One epidemiologic study examined the influence of psychological and psychosocial factors on pregravid BMI and breastfeeding duration; Hilson and colleagues 25 adjusted for several psychosocial factors such as maternal confidence in breastfeeding, social support, and body satisfaction and found that they attenuated but did not eliminate the significant association between prepregnant BMI and breastfeeding duration. They also found no association with the onset of lactogenesis. To our knowledge, this is the first study to examine whether psychological factors such as depressive symptoms, perceived stress and anxiety help explain the association between pregravid BMI and breastfeeding duration.
We used data from the Pregnancy, Infection and Nutrition study to examine whether women who started pregnancy overweight or obese were more likely to
43
Methods
The Pregnancy, Infection and Nutrition study is a prospective cohort study following women from pregnancy to the postpartum period.89, 108 Women between 15 to 20 gestational weeks attending their second prenatal visit at University of North Carolina (UNC) hospitals were recruited between January 2001 and June 2005 (N = 3203). Women younger than 16, non-English speaking, greater than or equal to 20 weeks’ gestation on their second prenatal visit, not planning to continue care or deliver at the study site and those carrying multiple gestations were not eligible to participate. During pregnancy, 2006 women were interviewed in the clinic and by phone at 15 to 20 weeks’ gestation, 17 to 22 weeks, 24 to 29 weeks, 27 to 30 weeks, and in the hospital.
44
breastfeeding cessation for those women who were still breastfeeding at the 12 month interview. Protocols for the prenatal and postpartum studies as well as this analysis were approved by the UNC School of Medicine Institutional Review Board.
The outcome variable for this study was breastfeeding duration, the length of time a child was breastfed. The breastfeeding duration variable was created using data
collected at 3, 12 and 36 months postpartum. To establish initiation, women were asked ―Did you ever breastfeed this baby?‖ at 3 months postpartum. Those who initiated were then asked at the 3 month interview and again at the 12 and 36 month interviews, ―Are you still breastfeeding your baby?‖ If women reported having stopped breastfeeding at either interview, they were asked how old the infant was when they stopped (reported in days/weeks/months). For the purposes of this study, any breastfeeding included
exclusive breastfeeding as well as mixed feeding with formula or complementary foods. We categorized duration of any breastfeeding as follows: none, those who breastfed less than 4 months, 4 to 6 months, 7 to 12 months, and more than 12 months (referent).
Exclusive breastfeeding included infants fed only breast milk with the exception of drops or syrups consisting of vitamins, mineral supplements or medicines.27 Exclusive breastfeeding duration was determined by comparing duration with the age of
45
guidelines; the AAP recommends that women should exclusively breastfeed for up to 6 months but they also state that complementary foods may be introduced as early as 4 months based on the ―unique needs or feeding behaviors of the individual infants.‖11
The main exposure variable was pregravid BMI which was calculated by dividing self-reported pregravid weight by height measured during either a prenatal clinic visit between 15 to 20 weeks gestation or at the 3 month postpartum visit. Weight was checked for implausible values and 3 participants were excluded from analysis, leaving 547 women with complete information on breastfeeding duration and pregravid BMI. Pregravid BMI was categorized according to World Health Organization ranges for underweight (< 18.5), normal weight (18.5 to 24.9), and overweight/obese (≥ 25.0).109
Possible mediators
Depressive symptoms, perceived stress, and state anxiety were measured at two time points in pregnancy. This analysis used the second measure which was closer in time to the outcome of interest, breastfeeding duration. Measurements of depressive symptoms, perceived stress, and state anxiety for both time points were reasonably well-correlated (correlation coefficients = 0.66, 0.68, and 0.56, respectively).
46
calculated and scores greater than or equal to 17 indicated the presence of a higher level of depressive symptoms. Although a cutpoint of 16 or higher has been associated with a significant level of depressive symptoms in the general population, we used a slightly higher cutpoint to distinguish between depressive and pregnancy symptoms, which are often similar.92 We compared our method of a higher cutpoint with that proposed by Hoffman and Hatch93 in which they used 16 as a cutpoint after removing items that overlapped with pregnancy and rescaling scores so that the range still lay between 0 and 60. There was no difference in how women were categorized between the two methods (data not shown). Internal consistency as indicated by Cronbach’s alpha ranged from 0.83 to 0.92.94
The Perceived Stress Scale95 measured the degree to which respondents found situations to be stressful. Of 550 participants, 527 (95.8% of 550) completed a modified 10-item scale administered during a phone interview conducted between 27 to 30
gestational weeks. Questions were on a Likert scale, and higher overall scores indicated higher levels of perceived stress. After summing across items, the variable was
categorized into three levels: 0 to < 11 (referent), 11 to < 17, and ≥ 17. Cronbach’s alpha was 0.83 in three non-pregnant samples tested by Cohen.96
The State-Trait Anxiety Inventory was used to assess state and trait anxiety during pregnancy.97 For this analysis, we used the state anxiety measurement because it
47
visit (24 to 29 weeks). Scores from 20 questions on a 4-point Likert scale were summed and categorized into three levels: 0 to < 29 (referent), 29 to < 39, and ≥ 39. Cronbach’s alpha ranged from 0.90 to 0.94 for the state scale.97
Covariates
Covariates tested for confounding in this analysis were chosen based on a directed acyclic graph, created from a review of the literature 100, and on the strength of their relationship with exposure and outcome. Data were collected at screening (15 to 20 weeks’ gestation) and through self-reported questionnaires, telephone interviews and medical chart abstraction. Participants reported their race, age, parity, family income, household size, education, marital status, and smoking status in the first six months of pregnancy. Information on family income and household size was used to create a variable representing percent of the 2001 poverty index according to the U.S. Bureau of the Census.101
Statistical Analyses
The analysis of pregravid BMI and duration of any breastfeeding was restricted to participants for whom we had complete information on pregravid BMI (n = 547); the model for pregravid BMI and duration of exclusive breastfeeding was limited to those who initiated breastfeeding (n = 509). Multinomial logit models were utilized to
48
and given an estimate of the effect of pregravid BMI on the odds of breastfeeding longer versus shorter duration/not initiating. However, the proportional odds assumption was violated for the majority of our explanatory variables. Furthermore, the multinomial logit model is easily interpretable and enabled us to compare back to a referent category based on current guidelines as well as to calculate separate effect estimates for each category of the outcome variables. The latter was especially important for duration of any
breastfeeding in which the lowest duration category of ―none‖ was comprised of non-breastfeeders. Combining any level of breastfeeding with non-breastfeeders would have provided an incorrect estimate of the association between pregravid BMI and
breastfeeding duration because not all risk factors are the same for women who choose not to initiate breastfeeding and those who do initiate. Due to low power, we could not analyze effect measure modification. Backward elimination was used to build our adjusted model and covariates were kept as confounders in the model if they changed the beta coefficients of the exposure categories by greater than 10%.
49
and the effect estimate of the exposure fully or partially reduces while adjusting for the mediator (Model 4). Model 3 was added to determine the relationship between the potential mediator and breastfeeding duration when pregravid BMI was not accounted for because there is little research on this, specifically in regards to stress and anxiety. Each psychological factor was tested in separate mediation analyses. All statistical analyses were conducted using Stata software (version 9.2; College Station, TX).
Results
The majority of participants initiated breastfeeding (92.6% of 550 women). Duration of any breastfeeding ranged from 0 to 38.6 months with a median duration of 7.9 months. Prevalence at 3 and 6 months was 67.5% and 56.7 %, respectively. Women who did not initiate or who breastfed less than 4 months had a higher prevalence of pregravid obesity and overweight, respectively, while women who breastfed 4 months or longer were more likely to be in the normal weight category (Table 4). Compared to normal weight women, those who entered pregnancy overweight or obese were more likely to breastfeed for a shorter duration and introduce complementary foods earlier (p < 0.01; Table 4).
50
married (94.3%), of higher income (mean = 492.3% ± 186.0 of the poverty line) and have more years of education completed (mean = 17.1 ± 2.1 years).
Women with low levels of depressive symptoms, stress and anxiety tended to be white, married, better educated, and of higher income. They were also more likely to enter pregnancy at a normal weight and to breastfeed (any or exclusively) longer than women with high levels of these factors (Table 5).
Crude multinomial regression showed a strong negative association between prepregnancy weight status and duration of any breastfeeding (Table 6 and Appendix – Tables 9 to 11, Model 1). After adjusting for race, education, marital status and smoking in the first 6 months of pregnancy, being underweight was no longer associated with duration of any breastfeeding and the effect estimate for overweight/obese was attenuated. However, overweight/obese women remained at higher risk of not
breastfeeding [5.77 (2.45, 13.55)] and of breastfeeding less than 4 months [2.44 (1.36, 4.38)] compared to normal weight women.
51
To ease in the interpretation of all the coefficients from the multiple equations estimated in the multinomial logit models, we used the model coefficients to predict the probability of being in each breastfeeding duration group, for each weight status group (underweight, normal weight, overweight/obese), holding all other variables in the model constant. Predicted probabilities are shown in Figures 4 and 5. Compared with normal weight women, overweight/obese women had significantly higher predicted probabilities for not initiating breastfeeding and for breastfeeding less than 4 months but lower
predicted probabilities for breastfeeding 4 months or longer (Figure 4; t test p < 0.01 for all comparisons). Compared to normal weight women, overweight and obese women had a significantly higher predicted probability of exclusively breastfeeding less than 1 month and a lower probability of exclusively breastfeeding 1 to < 4 months and ≥ 4months (t test p < 0.01 for all comparisons; Figure 5).
Mediation
52
based on the crude results, the psychological factors were not significantly associated with any breastfeeding duration in the adjusted models.
When examining mediation of pregravid BMI-exclusive breastfeeding, once again, higher levels of all three psychological factors were predicted by pregravid BMI (Model 2, Appendix – Tables 12 to 14). The presence of high depressive symptoms and anxiety during pregnancy was associated with exclusive breastfeeding duration of less than 1 month and 1 to < 4 months; high stress predicted exclusive breastfeeding less than 1 month (Model 3, Appendix – Tables 12 to 14). Only depressive symptoms and stress remained associated with the outcome when pregravid BMI was in the model (Model 4) but they accounted for only a small part of the association between pregravid BMI and duration of exclusive breastfeeding (i.e. < 10%). However, adjusting for race, education, and poverty status greatly attenuated, and made non-significant, the association between depressive symptoms/stress and exclusive breastfeeding. The association between pregravid BMI and psychological factors also disappeared which was expected based on the mediation results for duration of any breastfeeding.
Discussion