Research article
Available online
www.ijsrr.org
ISSN: 2279–0543International Journal of Scientific Research and Reviews
Optimization of Multiple Response Characteristics on EDM Using the
Taguchi Method and Grey Relational Analysis
V.Chittaranjan Das* and C.Srinivas
*Department of Mechanical Engineering, R.V.R. & J.C.College of Engg; Guntur-19, AP, India
ABSTRACT
In this paper a new approach for the optimization of the electrical discharge machining (EDM) process with multiple performance characteristics based on the orthogonal array with the grey relational analysis has been studied on Ti–6Al–4V alloy. A grey relational grade obtained from the grey relational analysis is used to solve the EDM process with the multiple performance characteristics. Optimal machining parameters can then be determined by the grey relational grade as the performance index. In this study, the machining parameters using discharge current, gap voltage, pulse-on time and duty cycle as typical process parameters are optimized with considerations of multiple performance characteristics including material removal rate, electrode wear rate and surface roughness.The optimized process parameters simultaneously leading to a lower electrode wear ratio, higher material removal rate and better surface roughness are then verified through a confirmation experiment. Analysis of variance was used to study the significance of process variables on grey relational grade which showed discharge current, duty cycle, pulse-on time and gap voltage have been found to be the order of significant parameters. Confirmation experiment has been carried out at optimum set of parameters and predicted results have been found to be in good agreement with experimental findings. Experimental results have shown that machining performance in the EDM process can be improved effectively through this approach.
KEYWORDS:-
Electrical discharge machining; Orthogonal array; Grey relational analysisCorresponding Author:
V.Chittaranjan Das
Professor, Department of Mechanical Engineering,
1.
INTRODUCTION
The Taguchi method 1, 2 is a systematic application of design and analysis of experiments for the
purpose of designing and improving product quality. In recent years, the Taguchi method 3 as become a
powerful tool for improving productivity during research and development so that high quality products
can be produced quickly and at low cost However, the original Taguchi method has been designed to
optimize a single performance characteristic. For the electrical discharge machining (EDM) process,
material removal rate is a higher-the-better performance characteristic. However, surface roughness and
electrode wear ratio are a lower-the-better performance characteristic. As a result, an improvement of
one performance characteristic may require a degradation of another performance characteristic. Hence,
optimization of the multiple performance characteristics is much more complicated than optimization of
a single performance characteristic. In this paper, the orthogonal array with the grey relational analysis 4
is used to investigate the multiple performance characteristics in the EDM process.
Having exception properties, such as high strength–weight ratio, high temperature stability and
outstanding corrosion resistance, Ti–6Al–4V alloy is widely used in the aerospace, automobile,
chemical and biomedical fields. However, poor machinability using the traditional mechanical cutting
process results in high tooling costs. Therefore, non traditional machining methods, such as electrical
discharge machining (EDM) have been explored to machine this alloy. EDM is an energy-based
technique extensively used in machining hard, high-strength and temperature-resistant materials in a
contactless manner. The material is melted and vaporized by an erosion spark between the electrode and
workpiece. Recently, Fonda et al. 8 used EDM technology to machine Ti–6Al–4V alloy to examine the
effect of thermal and electrical properties on the productivity.
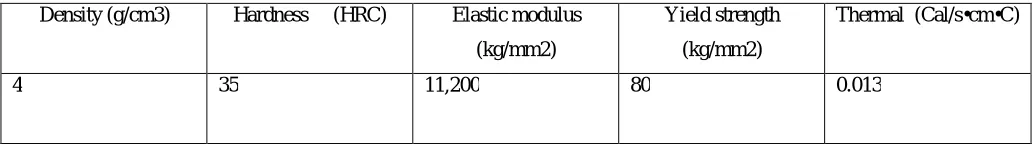
Table 1 Material properties of the Ti–6Al–4V alloy
Density (g/cm3) Hardness (HRC) Elastic modulus
(kg/mm2)
Yield strength
(kg/mm2)
Thermal (Cal/s•cm•C)
Chen et al. 9 noted a higher material removal rate (MRR) and lower electrode wear ratio (EWR)
using distilled water as the dielectric compared to using kerosene. Ahmet et al. explored the influence of
EDM parameters on the surface integrity of Ti–6Al–4V alloy with different electrode materials 10.The
researchers found outcomes concerning the optimization of process parameters in EDM of Ti–6Al–4V
alloy have rarely been reported up to now 11 Lin et al. examined the effects of attached magnetic forceon
EDM and optimised the machining parameters of the magnetic-force-assisted EDM by the Taguchi
method 12 .On the other hand, grey relational analysis can be recommended as a method for optimizing
the complicated inter-relationships among multiple performance characteristics 13,14. In this paper, the
optimization of parameters considering multiple performance characteristics of the EDM process to Ti–
6Al–4Valloy using the Taguchi method and grey relational analysis is reported. Performance
characteristics including electrode wear ratio, material removal rate and surface roughness are chosen to
evaluate the machining effects. Those process parameters that are closely correlated with the selected
performance characteristics in this study are the discharge current, open voltage, pulse duration and duty
factor.
Table 2 Machining parameters and their levels
Symbol Control factors Unit Level 1 Level 2 Level 3
A Discharge current A 5 10 20
B Open voltage V 100 150 200
C Pulse duration μs 100 200 400
D Duty factor (%) 25 50 75
The duty factor is defined as the discharge ON time divided by the sum of the discharge ON and OFF
times. Experiments based on the appropriate orthogonal array are conducted first. The normalized
experimental results of the performance characteristics are then introduced to calculate the coefficient
and grades according to grey relational analysis. Optimized process parameters simultaneously leading
to lower electrode wear ratio, higher material removal rate and better surface roughness will then be
verified through a confirmation experiment. The details of the procedures are addressed in the following
2.
EXPERIMENTAL PROCEDURE
2.1 Machining parameters selection
A series of experiments were performed on an Electrical Discharge Machine Electronica 4025
equipped with an iso-frequent pulse generator. The electrolytic copper of diameter 10 mm was used as
an electrode. Commercial-grade kerosene was used as the dielectric fluid and the side injection of
dielectric fluid was adopted. A jet flushing system was employed to assure adequate flushing of the
debris from the gap zone.A pure cylindrical copper rod 10 mm in diameter was used as the electrode the
workpiece of Ti–6Al–4V alloy (20×20×5mm) in this study. The material properties of the alloy is
shown in Table 1.
In this study, there are several machining parameters to be considered in the EDM process. As a result, a
preliminary experiment for determining the optimal process parameters indicates the machining
parameters such as discharge current, open voltage, pulse duration and duty factor have a clear effect on
the EDM performance of Ti–6Al–4V alloy.Table 2 shows they have discharge current with levels of 5,
10 and 20 amp; open voltage with levels of 100, 150 and 200 V; pulse duration with levels of 100, 200
and 400 μsand duty factor with levels of 25%, 50% and 75%. Moreover, some researchers have shown
that positive electrode polarity gives a much higher material removal rate, lower electrode depletion and
better surface roughness 15,16. Therefore, the experiments used a positive polarity electrode. Besides,
kerosene was used as the dielectric fluid in all experiments.
2.2 Machining performance evaluations
The machining performance evaluated based on the response variables namely MRR,TWR and
surface roughness. The MRR and TWR was calculated based on the weight difference of the workpiece
and tool before and after undergoing the EDM process. A high-precision electronic weighing balance
Electric Balance, Model: AX 200, Capacity: Max: 200 gms, Readability: 0.1mg, Make: Shimadzu
Corporation, Japan was used for this purpose. The surface roughness measurement was then carried out
using a Talysurf 10, Rank Taylor Hobson. A traverse length of 5 mm with a cut-off evaluation length of
0.8 mm was selected. The centre line average value of the surface roughness (Ra) is the most widely
used surface roughness parameter in industry is selected in this study. For the efficient evaluation of the
EDM process, the MRR, TWR and the surface roughness are regarded as "larger-the-better" and
2.3 Selection of orthogonal array
The orthogonal array with the grey relational analysis is used to determine the optimal machining
parameters with considerations of the multiple-performance characteristics. To select an appropriate
orthogonal array, total degrees of freedom need to be computed. The degrees of freedom are the number
of comparisons to be made between design parameters. For example, a three-level design parameter
counts for two degrees of freedom. Therefore, in the present work, total degrees of freedom are 9, 8
owing to four parameters with three levels and one for overall mean17. Basically, degrees of freedom for
an orthogonal array should be greater than or at least equal to number of design parameters. Each
parameter was assigned to each column of the orthogonal array. Therefore, only nine experiments were
required to study the entire parameter space using L9 orthogonal array. Normally, the full-factorial
design would require (34= 81) experimental runs. However, the effort and experimental cost for such a
design could be prohibitive and unrealistic. In the present study, nine experimental runs based on the L9
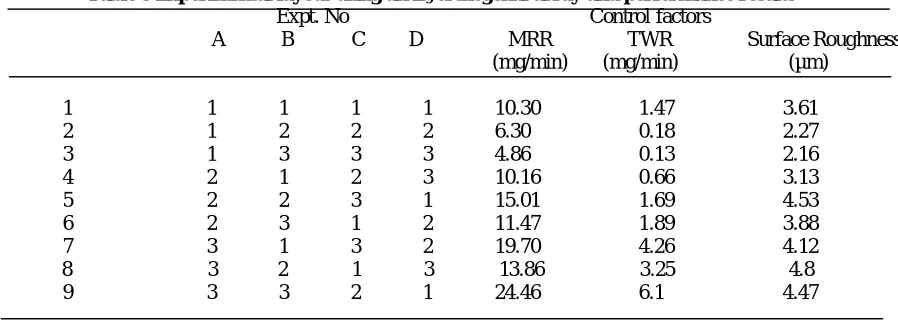
orthogonal array with four columns and nine rows is used and is presented in Table 3. The working time
for each experiment was 15 minutes and each experiment was repeated three times with the average
being taken.
3.
GREY RELATIONAL ANALYSES OF THE EXPERIMENTAL DATA
The Taguchi method is a systematic application of design and analysis of experiments to
improve product quality. In recent years, the Taguchi method has become a powerful tool for improving
productivity during research and development also. Most Taguchi experiments are concerned with the
optimisation of a single quality characteristic.
Table 3 Experimental layout using an L9 orthogonal array and performance results Expt. No Control factors
A B C D MRR TWR Surface Roughness (mg/min) (mg/min) (µm)
1 1 1 1 1 10.30 1.47 3.61
2 1 2 2 2 6.30 0.18 2.27
3 1 3 3 3 4.86 0.13 2.16
4 2 1 2 3 10.16 0.66 3.13
5 2 2 3 1 15.01 1.69 4.53
6 2 3 1 2 11.47 1.89 3.88
7 3 1 3 2 19.70 4.26 4.12
8 3 2 1 3 13.86 3.25 4.8
Antony 18 attempted simultaneous optimisation of multiple quality characteristics in manufacturing
processes using Taguchi’s quality loss function. The use of Taguchi method with the grey relational
analysis can greatly simplify the optimization of process parameters for multiple-performance
characteristics19 .In grey relational analysis, grey relational coefficient for different process
characteristics is calculated and average of these coefficients is called grey relational grade which is
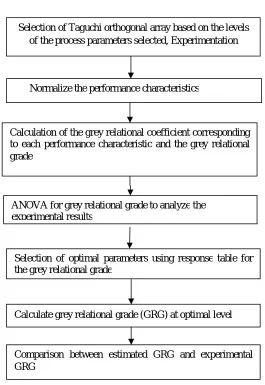
used as a single response for the Taguchi’s experimental plan, and same is illustrated in Fig. 2.
Therefore, in the present work, grey relational analysis based on the Taguchi method’s response table
has been used to optimise EDM of Ti–6Al–4V alloy for multiple responses namely MRR ,TWR and
surface roughness.
3.1 Data pre-processing
In grey relational analysis, data pre-processing is required since the range and unit in one data
sequence may differ from the others. Data pre-processing is also necessary when the sequence scatter
range is too large, or when the directions of the target in the sequence are different. Data pre-processing
is a process of transferring the original sequence to a comparable sequence. For this purpose, the
experimental results are normalised in the range between zero and one. Depending on the characteristics
of data sequence, there are various methodologies of data pre-processing available for the grey relational
analysis 20.
Where and are the sequence after the data preprocessingand comparability sequence
respectively, k=1 for MRR; i=1,2,3....9 for experiments 1to 9.
The tool wear rate and surface roughness is also one of the important measures of EDM
performance. Selection of optimum process parameters of Ti–6Al–4V alloy is at the development stage
and their effects on surface roughness have yet to be clarified. To obtain optimal cutting performance,
Fig. 2 Grey relational analysis to optimize the process with multiple performance characteristics
When the “smaller-the-better” is a characteristic of the original sequence, then the original
sequence should be normalised as follows:
Where and are the sequence after the data preprocessing and comparability sequence
respectively, k=2 for TWR, surface roughness: i=1,2,3....9 for experiments 1 to 9 [20].All the sequences
after data pre-processing using Eqs. 1 and 2 are listed in Table 4.
Normalize the performance characteristics
Calculation of the grey relational coefficient corresponding to each performance characteristic and the grey relational grade
ANOVA for grey relational grade to analyze the experimental results
Selection of optimal parameters using response table for the grey relational grade
Calculate grey relational grade (GRG) at optimal level
Comparison between estimated GRG and experimental GRG
Table 4 Sequences of each performance characteristic after data processing
Expt.No MRR TWR Surface roughness
Reference Sequence 1.0000 1.0000 1.0000
1 0.2774 0.7755 0.4519
2 0.0732 0.9910 0.9582
3 0.0000 1.0000 1.0000
4 0.2700 0.9101 0.6316
5 0.5178 0.7375 0.1025
6 0.3370 0.7046 0.3481
7 0.7569 0.3070 0.2582
8 0.4591 0.4762 0.0000
9 1.0000 0.0000 0.1240
Now, (k) is the deviation sequence of the reference and the comparability sequence , i.e.
(k) (3)
The deviation sequence Δ01 can be calculated using Eq. 3 as follows;
(1) =
(2) =
(3) =
So = ( )
Similar calculation was performed for i=1 to 9 and the results of all Δoi for i=1–9 are listed in Table
5.Investigating the data presented in Table 5, Δmax(k) and Δmin (k) are obtained and are follows
(1) = (2) = (3) = 1.00 (1) = (2) = (3) = 0.00
Table 5 The deviation Sequences
Deviation Sequences (1) (2) (3)
Expt.no.1 0.7226 0.2244 0.5481
Expt.no.2 0.9267 0.0089 0.0417 Expt.no.3 1.0000 0.0000 0.0000 Expt.no.4 0.7299 0.0898 0.3683
Expt.no.5 0.4821 0.2624 0.8974
Expt.no.6 0.6629 0.2953 0.6519
Expt.no.7 0.2430 0.6929 0.7417
Expt.no.8 0.5408 0.5237 1.0000
3.2 Computing the grey relational coefficient and the grey relational grade
After data pre-processing is carried out, a grey relational coefficient can be calculated with the pre-processed sequence. It expresses the relationship between the ideal and actual normalised experimental results. The grey relational coefficient is defined as follows 20
Where Δ0i (k) is the deviation sequence of the reference sequence and the comparability sequence
is distinguishing or identification coefficient. If all the parameters are given equal preference,
is taken as 0.5. The grey relational coefficient for each experiment of the L9 orthogonal array can be
calculated using Eq. 4 and same is presented in Table 6.After obtaining the grey relational coefficient,
the grey relational grade is computed by averaging the grey relational coefficient corresponding to each
performance characteristic. The overall evaluation of the multiple performance characteristics is based
on the grey relational grade, that is:
Where γi is the grey relational grade for the ith experiment and n is the number of performance
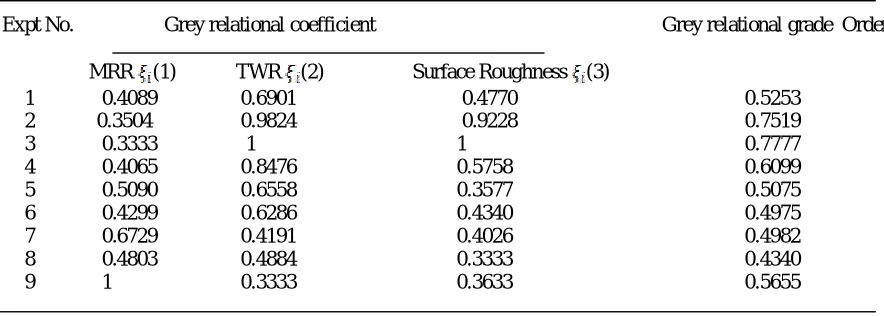
characteristics. Table 6 shows the grey relational grade for each experiment using L9 orthogonal array.
The higher grey relational grade represents that the corresponding experimental result is closer to the
ideally normalized value. Experiment 3 has the best multiple-performance characteristics among nine
experiments because it has the highest grey relational grade as shown in Table 6. It can be seen that in
the present study optimisation of the complicated multiple-performance characteristics of EDM of Ti–
6Al–4V alloy has been converted into optimisation of a grey relational grade.
Table 6 Grey relational coefficient and grey relational grade
Expt No. Grey relational coefficient Grey relational grade Order
MRR (1) TWR (2) Surface Roughness (3)
1 0.4089 0.6901 0.4770 0.5253
2 0.3504 0.9824 0.9228 0.7519
3 0.3333 1 1 0.7777
4 0.4065 0.8476 0.5758 0.6099
5 0.5090 0.6558 0.3577 0.5075
6 0.4299 0.6286 0.4340 0.4975
7 0.6729 0.4191 0.4026 0.4982
8 0.4803 0.4884 0.3333 0.4340
Since the experimental design is orthogonal, it is then possible to separate out the effect of each machining parameter on the grey relational grade at different levels. For example, the mean of the grey relational grade for the discharge current at levels 1, 2 and 3 can be calculated by averaging the grey relational grade for the experiments 1 to 3, 4 to 6 and 7 to 9, respectively (Table 7).The mean of the grey relational grade for each level of the other machining parameters, namely, pulse-on time, duty cycle and gap voltage can be computed in the same manner. The mean of the grey relational grade for each level of the machining parameters is summarized and shown in the multi response performance index Table 7.
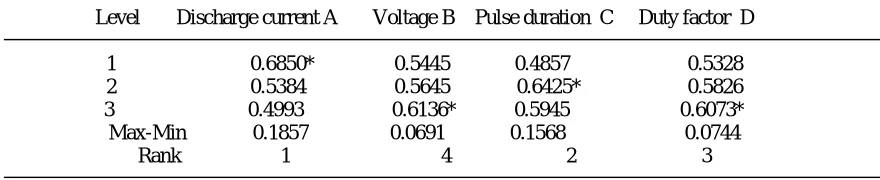
Table 7 Response table for Grey relational grade.
Level Discharge current A Voltage B Pulse duration C Duty factor D
1 0.6850* 0.5445 0.4857 0.5328 2 0.5384 0.5645 0.6425* 0.5826
3 0.4993 0.6136* 0.5945 0.6073*
Max-Min 0.1857 0.0691 0.1568 0.0744 Rank 1 4 2 3
* Levels for optimum grey relational grade, Total mean value of the grey relational grade=0.5742
In addition, the total mean of the grey relational grade for the nine experiments is also calculated
and listed in Table 7. Figure 3 shows the grey relational grade obtained for different process parameters.
The mean of grey relational grade for each parameter is shown by horizontal line. Basically, the larger
the grey relation grade is, the closer will be the product quality to the ideal value. Thus, larger grey
relational grade is desired for optimum performance. Therefore, the optimal parameters setting for better
MRR and improved surface quality is (A1B3C2D3) as given in Table 7. Optimal level of the process
parameters is the level with the highest grey relational grade. Furthermore, ANOVA has been performed
on grey relational grade to obtain contribution of each process parameter affecting the two process
characteristics jointly and is discussed in the forthcoming section.Experiment 3 shows the highest grey
relational grade, indicating the optimal process parameter set of A1B3C3D3 has the best multiple
performance characteristics among the nine experiments. The mean value of the grey relational grade for
each EDM process parameter level is summarised in Table 11 and shown in Fig. 4. It shows the
predicted optimal process parameter set is A1B3C2D3 based on the grey relational analysis.
4.
ANALYSIS OF VARIANCE
ANOVA is a standard statistical technique to interpret the experimental results. It is extensively
is to investigate the parameters, whose combination to total variation is significant. In ANOVA, the total
sum of squares deviations (SST) is calculated by21 .
Fig.3 Effect of EDM parameters on the multi-performance characteristics
where m is the overall mean S/N ratio.
The total sum of squared deviations, SST, is divided into two sources
where, SSJ is the sum of squared deviations for each design parameter and is given by
where npis the number of significant parameters and l is the number of levels of each parameter. SSe is
the sum of squared error without or with pooled factor, which is the sum of squares corresponding to the insignificant factors. Mean square of a factor (MSj) or error (MSe) is found by dividing its sum of
A3 A2 A1 0.70 0.65 0.60 0.55 0.50 B3 B2 B1 C3 C2 C1 0.70 0.65 0.60 0.55 0.50 D3 D2 D1 Discharge Current(A) G re y re la ti o n a l g ra d e Voltage (V)
squares with its degrees of freedom. Percentage contribution (ρ) of each of the design parameters is
given by following equation [18].
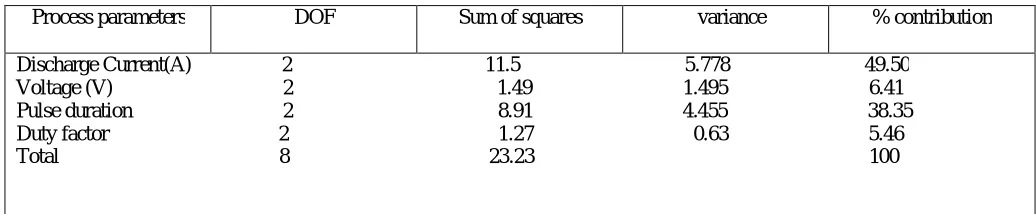
Table 7 ANOVA results for the Grey relational grade
Process parameters DOF Sum of squares variance % contribution
Discharge Current(A) 2 11.5 5.778 49.50 Voltage (V) 2 1.49 1.495 6.41 Pulse duration 2 8.91 4.455 38.35 Duty factor 2 1.27 0.63 5.46 Total 8 23.23 100
Table 7 lists the grey relational grade based on the results of ANOVA analysis. It shows that the
discharge current is the significant control factor affecting multiple performance characteristics with
nearly 49.5% of contribution ratio and the pulse duration has 38.35% contribution.
4.1 Confirmation tests
Confirmation test has been carried out to verify the improvement of performance characteristics while
EDM of Al2O3–SiCw–TiC ceramic composite. Optimum parameters are selected for the confirmation
test as given in Table 7. The estimated grey relational grade using the optimal level of the machining
parameters can be calculated using following equation.
Where γm is the total mean of the grey relational grade, is the mean of the grey relational grade at the
optimal level and q is the number of the machining parameters that significantly affects
multiple-performance characteristics. The obtained process parameters, which give higher grey relational grade,
are presented in Table 8. The predicted MRR, surface roughness and grey relational grade for the
optimal machining parameters are obtained using Eq. 10 and also presented in Table 8. Table 8 also
shows the comparison of experimentally obtained MRR and surface roughness of a trial which gives
optimum EDM process parameters. It can be seen that the overall performance of EDM process has
been improved.
5.
CONCLUSION
An application of the Taguchi method and grey relational analysis to improve the multiple performance
characteristics of the electrode wear ratio, material removal rate and surface roughness in the electrical
discharge machining of Ti–6Al–4V alloy has been reported in this paper. As a result, this method greatly
simplifies the optimization of complicated multiple performance characteristics. The optimal process
parameters based on grey
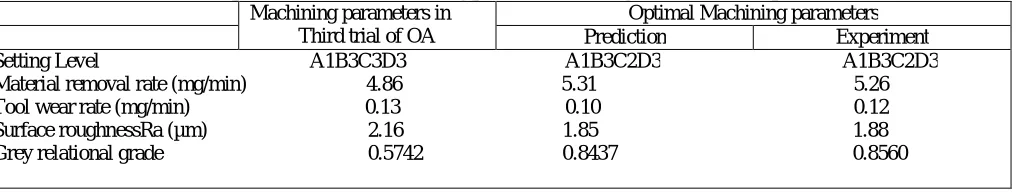
Table 8Comparison between machining performance using the initial and optimal level
Machining parameters in Third trial of OA
Optimal Machining parameters
Prediction Experiment
Setting Level A1B3C3D3 A1B3C2D3 A1B3C2D3 Material removal rate (mg/min) 4.86 5.31 5.26 Tool wear rate (mg/min) 0.13 0.10 0.12 Surface roughnessRa (µm) 2.16 1.85 1.88 Grey relational grade 0.5742 0.8437 0.8560
relational analysis for the EDM of Ti–6Al–4V alloy include 5 amp discharge current, 200 V open
voltage, 200 μs pulse duration and 75% duty factor. The machining performance of the electrode wear
ratio decrease from 0.13 to 0.10mg/min, the material removal rate increases from 4.86 to 5.31 mg/min
and the surface roughness decreases from 2.16 to 1.85μm, respectively.
To conclude, as per the findings, GRA, an advanced statistical method of multi-factorial analysis,
embodies rich philosophical thought of the unity of opposites, such as continuity and discontinuity,
quality and quantity, staticsand dynamics, etc. Empirical research on high-tech industries and systems
are often constrained, since traditionalstatistical methods require large sets of data. On the other hand,
grey system theory is designed to work with system where the available information is insufficient to
characterise the system.
6.
REFERENCES
3. Bendell A, Disney J and Pridmore WA, Taguchi Methods: Applications in World Industry, IFS,
UK, 1989.
4. Logothetis N and Haigh A, Characterizing and optimizing multi response processes by the
Taguchi method, Quality and Reliability Engineering International, 1988; 4: 159–169.
5. Deng J, Control problems of grey systems, Systems and Control Letters, 1982; 5: 288–294.
6. Tan X, Yang Y and Deng J, Grey relational analysis factors in hypertensive with cardiac
insufficiency, Journal of Grey System, 1998;10 (1): 75–80.
7. Zhu F, Yi M, Ma L and Du J, The grey relational analysis of the dielectric constant and others,
Journal of Grey System, 1996; 8 (3): 287–290.
8. Fonda P, Wang ZG, Yamazaki K and Akutsu Y, A fundamental study on Ti-6Al-4V’s thermal
and electrical properties and their relation to EDM productivity. J Mater Process Technol, 2008;
202: 583–589
9. Chen SL, Yan BH and Huang FY, Influence of kerosene and distilled water as dielectrics on the
electric discharge machining characteristics of Ti-6A1–4V. J Mater Process Technol, 1999; 87:
107–111
1. 10 Ahmet H, Electrical discharge machining of titanium alloy (Ti-6Al-4V). Appl Surf Science
2007; 253: 9007–9016
10.Krishna Mohana Rao G, Rangajanardhaa G, Hanumantha Rao D, Sreenivasa Rao M
Development of hybrid model and optimization of surface roughness in electric discharge
machining using artificial neural networks and genetic algorithm. J Mater Process Technol,
2009; 209(3): 1512–1520
11.Lin YC, Chen YF, Wang DA, Lee HS Optimization of machining parameters in magnetic force
assisted EDM based on Taguchi method. J Mater Process Technol, 2009; 209(7): 3374–3383
12.Chiang KT, Chang FP Optimization of the WEDM process of particle-reinforced material with
multiple performance characteristics using grey relational analysis. J Mater Process Technol,
2006; 180: 96–101
13.Lin JL and Lin CL, The use of the orthogonal array with grey relational analysis to optimize the
electrical discharge machining process with multiple performance characteristics. Inter J Mach
14.Liu YH, Li XP, Ji RJ, Yu LL, Zhang HF and Li QY Effect of technological parameter on the
process performance for electric discharge milling of insulating Al2O3 ceramic. J Mater Process
Technol 2008; 208, 245–250
15.Yan BH, Huang FY, Chow HM, Tsai JY Micro-hole machining of carbide by electric discharge
machining. J Mater Process Technol, 1999; 87:137–145
16.Bagchi TP Taguchi methods explained. Prentice-Hall, New Delhi,1993
17.Antony J, Simultaneous optimization of multiple quality characteristics in manufacturing
processes using Taguchi’s quality loss function. Int J of Advanced Mfg Technol , 2001; 17:134
18.Deng J, Control problems of grey systems. System and Control Letters 1982; 5:288
19.Caydas U and Hascalık A, Use of the grey relational analysis to determine optimum laser cutting