R E S E A R C H A R T I C L E
Open Access
Pain score, desire for pain treatment and
effect on pain satisfaction in the
emergency department: a prospective,
observational study
Judith E. van Zanden
1*, Susanne Wagenaar
1, Jozine M. ter Maaten
2, Jan C. ter Maaten
1and Jack J. M. Ligtenberg
1Abstract
Background:Pain management in the Emergency Department has often been described as inadequate, despite proven benefits of pain treatment protocols. The aim of this study was to investigate the effectiveness of our current pain protocol on pain score and patient satisfaction whilst taking the patients’wishes for analgesia into account.
Methods:We conducted a 10-day prospective observational study in the Emergency Department. Demographics, pain characteristics, Numeric Rating Scale pain scores and the desire for analgesics were noted upon arrival at the Emergency Department. A second Numeric Rating Scale pain score and the level of patient satisfaction were noted 75–90 min after receiving analgesics. Student T-tests, Mann-Whitney U tests and Kruskall-Wallis tests were used to compare outcomes between patients desiring vs. not desiring analgesics or patients receiving vs. not receiving analgesics. Univariate and multivariate logistic regression models were used to investigate associations between potential predictors and outcomes.
Results:In this study 334 patients in pain were enrolled, of which 43.7% desired analgesics. Initial pain score was the only significant predictive factor for desiring analgesia, and differed between patients desiring (7.01) and not desiring analgesics (5.14). Patients receiving analgesics (52.1%) had a greater decrease in pain score than patients who did not receive analgesics (2.41 vs. 0.94). Within the group that did not receive analgesics there was no difference in satisfaction score between patients desiring and not desiring analgesics (7.48 vs. 7.54). Patients receiving analgesics expressed a higher satisfaction score than patients not receiving analgesics (8.10 vs. 7.53). Conclusions:This study pointed out that more than half of the patients in pain entering the Emergency
Department did not desire analgesics. In patients receiving analgesics, our pain protocol has shown to adequately treat pain, leading to a higher satisfaction for emergency health-care at discharge. This study emphasizes the importance of questioning pain score and desire for analgesics to prevent incorrect conclusions of inadequate pain management, as described in previous studies.
Keywords:Pain management, Emergency department, Oligoanalgesia, Pain satisfaction, Numeric rating scale
* Correspondence:j.e.van.zanden@umcg.nl
1Department of Emergency Medicine, University of Groningen, University Medical Center Groningen, Groningen, The Netherlands
Full list of author information is available at the end of the article
Background
As pain is a common complaint of patients visiting the Emergency Department (ED) [1], its early recognition and appropriate treatment is important. Experience of pain is one of the criteria on which quality of care in the ED is reviewed and a key factor in preventing uninten-tional, avoidable harm.
Since Marks and Sachar published a landmark paper about undertreatment of pain in the ED [2], this became a frequently investigated subject. The benefits of pain treatment protocols have been proven [3], yet pain man-agement in the ED has often been described as inad-equate [1, 4, 5]. This raises the question whether undertreatment of pain is caused by inadequate adher-ence to pain protocols, or, that ‘oligoanalgesia’ – a term to describe the phenomenon of undertreatment of pain – is overstated, as Green postulated in the Annals of Emergency Medicine [6]. Another question is whether pain should always be treated, given the fact that not all patients in pain desire analgesics [7, 8]. To our know-ledge, a prospective study on the effects of protocolized pain treatment on pain score and patient satisfaction, while taking desire for analgesics into account, has not been previously published.
The main goal of our study was to prospectively inves-tigate the effectiveness of our current pain protocol on pain score and patient satisfaction in our ED; the desire for analgesia by the patient is hereby taken into account. ‘Effectiveness’ of pain treatment was defined as a de-crease in pain score and inde-creased level of satisfaction with care. A pain score reduction of > 2 Numeric Rating
Scale (NRS) was considered clinically relevant [9, 10]. Secondary goals were to evaluate arguments for refusing analgesics and reasons for not receiving analgesics, des-pite patients’ expressed desire for pain relief. We hy-pothesized that patients receiving analgesics would have a stronger decrease in pain score and a higher score of patient satisfaction compared to patients who did not re-ceive analgesics.
Methods
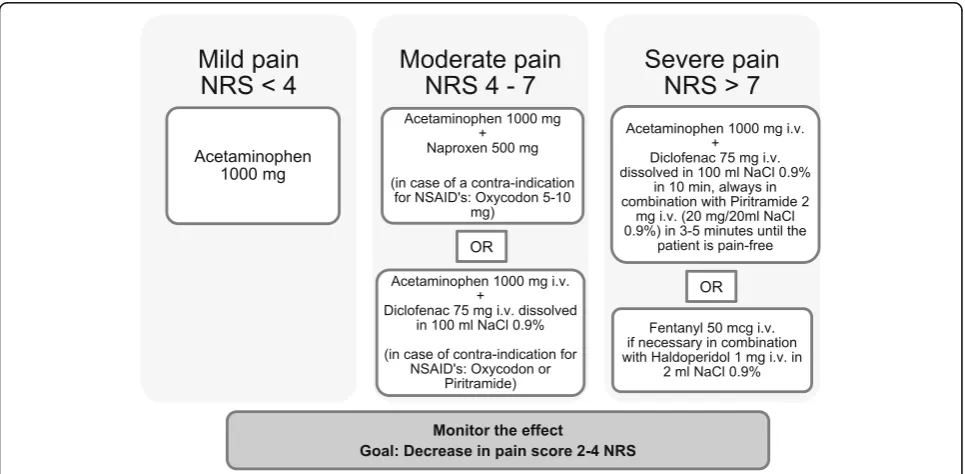
This study had a prospective, observational design and was conducted at the ED of the University Medical Cen-ter Groningen (UMCG). The ED of this Cen-tertiary teaching hospital has an annual volume of approximately 32.000 patients, of which around 22.000 are estimated to be non-trauma patients. At the onset of the study, an anal-gesic protocol was present in the ED (Fig. 1). Data was obtained by study personnel filling out a comprehensive questionnaire for patients > 18 years old visiting the ED. This study was approved by the institutional review board of the UMCG. All patients signed the informed consent to participate in this study.
All patients with complaints of recent pain (< 3 months) were questioned. Exclusion criteria were pa-tients < 18 years, no recent pain (< 3 months), papa-tients in a life-threatening situation, patients with impaired mental status or neuropsychiatric diseases leading to in-ability to fill in the questionnaire (e.g. patients suffering from delirium, dementia or psychosis), a language bar-rier or absence of informed consent.
We used a manual questionnaire for a continuous period of 10 days, 24 h a day, to collect data for every patient visiting the ED.
During their stay, all patients were questioned twice. Immediately after triage of the patient, data was col-lected on demographics (age, sex), triage colour code (Table 1), allergy for analgesics, medical specialty of re-ferral, pain characteristics (location, duration, type and character of pain) and pain score at that time, using the Numeric Rating Scale, ranging from 0 (no pain) to 10 (worst pain the patient can imagine). We checked whether the patient had already received analgesics be-fore arriving at the hospital, e.g. self-medication or anal-gesics given by the general physician or ambulance staff. Furthermore, we asked whether the patient desired pain management. In case there was no desire for analgesics, the patient was asked about the reason. The second part of the questionnaire was filled in 75–90 min after taking the initial questionnaire. First, we checked if the patient had received analgesics in the ED and the type and dose of analgesics given. An analgesic was defined as any drug prescribed with the aim to reduce pain, such as acet-aminophen, nonsteroidal anti-inflammatory drugs (NSAID) and opioids, as described in the analgesic lad-der of the World Health Organization (WHO) [11]. Be-sides that, in accordance with previous articles published on this subject, drugs having a possible indirect effect on pain level were also included. Those were nitroglycerin for chest pain, proton pump inhibitors (PPI) for abdom-inal pain and benzodiazepines [7, 8]. If the patient did not receive any analgesics but had previously indicated a desire to receive analgesics, we asked the patient and the nurse why analgesics were not administered. The patient was asked again to rate pain severity on the Numeric Rating Scale. Lastly, the patient was asked to express their satisfaction on how their entire pain management was executed, rated on a Numeric Rating Scale, ranging from 0 (very dissatisfied) to 10 (very satisfied).
Primary outcomes were change in pain score and pa-tient satisfaction score. Secondary outcomes were rea-sons to refuse analgesics and identifying why patients did not receive analgesics, despite desire for pain relief.
After completion of the study, all blinded question-naires were manually entered in SPSS and checked by two investigators.
Statistical analysis
Binominal and categorical data are presented as frequen-cies of occurrence and percentages. Continuous variables are presented as means and standard deviations (SD). The student T-test or Mann-Whitney U test was used to compare means between patients desiring vs. not desir-ing analgesics or patients receivdesir-ing vs. not receivdesir-ing an-algesics. To compare between multiple groups, the Kruskall-Wallis test was used, followed by post hoc Mann-Whitney U tests.P-values were described to dem-onstrate differences between groups, with p< 0.05 con-sidered significant.
To investigate associations between potential predic-tors and outcomes, logistic regressions were conducted. Factors that showed to be significant in univariate logis-tic regressions were included in a multivariate logislogis-tic regression model. Associations are presented by odds ra-tios (OR) and confidence intervals (CI). P-values of < 0.05 were again considered significant. All analyses were performed using IBM SPSS Statistics version 22.
Results
The total number of patients that visited the ED during the 10 days of inclusion was 797 (Fig. 2). Of those, 199 patients had no recent pain. Furthermore, 93 patients were excluded for being < 18 years old, 12 patients were excluded for being in a life-threatening situation, 28 pa-tients had an altered mental status or neuropsychiatric disease, in 13 patients a language barrier was present, 14 patients did not give informed consent and 1 patient could not be questioned due to a too high infection risk. In addition, 14 patients were excluded because they par-ticipated earlier in the study, 74 patients were discharged before completing the questionnaire and 15 patients were not questioned because of organizational issues. In total, 463 patients were excluded from the study.
Characteristics of study subjects
The total number of patients included during the 10-day study was 334. The mean age was 49 years and 53% were male. The overall mean initial pain score was 5.96 NRS (SD 2.28). Half of the patients had already taken analge-sics before entering the ED (50.9%) and 5.1% of the pa-tients indicated to have an allergy for an analgesic. Patient and pain characteristics are outlined in Table2.
Effect of pain protocol on pain score
Of the 334 enrolled patients, 146 (43.7%) patients de-sired analgesics upon arrival at the ED. Initial pain scores were higher in patients with a desire for Table 1Triage colour code, as used in the University Medical
Center Groningen
Urgency Name Colour Maximum waiting
time
1 Immediately Red 0 min
2 Highly urgent Orange 10 min
3 Urgent Yellow 60 min
4 Standard Green 120 min
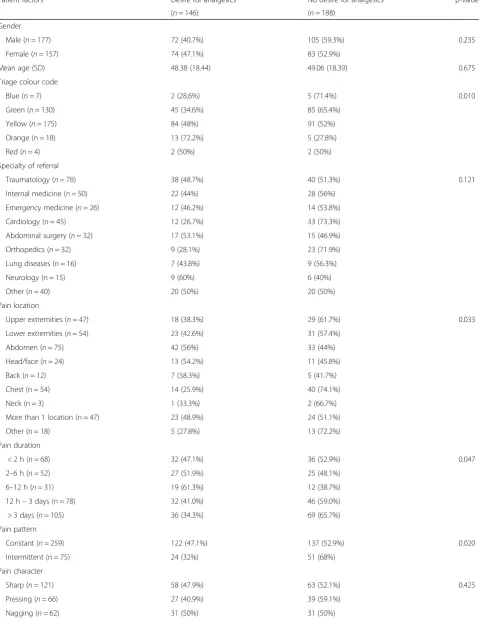
analgesics compared to patients who did not wish anal-gesics (NRS score 7.01 [95% CI 6.70–7.33] vs. NRS score 5.14 [95% CI 4.82–5.45], Table 2). Desire for analgesics did not depend on factors such as gender, age, specialty of referral, pain character, pre-ED analgesics or known analgesic allergy. The variables triage colour code, pain location, pain duration and pain pattern (constant or intermittent pain) showed significant differences be-tween the two groups (Table 2). Patients assigned to a group with a more urgent colour code were more likely to desire analgesics and patients with chest pain were less likely to desire analgesics. The duration of pain showed a trend towards medium pain duration (6–12 h) and a desire for analgesics. Patients suffering from con-stant pain were more likely to desire analgesics com-pared to patients experiencing intermittent pain (OR 1.89 [95% CI 1.10–3.26]).
The factors triage colour code, pain location, pain pattern and mean initial pain score were univariately significantly associated with the desire for analgesics and were the eligible factors for the multivariate model. In multivariate analysis, only the initial pain score was a significant predictive factor for desiring analgesia (Table 3).
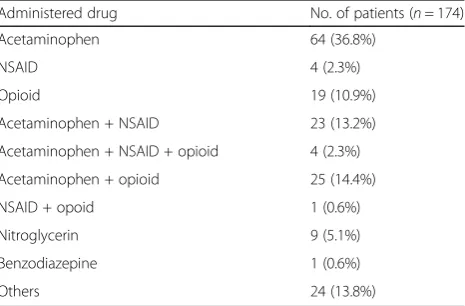
Of all the patients in pain, 174 patients (52.1%) re-ceived analgesics. The most commonly prescribed anal-gesics were acetaminophen (50.2%), NSAID’s (13.9%) and opioids (21.2%) (Table4).
The number of patients receiving analgesics was greater than the number of patients who initially desired analgesics (174 vs. 146 patients). Of the 188 patients that
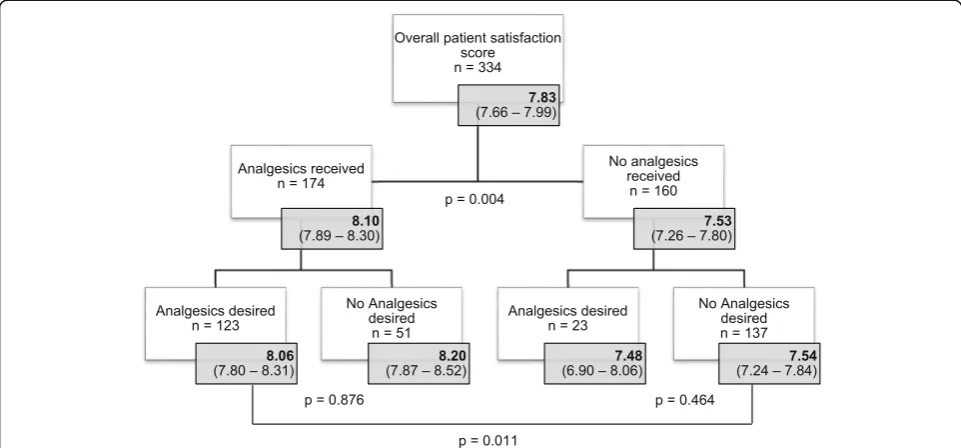
initially refused analgesics, 51 patients had required and received analgesics at the time of the second question-naire. Of the patients initially desiring analgesics, 23 pa-tients did not receive them (Fig. 2). In order to accurately present the results, those two groups were temporarily excluded. In total, 260 patients (123 patients that desired and received analgesics and 137 patients that refused and did not receive analgesics) were in-cluded in the following analyses. Patients who received analgesics during their stay in the ED had significantly higher initial pain scores than those who did not receive analgesics (NRS score 7.09 [95% CI 6.76–7.42] vs. NRS score 4.82 [95% CI 4.46–5.19]). Pain scores measured 75–90 min after arrival decreased significantly in pa-tients who received analgesics, with a reduction of 2.41 NRS (95% CI 2.02–2.79). The pain score of patients who received analgesics decreased more than patients who did not receive analgesics; the group of patients not re-ceiving analgesics showed a reduction in pain score of 0.94 NRS ([95% CI 0.62–1.25], Table5).
Effect of the pain protocol on patient satisfaction
Overall, all patients included in this study expressed a relatively high satisfaction of 7.83 (95% CI 7.66–7.99) for pain management. The majority of patients (67.1%) was satisfied (patient satisfaction score be-tween 6 and 8 NRS), and 25.7% of the patients were even highly satisfied (patient satisfaction score 9–10). Only 7.2% of all patients included were dissatisfied (patient satisfaction score < 6 NRS).
Table 2Patient and pain characteristics with subdivision in desire for analgesics
Patient factors Desire for analgesics No desire for analgesics p-value
(n= 146) (n= 188)
Gender
Male (n= 177) 72 (40.7%) 105 (59.3%) 0.235
Female (n= 157) 74 (47.1%) 83 (52.9%)
Mean age (SD) 48.38 (18.44) 49.06 (18.39) 0.675
Triage colour code
Blue (n= 7) 2 (28.6%) 5 (71.4%) 0.010
Green (n= 130) 45 (34.6%) 85 (65.4%)
Yellow (n= 175) 84 (48%) 91 (52%)
Orange (n = 18) 13 (72.2%) 5 (27.8%)
Red (n= 4) 2 (50%) 2 (50%)
Specialty of referral
Traumatology (n= 78) 38 (48.7%) 40 (51.3%) 0.121
Internal medicine (n= 50) 22 (44%) 28 (56%)
Emergency medicine (n= 26) 12 (46.2%) 14 (53.8%)
Cardiology (n= 45) 12 (26.7%) 33 (73.3%)
Abdominal surgery (n= 32) 17 (53.1%) 15 (46.9%)
Orthopedics (n= 32) 9 (28.1%) 23 (71.9%)
Lung diseases (n= 16) 7 (43.8%) 9 (56.3%)
Neurology (n = 15) 9 (60%) 6 (40%)
Other (n= 40) 20 (50%) 20 (50%)
Pain location
Upper extremities (n= 47) 18 (38.3%) 29 (61.7%) 0.033
Lower extremities (n= 54) 23 (42.6%) 31 (57.4%)
Abdomen (n= 75) 42 (56%) 33 (44%)
Head/face (n= 24) 13 (54.2%) 11 (45.8%)
Back (n= 12) 7 (58.3%) 5 (41.7%)
Chest (n = 54) 14 (25.9%) 40 (74.1%)
Neck (n = 3) 1 (33.3%) 2 (66.7%)
More than 1 location (n = 47) 23 (48.9%) 24 (51.1%)
Other (n = 18) 5 (27.8%) 13 (72.2%)
Pain duration
< 2 h (n= 68) 32 (47.1%) 36 (52.9%) 0.047
2–6 h (n= 52) 27 (51.9%) 25 (48.1%)
6–12 h (n= 31) 19 (61.3%) 12 (38.7%)
12 h–3 days (n = 78) 32 (41.0%) 46 (59.0%)
> 3 days (n= 105) 36 (34.3%) 69 (65.7%)
Pain pattern
Constant (n= 259) 122 (47.1%) 137 (52.9%) 0.020
Intermittent (n = 75) 24 (32%) 51 (68%)
Pain character
Sharp (n= 121) 58 (47.9%) 63 (52.1%) 0.425
Pressing (n= 66) 27 (40.9%) 39 (59.1%)
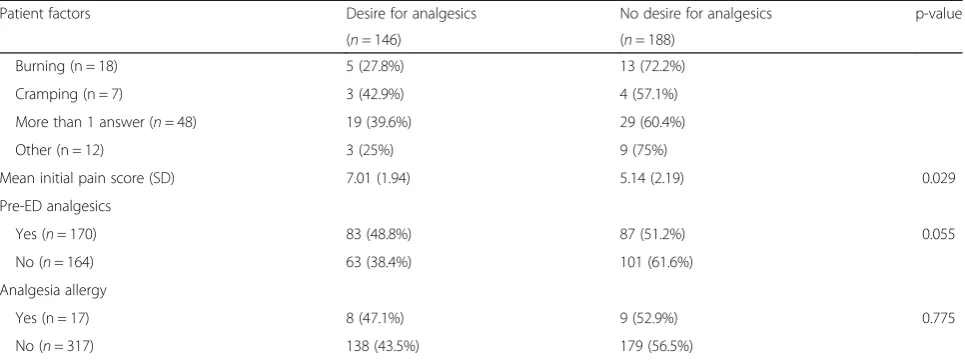
After only analyzing patients who received analgesics in compliance with their initial wish, results show that patients receiving analgesics were significantly more sat-isfied than patients who did not receive analgesics (satis-faction score 8.06 [95% CI 7.80–8.31 vs. 7.54 [95% CI 7.24–7.84]).
Reasons for refusing analgesics
The most common reason for not wanting analgesics, even though in pain, was bearable pain (57.4%), want-ing to know the diagnosis first (10%) and uswant-ing anal-gesics before visiting the ED (8%).
Reasons for not receiving analgesics and the effect on patient satisfaction levels
As stated before, not all patients received analgesia ac-cording to their initial wish. Of the 146 patients desiring pain management, 23 patients did not receive analgesics. After performing subgroup analyses on patient satisfac-tion scores, results show that within the group that did not receive analgesics, patients who initially desired an-algesics were not more dissatisfied than patients that did not desire analgesics (mean patient satisfaction score 7.48 [95% CI 6.90–8.06] vs. 7.54 [96% CI 7.24–7.84], Fig.3). This result is important in investigating whether analgesics were incorrectly withheld from patients. In this cohort, the main reasons for not receiving analgesics included receiving an alternative non-pharmacological pain treatment such as splinting or applying ice or heat (31%), crowding in the ED (13%) and the clinical judge-ment of the nurse (13%). After correction for non-pharmacological pain treatment, 6.6% of the 334 pa-tients in pain did not receive analgesics or a
non-pharmacological pain treatment, despite their expressed desire.
Discussion
Pain management is an important criterion of quality of care given in the ED and its adequacy has therefore been often discussed in literature.
According to our initial hypothesis, our study shows that the pain score in patients who received analgesics decreased more than in patients who did not receive an-algesics. Patients who received analgesics were also sig-nificantly more satisfied than patients who did not receive analgesics. Those differences are in our study un-likely to be attributed to ‘undertreatment of pain’in pa-tients that did not receive analgesics. An important question in investigating‘undertreatment of pain’or‘ oli-goanalgesia’ is whether all patients in pain desire anal-gesia. Previous research shows that nearly half of the patients in pain decline analgesia, which is in agreement with our results [7,8]: of all the patients entering the ED in pain, less than half desired analgesics in our study. In those patients, ‘bearable pain’ was the most common reason for refusing analgesics. More urgent cases, medium pain duration of 6–12 h and constant pain were factors more associated with desiring analgesics, describ-ing possible reasons why and when analgesics are desired.
Of patients that did not receive analgesics, the major-ity (86%) did not desire analgesics. Also, there was no difference in satisfaction between those patients and pa-tients that did not receive analgesics despite their wish, suggesting that analgesics were not incorrectly withheld from patients. According to Allione et al., almost 10% of the patients do not receive analgesics despite their expressed desire [8], however, the reason for this was
Table 2Patient and pain characteristics with subdivision in desire for analgesics(Continued)
Patient factors Desire for analgesics No desire for analgesics p-value
(n= 146) (n= 188)
Burning (n = 18) 5 (27.8%) 13 (72.2%)
Cramping (n = 7) 3 (42.9%) 4 (57.1%)
More than 1 answer (n= 48) 19 (39.6%) 29 (60.4%)
Other (n = 12) 3 (25%) 9 (75%)
Mean initial pain score (SD) 7.01 (1.94) 5.14 (2.19) 0.029
Pre-ED analgesics
Yes (n= 170) 83 (48.8%) 87 (51.2%) 0.055
No (n= 164) 63 (38.4%) 101 (61.6%)
Analgesia allergy
Yes (n = 17) 8 (47.1%) 9 (52.9%) 0.775
No (n= 317) 138 (43.5%) 179 (56.5%)
Table 3Factors associated with a desire for analgesics (univariate and multivariate analysis)
Univariate analysis Multivariate analysis
Variable OR (95% CI) p-value OR (95% CI) p-value
Gender 0.236
Male Reference
Female 1.30 (0,84–2.01)
Age 0.10 (0.99–1.01) 0.737
Triage colour code 0.021 0.139
Blue 0.40 (0.03–5.15) 1.23 (0.07–0.76)
Green 0.53 (0.72–3.89) 1.65 (0.19–4.61)
Yellow 0.92 (0.13–6.70) 2.98 (0.34–5.83)
Orange 2.60 (0.28–3.81) 6.05 (0.54–8.08)
Red Reference Reference
Specialty of referral 0.14
Traumatology Reference
Internal medicine 0,83 (0.41–1.69)
Emergency medicine 0.90 (0.37–2.20)
Cardiology 0.38 (0.17–0.85)
Abdominal surgery 1.19 (0.52–2.72)
Orthopedics 0.41 (0.17–1.00)
Lung diseases 0.82 (0.28–2.42)
Neurology 1.58 (0.51–4.86)
Other 1.05 (0.49–2.26)
Pain location 0.040 0.078
Upper extremities Reference Reference
Lower extremities 1.20 (0.54–2.66) 1.29 (0.53–3.09)
Abdomen 2.05 (0.97–4.32) 1.68 (0.74–3.79)
Head/face 1.90 (0.70–5.15) 2.94 (0.97–8.93)
Back 2.26 (0.62–8.19) 1.99 (0.48–8.21)
Chest 0.56 (0.24–1.31) 0.68 (0.27–1.70)
Neck 0.81 (0.07–9.54) 0.45 (0.03–6.67)
More than 1 location 1.54 (0.68–3.51) 2.29 (0.92–5.71)
Other 0.62 (0.19–2.03) 0.62 (0.17–2.21)
Pain duration 0.051
< 2 h 1.70 (0.91–3.18)
2–6 h 2.07 (1.05–4.07)
6–12 h 3.04 (1.33–6.94)
12 h–3 days 1.33 (0.73–2.44)
> 3 days Reference
Pain pattern 0.021 0.314
Constant 1.89 (1.10–3.26) 1.38 (0.74–2.58)
Intermittent Reference Reference
Pain character 0.447
Sharp Reference
Pressing 0.75 (0.41–1.38)
not described. Our study showed that receiving a non-pharmacological pain treatment was the most common reason for not receiving analgesics. After correcting for non-pharmacological pain treatment, only 6.6% of the patients did not receive analgesia or a non-pharmacological pain treatment despite their expressed desire for pain relief. Not correcting for the patients’ wish for analgesia might lead to low rates of analgesic administration and thus to incorrect conclu-sions with regard to inadequate pain management, reporting undertreatment percentages ranging from 20 to 50% as described before in literature [12].
Nevertheless, it has to be mentioned that despite the statistically significant differences, one might wonder if a difference of 0.52 in patient satisfaction score is clinically relevant. Previous studies have investigated the associ-ation between pain scores and patient satisfaction and stated that pain relief on itself is not the only factor af-fecting patient satisfaction [13, 14]. McNeill et al. showed a negative correlation between pain scores and patient satisfaction [15], while Svensson et al. showed a
high patient satisfaction score despite high pain scores [16]. Phillips et al. concluded from their study that pa-tient satisfaction should be addressed as an independent variable in assessing pain management [12].
Another important limitation of many earlier studies on ‘oligoanalgesia’ is their retrospective nature. Since pain perception is a subjective phenomenon, the pres-ence or severity of pain should be determined by asking the patient at the moment of pain itself. Estimating the pain score, without asking the patient or asking the pa-tient in retrospective, will not reliably reveal the real se-verity of pain [17]. Also, the number of patients receiving analgesics has more often been investigated, but rarely the actual effects of analgesics on lowering the pain score. A review of literature on oligoanalgesia stated that inconsistency and inadequacy of pain man-agement is caused by multiple reasons including a lack of education in pain management, inadequate manage-ment programs to evaluate pain managemanage-ment, the clini-cians’ attitude towards opioids and disbelief of pain reporting [18]. A generally accepted pain protocol is therefore important, providing guidelines aiming to pre-vent an inconsistency in pain treatment. Our study showed an overall pain reduction of 2.17 NRS in the group of patients treated with analgesia according to our pain protocol. Since a pain reduction of > 2 NRS is con-sidered clinically relevant [9,10], the current pain proto-col can be considered adequate.
Limitations of the study
Measuring severity of pain among ED patients can be challenging since pain perception is considered a sub-jective phenomenon. A retrospective way of investigating pain management will not provide a reliable picture [17]. However, a prospective way also has its limitations. The questionnaires were filled in by researchers questioning the patient. Some patients may have been inclined to
Table 3Factors associated with a desire for analgesics (univariate and multivariate analysis)(Continued)
Univariate analysis Multivariate analysis
Burning 0.42 (0.14–1.24)
Cramping 0.82 (0.18–3.80)
More than 1 answer 0.71 (0.36–1.40)
Other 0.36 (0.08–1.40)
Mean initial pain score 1.54 (1.36–1.74) 0.000 1.56 (1.37–1.77) 0.000
Pre-ED analgesics 0.056
No Reference
Yes 1.53 (0.99–2.36)
Analgesia allergy 0.775
No Reference
Yes 1.15 (0.43–3.07)
Table 4Overview of prescribed types of analgesics
Administered drug No. of patients (n= 174)
Acetaminophen 64 (36.8%)
NSAID 4 (2.3%)
Opioid 19 (10.9%)
Acetaminophen + NSAID 23 (13.2%)
Acetaminophen + NSAID + opioid 4 (2.3%)
Acetaminophen + opioid 25 (14.4%)
NSAID + opoid 1 (0.6%)
Nitroglycerin 9 (5.1%)
Benzodiazepine 1 (0.6%)
provide responses based on an expectation of a cor-rect response; thus skewing data. Secondly, the study was conducted under optimal circumstances of a working pain protocol. The presence of the re-searchers in the work field might have induced a ‘Hawthorne effect’, reminding nurses to pay more at-tention to pain management. Some patients expressed their desire for analgesics only to the researcher. In this case, the nurses were informed for ethical rea-sons. Further research will focus on the adherence to the pain management protocol under ordinary work-ing circumstances and overcrowdwork-ing.
An important challenge in investigating patient satis-faction on pain management was the subgroup of pa-tients where no analgesics were given. For that reason, all patients were asked to rate the overall management routine regarding pain treatment in the Emergency De-partment, and not only the effect of the therapeutics it-self. Nevertheless, it is possible that less attention was given to patients who initially did not desire analgesics, possibly causing the differences in satisfaction scores be-tween the two groups. Patient satisfaction score was expressed as one overall grade in our questionnaire. Thus, specific reasons for expression of (dis)satisfaction
regarding e.g. waiting time and communication, were not investigated.
This study is limited to a single, tertiary university hospital in Groningen, the north of the Netherlands. ED’s of all Dutch hospitals adhere to the same guidelines for pain management [19]. Therefore, pain protocols used in other Dutch hospitals can be considered as com-parable. However, e.g. patient demographics can differ between ED’s. Our results should therefore not be gener-alized to other, dissimilar settings.
Conclusions
In summary, our results show that less than half of the patients in pain entering the ED desire analgesics. Pa-tients receiving analgesics were adequately treated ac-cording to the pain protocol, showing a clinically relevant reduction in pain score and higher satisfaction scores at discharge compared to patients who did not re-ceive analgesics. Patients who did not rere-ceive analgesics despite their expressed wish were not incorrectly with-held from pain treatment, since satisfaction scores were comparable to patients who did not desire and did not receive analgesics. Additionally, most of the patients who did not receive pain medication despite desiring Table 5Reduction in pain score in patients receiving analgesics vs. patients not receiving analgesics
Analgesics received (n= 123) No analgesics received (n= 137) p-value
Initial pain score (95% CI) 7.09 (6.76–7.42) 4.82 (4.46–5.19) 0.00
Pain score after 75–90 min (95% CI) 4.68 (4.23–5.14) 3.89 (3.46–4.32) 0.013
ΔPain score (95% CI) 2.41 (2.02–2.79) 0.94 (0.62–1.25) 0.00
analgesics, received a non-pharmacological pain treat-ment. This study demonstrates that in this ED setting with a pain protocol in use, pain is adequately treated, and emphasizes the importance of taking the patients’ wish for analgesia into account when investigating ‘ oli-goanalgesia’in the ED.
Abbreviations
CI:Confidence Interval; ED: Emergency Department; NRS: Numeric Rating Scale; NSAID: Nonsteroidal Anti-Inflammatory Drugs; OR: Odds Ratio; PPI: Proton pump inhibitor; SD: Standard Deviation; UMCG: University Medical Center Groningen; WHO: World Health Organization
Acknowledgements
The authors are very grateful to all doctors and nurses from the Emergency Department at the University Medical Center Groningen hospital, who contributed to this study.
Funding Not applicable.
Availability of data and materials
The datasets used and/or analyzed during the current study are available through the corresponding author on reasonable request.
Authors’contributions
JZ and JCM conceived the study and designed the trial. JL and JCM supervised the conduct of the trial and data collection, performed by JZ and SW. JJM provided statistical advice analyzing the data. JZ analyzed the data and drafted the article. All authors read and approved the final manuscript.
Ethics approval and consent to participate
All patients gave written informed consent for participation in the study which was approved by the institutional review board of the UMCG.
Consent for publication
Not applicable, since data was used anonymously.
Competing interests
The authors declare that they have no competing interests.
Publisher’s Note
Springer Nature remains neutral with regard to jurisdictional claims in published maps and institutional affiliations.
Author details
1
Department of Emergency Medicine, University of Groningen, University Medical Center Groningen, Groningen, The Netherlands.2Department of Cardiology, University of Groningen, University Medical Center Groningen, Groningen, The Netherlands.
Received: 28 February 2018 Accepted: 23 October 2018
References
1. Tanabe P, Buschmann M. A prospective study of ED pain management practices and the patient’s perspective. J Emergency Nursing. 1999;25(3): 171–7.
2. Marks RM, Sachar EJ. Undertreatment of medical inpatients with narcotic analgesics. Ann Intern Med. 1973;78(2):173–81.
3. Stephan F-P, Nickel CH, Martin JS, Grether D, Delport-Lehnen K, Bingisser R. Pain in the emergency department: adherence to an implemented treatment protocol. Swiss Med Wkly. 2010;140(23–24):341–7.
4. Wilson JE, Pendleton JM. Oligoanalgesia in the emergency department. Am J Emerg Med. 1989;7(6):620–3.
5. Selbst SM, Clark M. Analgesic use in the emergency department. Ann Emerg Med. 1990;19(9):1010–3.
6. Green SM. There is oligo-evidence for oligoanalgesia. Ann Emerg Med. 2012;60(2):212–4.
7. Singer AJ, Garra G, Chohan JK, Dalmedo C, Thode HC. Triage pain scores and the desire for and use of analgesics. Ann Emerg Med. 2008; 52(6):689–95.
8. Allione A, Melchio R, Martini G, Dutto L, Ricca M, Bernardi E, et al. Factors influencing desired and received analgesia in emergency department. Intern Emerg Med. 2011;6(1):69–78.
9. Farrar JT, Portenoy RK, Berlin JA, Kinman JL, Strom BL. Defining the clinically important difference in pain outcome measures. Pain. 2000;88(3):287–94. 10. Farrar JT, Young JP, LaMoreaux L, Werth JL, Poole RM. Clinical importance of
changes in chronic pain intensity measured on an 11-point numerical pain rating scale. Pain. 2001;94(2):149–58.
11. World Health Organization. Cancer pain relief with a guide to opioid availability. Second ed; 1996.
12. Phillips S, Gift M, Gelot S, Duong M, Tapp H. Assessing the relationship between the level of pain control and patient satisfaction. J Pain Res. 2013; 6:683–9.
13. Stahmer SA, Shofer FS, Marino A, Shepherd S, Abbuhl S. Do quantitative changes in pain intensity correlate with pain relief and satisfaction? Acad Emerg Med Off J Soc Acad Emerg Med. 1998;5(9):851–7.
14. Müller-Staub M, Meer R, Briner G, Probst M-T, Needham I. Measuring patient satisfaction in an emergency unit of a Swiss university hospital: occurrence of anxiety, insecurity, worry, pain, dyspnoea, nausea, thirst and hunger, and their correlation with patient satisfaction (part 2). Pflege. 2008;21(3):180–8.
15. McNeill JA, Sherwood GD, Starck PL, Nieto B. Pain management outcomes for hospitalized Hispanic patients. Pain Management Nursing. 2001;2(1):25–36.
16. Svensson I, Sjöström B, Haljamäe H. Influence of expectations and actual pain experiences on satisfaction with postoperative pain management. Eur J Pain. 2001;5(2):125–33.
17. Nagurney JT, Brown DFM, Sane S, Weiner JB, Wang AC, Chang Y. The accuracy and completeness of data collected by prospective and retrospective methods. Acad Emerg Med Off J Soc Acad Emerg Med. 2005; 12(9):884–95.
18. Rupp T, Delaney KA. Inadequate analgesia in emergency medicine. Ann Emerg Med. 2004;43(4):494–503.