R E S E A R C H
Open Access
DADA: Degree-Aware Algorithms for
Network-Based Disease Gene Prioritization
Sinan Erten
1*, Gurkan Bebek
2,3,4, Rob M Ewing
2,3,5and Mehmet Koyutürk
1,2,3* Correspondence: sinan. [email protected] 1Department of Electrical Engineering and Computer Science, Case Western Reserve University, Cleveland, OH, USA Full list of author information is available at the end of the article
Abstract
Background:High-throughput molecular interaction data have been used effectively to prioritize candidate genes that are linked to a disease, based on the observation that the products of genes associated with similar diseases are likely to interact with each other heavily in a network of protein-protein interactions (PPIs). An important challenge for these applications, however, is the incomplete and noisy nature of PPI data. Information flow based methods alleviate these problems to a certain extent, by considering indirect interactions and multiplicity of paths.
Results:We demonstrate that existing methods are likely to favor highly connected genes, making prioritization sensitive to the skewed degree distribution of PPI networks, as well as ascertainment bias in available interaction and disease association data. Motivated by this observation, we propose several statistical adjustment methods to account for the degree distribution of known disease and candidate genes, using a PPI network with associated confidence scores for interactions. We show that the proposed methods can detect loosely connected disease genes that are missed by existing approaches, however, this improvement might come at the price of more false negatives for highly connected genes. Consequently, we develop a suite called DADA, which includes different uniform prioritization methods that effectively integrate existing approaches with the proposed statistical adjustment strategies. Comprehensive experimental results on the Online Mendelian Inheritance in Man (OMIM) database show that DADA outperforms existing methods in prioritizing candidate disease genes.
Conclusions:These results demonstrate the importance of employing accurate statistical models and associated adjustment methods in network-based disease gene prioritization, as well as other network-based functional inference applications. DADA is implemented in Matlab and is freely available at http://compbio.case.edu/dada/.
Introduction
Identification of disease-associated genes is an important step toward enhancing our understanding of the cellular mechanisms that drive human diseases, with profound applications in modeling, diagnosis, prognosis, and therapeutic intervention [1]. Gen-ome-wide linkage and association studies (GWAS) in healthy and affected populations identify chromosomal regions potentially containing hundreds of candidate genes pos-sibly associated with genetic diseases [2]. Investigation of these candidates using experimental methods is an expensive task, thus not always a feasible option. Conse-quently, computational methods play an important role in prioritization and
identification of the most likely disease-associated genes by utilizing a variety of data sources such as gene expression [3,4], functional annotations [4-7], and protein-protein interactions (PPIs) [3,8-14]. The scope of methods that rely on functional annotations is limited because only a small fraction of genes in the genome are currently annotated.
In recent years, several algorithms have been proposed to incorporate topological properties of PPI networks in understanding genetic diseases [3,8,13]. These algorithms mostly focus on prioritization of candidate genes and mainly exploit the notion that the products of genes associated with similar diseases have a higher chance of being connected in the network of PPIs. However, an important challenge for these applica-tions is the incomplete and noisy nature of the PPI data [15]. Missing interacapplica-tions and false positives affect the accuracy of methods based on local network information such as direct interactions and shortest distances. Few global methods based on simulation of information flow in the network (e.g., random walks [8,13] or network propagation [14]) get around this problem to a certain extent by considering multiple alternate paths and whole topology of PPI networks. Nevertheless, as we demonstrate in this paper, these methods favor genes whose products are highly connected in the network and perform poorly in identifying loosely connected disease genes.
In this study, we propose novel statistical adjustment methods to correct for degree bias in information flow based disease gene prioritization. These methods aim to assess the statistical significance of the network connectivity of a candidate gene to known disease genes. For this purpose, we use three reference models that take into account the degree distribution of the PPI network: (i) reference model based on degree distri-bution of known disease gene products, (ii) reference model based on the degree of candidate gene products, and (iii) likelihood ratio test using eigenvector centrality as the reference model.
We present comprehensive experimental results demonstrating that the proposed statistical adjustment methods are very effective in detecting loosely connected disease genes which are generally less studied, thus potentially more interesting in terms of generating novel biological knowledge. However, we observe that these methods might perform less favorably in identifying highly connected disease genes. Consequently, we develop three uniform prioritization methods that effectively integrate existing algo-rithms with the proposed statistical adjustment methods, with a view of delivering high accuracy irrespective of the network connectivity of target disease genes. These meth-ods choose the measure to rank candidate genes (raw scores vs. statistically adjusted scores), based on several criteria that take into account the network degree of candi-dates. Finally, we present comprehensive experimental results in the Results section. These results show that the resulting prioritization methods, implemented in Matlab as a suite called DADA, outperform existing approaches in identifying disease-asso-ciated genes.
Background
propagation. Next, we present detailed experimental results to demonstrate the limita-tions of these algorithms in the context of the degree distribution of PPI networks and ascertainment bias in interaction data. Based on these observations, we motivate our approach of applying statistical adjustment to the scores computed by these algorithms.
Network-based candidate disease gene prioritization
There exists a wide range of disease gene prioritization methods that are based on the analysis of the topological properties of PPI networks. These methods commonly rely on the observation that the products of genes that are associated with similar diseases have a higher likelihood of physically interacting [11]. It is important to note here the distinction between genes and their products. Genome-wide association studies focus on identifying genesthat are associated with a disease of interest. Network-based prior-itization aims to aid this effort by inferring functional associations between genes based on the interactions among their products, i.e., proteins. For this reason, any reference to interactions between genes in this paper refers to the interactions between their products.
Existing methods for network-based disease gene prioritization can be classified into two main categories; (i) localized methods, i.e., methods based on direct interactions and shortest paths between known disease genes and candidate genes [3,9,16], (ii) glo-bal methods, i.e., methods that model the information flow in the cell to assess the proximity and connectivity between known disease genes and candidate genes. Several studies show that global approaches, such as random walk and network propagation, clearly outperform local approaches [13,14,17]. For this reason, we focus on global methods in this paper.
For a given disease of interest D, the input to the disease gene prioritization problem consists of two sets of genes, the seed set S and the candidate setC. Theseed set S specifies prior knowledge on the disease,i.e., it is the set of genes known to be asso-ciated withDand diseases similar toD. Each genev∈S is also associated with a simi-larity score s(v, D), indicating the known degree of association betweenvandD. The similarity score for gene vis computed as the maximum phenotypic similarity between Dand any other disease associated with v, based on clinical description of diseases (a detailed discussion on computation of phenotypic similarity scores can be found in the Methods section below). Thecandidate setCspecifies the genes, one or more of which are potentially associated with disease D(e.g., these genes might lie within a linkage interval that is identified by association studies). The overall objective of network based disease prioritization is to use a human PPI networkG= (V,ε,w), to compute a scorea(v, D) for each genev∈C, such thata(v, D) represents the likelihood of vto be associated withD.
reliability of known interactions of vis defined asW(v) =
u∈N(v)w(uv)which we
refer as weighted degree throughout this paper. Global prioritization methods use this network information to compute a by propagatingsoverG. Candidate proteins are then ranked according to a and novel genes that are potentially associated with the disease of interest are identified based on this ranking.
Random walk with restarts
This method simulates a random walk on the network to compute the proximity between two nodes by exploiting the global structure of the network [18,19]. It is used in a wide range of applications, including identification of functional modules [20] and modeling the evolution of social networks [21]. Recently, random walk with restarts has also been applied to candidate disease gene prioritization [8,13].
In the context of disease gene prioritization, random walk with restarts is applied as follows. A random walk starts at one of the proteins inS. At each step, the random walk either moves to a randomly chosen neighboru∈N of the current proteinvor it restarts at one of the proteins in the seed setS. The probability of restarting at a given time step is a fixed parameter denoted by r. For each restart, the probability of restart-ing at v∈S is a function ofs(v, D),i.e., the degree of association between vand the disease of interest. For each move, the probability of moving to interacting partneru of the current protein vis proportional to the reliability of the interaction betweenu andv,i.e.,w(uv). After a sufficiently long time, the probability of being at nodevat a random time step provides a measure of the functional association betweenvand the genes known to be associated with D[8,13]. Algorithmically, random-walk based asso-ciation scores can be computed iteratively as follows:
xt+1= (1−r)PRWxt+rρ. (1)
Here, rdenotes the restart vector withρ(u) =σ(u,D)/
v∈Sσ(v,D)foru∈S and
0 otherwise. PRWdenotes the stochastic matrix derived fromG,i.e., PRW(u, v) =w(uv)/
W(v) forvu∈E and 0 otherwise. For eachv∈V,xt(v) denotes the probability that the
random walk will be at vat timet, wherex0 =r. For each gene v, the resulting
ran-dom-walk based association score is defined asaRW(v, D) = limt®∞xt(v). The elements
in the resulting vectorarepresent the proximity of each protein to the proteins in the seed set.
Network propagation
In other words, the matrixPRWis replaced by a matrixPNP, in which each entry is
normalized with respect to row and column sums. The resulting propagation based model can also be simulated iteratively as follows:
yt+1= (1−r)PNPyt+rρ. (2)
Here, the propagation matrixPNPis computed asPNP(u, v) =w(uv)/
W(u)W(v)for uv∈E, 0 otherwise. For each v∈V, yt(v) denotes the amount of disease association
information at nodevat step t, where y0 =r. For each genev, the resulting network
propagation based association score is defined as aNP(v, D) = limt®∞ yt(v). In this
model, 0 ≤r ≤ 1 is also a user-defined parameter that is used to adjust the relative importance of prior knowledge and network topology.
Role of network degree
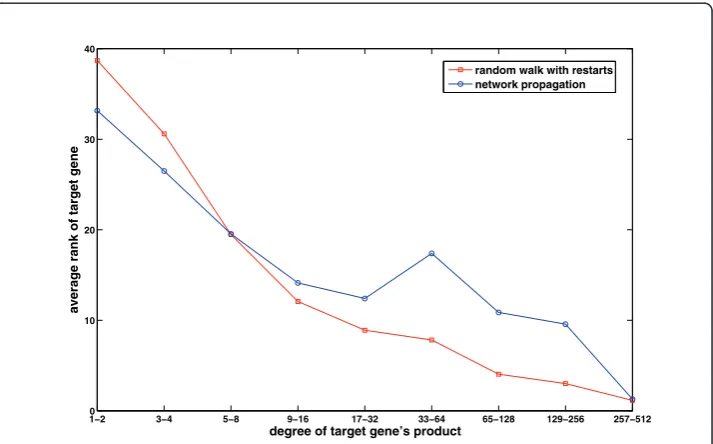
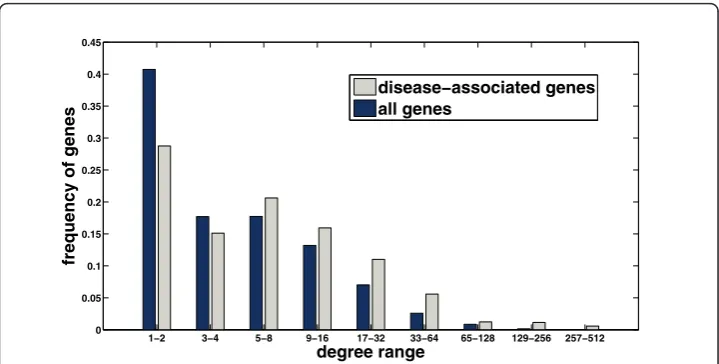
In order to motivate our approach, we evaluate here the performance of random walk with restarts and network propagation with respect to the network degree (number of known interactions) of candidate genes. As shown in Figure 1, these methods are clearly biased toward scoring highly connected proteins higher. In this figure, the per-formance measure is the average rank of the true candidate protein among other 99 proteins in the same linkage interval (please see the Methods section for a description of the experimental set-up used to generate these results). As evident in the figure, existing global methods work very well in predicting highly connected proteins, whereas they perform quite poorly for loosely connected proteins, especially for those with degree less than 6. Furthermore, as seen in Figure 2, the degree distribution of known disease genes is slightly biased toward highly connected genes, however there exist many disease genes that are loosely connected as well. For this reason, it is at
1−20 3−4 5−8 9−16 17−32 33−64 65−128 129−256 257−512 10
20 30 40
degree of target gene’s product
average rank of target gene
random walk with restarts network propagation
least as important to correctly identify loosely connected disease genes as to identify those that are highly connected, in order to remove the effect of ascertainment bias in PPI data and known disease associations. In this context, the term ascertainment bias refers to the distortion in the degree distribution of PPI networks that might result from the difference in how different proteins are assayed for interactions. In particular, it is expected that highly studied proteins in the literature generally have more known interactions and disease associations compared to those that are less studied.
The dependency of performance on network degree can be understood by carefully inspecting the formulation of random walk and network propagation models. Random walk with restarts is actually a generalization of Google’s well-known page-rank algo-rithm [23]. Indeed, for r= 0,ais solely a measure of network centrality. Therefore, for any r >0,a(v, D) contains a component that represents the network centrality ofv, in addition to its association withD. Network propagation alleviates this problem by nor-malizing the incoming flow into a gene, therefore provides a slightly more balanced performance compared to random walk with restarts. However, as evident in the fig-ure, its performance is still influenced heavily by node degrees. Motivated by these insights, we argue that the association scores computed by these algorithms have to be statistically adjusted with respect to reference models that take into account the degree distribution of the network.
Methods
In this section, we propose several reference models for assessing the significance of network-based disease association scores. Subsequently, we discuss how these models can be used in conjunction with existing methods to obtain uniform prioritization methods that can deliver high accuracy regardless of the centrality of candidate genes. Next, we introduce the disease and PPI datasets and the details of the experimental settings used.
Reference Models for Statistical Adjustment
Here, we consider three different reference models for assessing the significance of dis-ease association scores obtained by an information flow based prioritization algorithm:
1−2 3−4 5−8 9−16 17−32 33−64 65−128 129−256 257−512 0
0.05 0.1 0.15 0.2 0.25 0.3 0.35 0.4 0.45
degree range
frequency of genes
disease−associated genes all genes
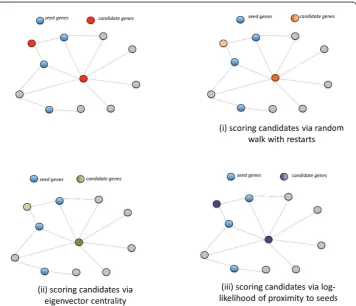
(i) a model that compares the association scores of candidate genes computed using the original seed set with an empirical distribution that is obtained by using randomly generated seed sets that match the degree distribution of the original seed set, (ii) a model that compares the association scores of candidate genes to an empirical distri-bution that is derived from other genes with similar degree in the network, using a fixed seed set, (iii) a model that assesses the likelihood-ratio of the association of a gene with the seed set with respect to its network centrality. Here, for the sake of clarity, we describe each model assuming that random walk based restarts is used to compute raw association scores, however, the methods are directly applicable to net-work propagation as well (we also drop the subscript RW from our notation for simplicity).
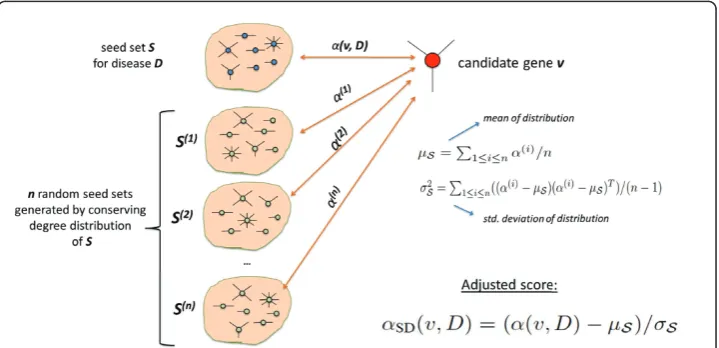
Reference model based on seed degrees
The objective here is to generate a reference model that captures the degree distribu-tion of seed proteins accurately. To this end, we compare the associadistribu-tion scorea(v, D) for each protein with scores computed using random seed sets (by preserving the degree distribution of the seed genes). The expectation here is that false positives that correspond to centralized and highly connected proteins will have high association scores even with respect to these randomly generated seed sets. Such an observation implies that their observed association with the actual seed set is most likely artificial, thus the statistical significance of their association score is low. On the other hand, loosely connected proteins that lie close to the seed proteins will be assigned high sig-nificance although their association scores are generally lower than that of highly con-nected proteins.
Given a diseaseD, seed setS, and candidate setC, this reference model is implemen-ted as follows:
•We first compute network-based association scoresa(v, D) for the original seed setS, using the procedure described by Equation 1.
•Then, based on the original seed setS, we generate a random instanceS(i)that
representsS in terms of weighted degree distribution.S(i)is generated as follows:
- First, a bucketB(u)is created for each proteinu∈S.
- Then, each proteinv∈V is assigned to bucketB(u)ifW(v)−W(u)< W(v) −W(u’) for allu∈S, where ties are broken randomly.
- Subsequently, S(i)is generated by choosing a protein from each bucket
uni-formly at random. It can be observed that each protein inS is represented by exactly one protein in S(i), thus the total weighted degree of proteins inS(i)is
expected to be very close to that ofS.
•For 1 ≤ i≤ n, the association scores a(i)for seed set S(i)are computed using
Equation 1. Here,nis a sufficiently large number that is used to obtain a represen-tative sampling {a(1)
,a(2),a(3), ...,a(n)} of the population of association scores for seed sets that match the size and degree distribution ofS (we use = 1000 in our experiments).
•We then estimate the mean of this distribution as μS =
1≤i≤nα
(i)/n
and the
standard deviation asσS2=
1≤i≤n((α
• Finally, we compute the adjusted score for each gene v as αSD(v,D) = (α(v,D)−μS)/σS.
This statistical adjustment strategy is illustrated in Figure 3. Note that, since the mul-tiple hypotheses being tested here are compared and ranked against each other (as opposed to accepting/rejecting individual hypotheses), it is not necessary to perform correction for multiple hypothesis testing.
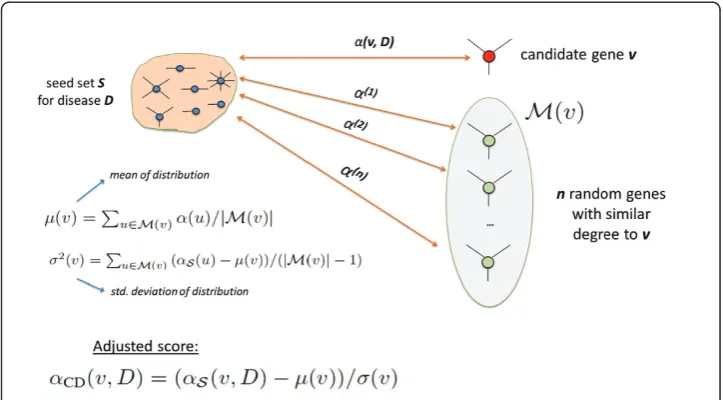
Reference model based on candidate degree
This reference model aims to assess the statistical significance of the association score of a protein vwith respect to a population of association scores that belong to proteins with weighted degree similar to that of v. For proteinv, if other proteins with similar weighted degrees usually have high association scores for a given seed set, the statisti-cal significance of the association score ofvcan be considered low. On the other hand, loosely connected proteins are compared to other loosely connected proteins, which potentially have lower association scores, thus the artificial advantage of the highly connected proteins is removed.
This reference model is generated as follows:
•First, we compute the network-based association vector awith respect to the given seed setS, again using Equation 1.
•Then, for each candidate genev∈C, we select then genes in the network with smallest W(v) −W (u) to create a representative setM(v)that contains then genes most similar to v in terms of their weighted degree (n = 1000 in our experiments).
•Subsequently, for each genev∈C, we estimate the mean association score of its representative population asμ(v) =u∈M(v)α(u)/|M(v)|and the standard devia-tion of associadevia-tion scores asσ2(v) =
u∈M(v)(αS(u)−μ(v))/(|M(v)| −1). • Finally, we compute the adjusted score of each candidate gene v as αCD(v,D) = (αS(v,D)−μ(v))/σ(v).
In Figure 4, we illustrate this statistical adjustment strategy.
Likelihood-ratio test using eigenvector centrality
Here, we assess the association of a gene with the seed set using a likelihood-ratio test. More precisely, considering aRW(v, D) as the likelihood ofvbeing associated with the
seed set S for diseaseD, we compare this likelihood with the likelihood of vbeing associated with any other gene product in the network. To compute the likelihood of v’s association with any other gene in the network, we use eigenvector centrality [23], which is precisely equal to the random walk based association score of v for zero restart probability (r= 0).
The objective here is to remove the bias introduced by network centrality, since central nodes are favored in the prioritization process by existing methods. The centrality score of a protein is computed again by simulating random walks, but this time with no restarts. More formally, the vector athat contains the association of each protein to the seed set is computed as in Equation 1 with restart probability r >0 (the selection of a particular value of r is discussed in detail in the Results sec-tion), while the centrality score of each protein is computed by setting r = 0. Indeed, setting r = 0 corresponds to the case where the seed set is empty, thereby making the resulting association score solely a function of the proteins’s network
centrality. For each v∈C, the eigenvector centrality based log-likelihood score is computed as:
αEC(v, D) = logα
(r>0)(v,D)
α(r=0)(v,D). (3)
We illustrate these concepts on a small sample network in Figure 5, where we show the relative scores of two candidates computed using (i) network proximity with respect to seed proteins, (ii) eigenvector centrality and (iii) the log-likelihood ratio test.
Uniform Prioritization
As we demonstrate in the next section, the statistical adjustment strategies presented above improve the performance of global prioritization algorithms in identifying loosely connected disease genes. However, this comes at the price of increased number of false negatives for highly connected disease genes. Motivated by this observation, we propose several uniform scoring strategies that aim to take advantage of both raw and
statistically adjusted scores. The idea here is to derive a uniform prioritization method that uses the adjusted scores for loosely connected candidate genes, while using the raw scores for highly connected candidate genes.
For this purpose, we first sort the raw crosstalk scores (aRWor aNP ) of candidate
genes in descending order. LetRRAW(v) denote the rank of genev∈Cin this ordering.
Clearly, foru,v∈C,RRAW(v)< RRAW(u) indicatesvis more likely to be associated with
the disease than uis. Similarly, we sort the statistically adjusted scores (aSD,aCD, or
aEC) in descending order, to obtain a rankRADJ(v) for each genev∈C.
We propose three alternate strategies for merging these two rankings to obtain a uniform ranking RUNI, where the objective is to have RUNI(v) < RUNI(u) if gene vis
associated with the disease, while gene uis not. OnceRUNI(v) is obtained using one of
the following methods, we map it into the interval[1,|C|]in the obvious way.
Uniform prioritization based on the degree of candidate gene
This uniform prioritization method chooses the ranking of each candidate gene based on its own weighted degree. Namely, for a given user-defined threshold l, we define
R(C)UNIas:
R(C)UNI(v) =
RRAW(v) ifW(v)> λ
RADJ(v) otherwise (4)
for eachv∈C. Thus the ranking of a highly connected gene is based on its raw asso-ciation score, while that of a loosely connected gene is based on the statistical signifi-cance of its association score. Note that, with respect to this definition, the ranking of two genes can be identical, but there cannot be more than two genes with identical ranking. In the case of a tie, the tie is broken based on the unused ranking of each gene.
Optimistic uniform prioritization
This approach uses the best available ranking for each candidate gene, based on the expectation that a true disease gene is more likely to show itself in at least one of the rankings as compared to a candidate gene that is not associated with the disease. Namely, we defineR(O)UNIas:
R(O)UNI(v) =
RRAW(v) ifRRAW(v)<RADJ(v)
RADJ(v) otherwise (5)
for eachv∈C. Again, ties are broken based on the unused rankings.
Uniform prioritization based on degree of known disease genes
For a given seed set S, we first compute d¯(S) = (
u∈SW(u))
|S|. Subsequently, if ¯
d(S)> λ(wherel is defined as above), we setR(S)UNI(v) =RRAW(v)for allv∈C,
other-wise, we setR(S)UNI(v) =RADJ(v). Observe that, this approach is global, i.e. rankings used
do not depend on the weighted degree of each candidate gene, but the average weighted degree of the seed set. On the other hand, the other two uniform prioritiza-tion methods presented earlier are local, i.e. ranking used for each candidate gene depends on the gene being considered.
Datasets
We test and compare the proposed methods on a comprehensive set of disease ciation data, using an integrated human PPI network in which interactions are asso-ciated with reliability scores. We describe these datasets in detail below.
Disease Association and Phenotypic Similarity Data
We obtain disease information from the Online Mendelian Inheritance in Man (OMIM) database. OMIM provides a publicly accessible and comprehensive database of genotype-phenotype relationship in humans. We map genes associated with diseases to our PPI network and remove those diseases for which we are unable to map more than two associated genes. After this step, we have a total of 206 disease families with at least 3 associated genes. Number of genes associated with these diseases ranges from 3 to 36, with the average number of associations for each disease being approxi-mately 6.
As mentioned previously, proteins associated with similar diseases or phenotypes lie in close proximity in the PPI network. This brings the idea of utilizing disease similar-ity information in to identification of disease genes [3,14]. Driel et al. [24] incorporate disease similarity information using a text mining algorithm that can be summarized as follows:
•First, each OMIM record is parsed and the keywords are searched for existence in the anatomy (A) and the disease (C) sections of the Medical Subject Headings Vocabulary (MeSH), which is a controlled vocabulary of U.S. National Library of Medicine. MeSH is especially useful for applications that use information that con-tains different terminology for identical concepts.
•Each OMIM record is then represented by binary vectors where each entry of the vector corresponds to the existence of a term in that record.
•Similarity of two diseases is then computed by calculating the cosine of the angle between their representative vectors.
After these calculations, a similarity score between 0 and 1 for every pair of OMIM diseases is available. This disease similarity information is used to compute the prior association between each gene and the disease of interest as follows: Let dcdenote the
disease of interest, θ= {d1,d2,d3, ...,dt} represent the set of other diseases for which
information is available andj(di, dj) denote the similarity between diseasesdi anddj.
Also, let Sidenote the set of genes associated with disease di. Note that, these sets are
For the disease of interestdc, these methods consider other diseasesdiinθsuch that
j(dc, di)>g wheregis a user-defined threshold that is used to decide which diseases
are considered similar. We follow [14] and utilize a logistic function to represent these similarity scores based on the empirical findings related to setting of g in [24]. Now since vector s(v, D) in Equations 1 and 2 represent the prior information on the asso-ciation between each gene and the disease dc, s(v, D) can be set to the similarity of
the disease that involves gene vand the disease of interestdc.
Note that, if a gene is associated with more than one disease, its prior association score withdc is set to the maximum of the similarity scores ofdcand the diseases it is
associated with.
Protein-Protein Interaction (PPI) Data
In our experiments, we use the human PPI data obtained from NCBI Entrez Gene Database [25]. This database integrates interaction data from several other databases available, such as HPRD, BioGrid, and BIND. After the removal of nodes with no interactions, the final PPI network contains 8959 proteins and 33528 distinct interac-tions among these proteins. Using a logistic regression model, we also assign reliability scores to each of these PPIs [26,27]. In this logistic regression model, we incorporate (i) the Pearson correlation of expression measurements across a range of different tis-sues and conditions for the corresponding coding genes (denotedX1(uv) for proteinsu
and v), (ii) the proteins’ small world clustering coefficient (denotedX2(uv)) [28], and
(iii) the proteins’subcellular localization data (denotedX3(uv)) [29,30]. For correlation
of gene expression, the expression profiles of normal human tissues measured in the Human Body Index Transcriptional Profiling are used (GSE7307) [31]. In total, 213 normal samples are processed, representing over 90 distinct tissue types and a global expression correlation is acquired for each pair of interacting partners. The protein subcellular localization data is used to eliminate interactions that are not biologically relevant, based on the expectation that proteins that are not co-localized are not likely to interact with each other. Although proteins travel in the cell and can coexist in mul-tiple compartments, incorporation of subcellular localization data helps eliminate many false negative interactions.
Once these statistics are obtained for each pair of proteins, we compute the reliabil-ity of interactionuv∈Eas the probability of a true interaction betweenuandvgiven X (uv) = (X1(uv), X2(uv), X3(uv)), under the logistic distribution. Namely, we define
w(uv) =P(I(uv)|X(uv)) = 1
1+e−β0−3i=1βi Xi
(uv), where I(uv) is the indicator random variable
representing the existence of a true interaction between uandv. The parametersb0,
b1, b2, andb3 are optimized to maximize the likelihood of a true interaction using
Experimental Setting
In order to evaluate the performance of different methods in terms of accurately prior-itizing disease-associated genes, we apply leave-one-out cross-validation. For each gene that is associated with a disease, we conduct the following experiment:
•We remove that gene from the set of genes associated with the disease. We call the gene that is removed thetarget genefor that experiment. The remaining genes associated with the disease compose the seed setS.
•We generate an artificial linkage interval, containing the target gene with other 99 genes located nearest in terms of genomic distance. The genes in this artificial link-age interval (including the target gene) compose the candidate setC. Note that, according to our experiments, the size of candidate set does not have a significant effect on the performance difference between different methods as long as it is greater than 20 (data not shown).
•Using each of the methods described in the previous section, we obtain a ranking of candidate genes and use this ranking to predict disease genes.
In order to systematically compare the performance of different methods, we use the following evaluation criteria:
ROC curves
We plot ROC curves, i.e., sensitivity vs. 1-specificity, by thresholding the rank to be considered a “predicted disease gene” from 1 to 100. Sensitivity(recall) is defined as the percentage of true disease genes that are ranked above the particular threshold, whereas specificityis defined as the percentage of all genes that are ranked below the threshold. The area under ROC curve (AUC) is used as a measure to assess the perfor-mance of different methods. Note that, AUC is a conservative measure for this experi-mental set-up since there exists only one true positive (the target gene) for each experiment. For this reason, we also use other performance criteria that take into account the rank of the target gene.
Average rank
This is the average rank of the target gene among all candidate genes, computed across all disease-gene pairs in a total of ten executions of the experiments. Clearly, a lower number for average rank indicates better performance.
Percentage of the disease genes ranked in top 1% and 5%
Percentages of true disease genes that are ranked as one of the genes in the top 1% (practically, the top gene) and also in the top 5% among all candidates are also reported.
Results and Discussion
Selection of Restart Probability
The restart probability represented by r in Equations 1 and 2 is a parameter that is used to adjust the preference between the importance of a protein with respect to the seed set and network topology. The effect of the selection of the restart probability is minor unless a very small value is used [34]. The performance degrades significantly for the valuesr ≤0.01, which is expected because the effect of the seed genes is mini-mized in that case, thus the proximity of a protein is calculated based primarily on the centrality of that protein in the network. We observe that r = 0.3 is optimal for the performance of both random walk with restarts and network propagation algorithms, after running the algorithms with small increments of r[34]. Thus,r is set to 0.3 in all experiments presented in this paper, for all algorithms.
Performance of Statistical Adjustment Methods
As mentioned before, the performance of existing methods is highly biased with the connectedness of the true candidate protein. The effect of the total number of interac-tions of true disease gene on the performance of global methods is demonstrated in Figure 1. To investigate the effect of weighted degree on the proposed statistical adjustment strategies and existing methods, we compare the results achieved by differ-ent methods by considering the true disease genes with low weighted degree (≤m)
and with high weighted degree (> m) separately wherem= (
v∈VW(v))
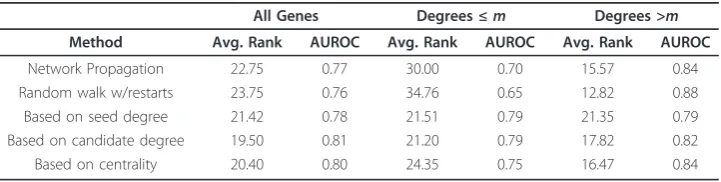
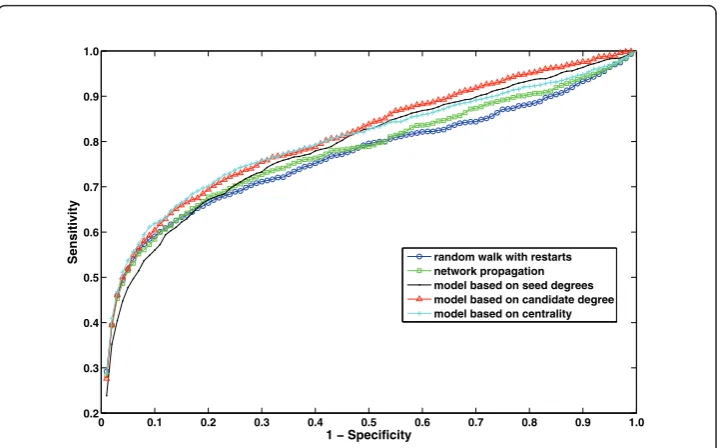
|V|is the average weighted degree of all genes(m= 4.23 in our experiments). These results are shown in Table 1. As seen in the table, all of the three statistical adjustment methods outperform existing methods for loosely connected genes. On the other hand, existing approaches (raw scores) perform better for highly connected genes compared to the statistical adjustment methods. For this reason, when we consider the overall perfor-mance across all genes, the perforperfor-mance difference appears to be minor. However, as evident in the ROC curve in Figure 6, when all genes are considered, the statistical adjustment methods still perform better than existing methods. Next, we investigate how the proposed uniform prioritization methods improve the performance of these statistical adjustment methods.
Performance of Uniform Prioritization
Here, we systematically investigate the performance of the proposed uniform prioritiza-tion methods, by considering the combinaprioritiza-tion of each of these methods with each of
Table 1 The effect of statistical adjustment on performance.
All Genes Degrees≤m Degrees >m
Method Avg. Rank AUROC Avg. Rank AUROC Avg. Rank AUROC
Network Propagation 22.75 0.77 30.00 0.70 15.57 0.84
Random walk w/restarts 23.75 0.76 34.76 0.65 12.82 0.88
Based on seed degree 21.42 0.78 21.51 0.79 21.35 0.79
Based on candidate degree 19.50 0.81 21.20 0.79 17.82 0.82
Based on centrality 20.40 0.80 24.35 0.75 16.47 0.84
The effect of statistical adjustment on performance. Average Rank of the true disease genes and AUC values are listed. To demonstrate the effect of connectivity, we also provide separate results for the cases in which the weighted degree
of true disease gene is≤mand>mwherem= (
v∈VW(v))
|V|is the average weighted degree of all genes (m
the three statistical adjustment methods (a total of nine combinations) applied in con-junction with random walk with restarts. In these experiments, the degree threshold l is set to the average weighted degree of all genes. For convenience, we refer to each uniform prioritization method using the corresponding ranking symbol introduced in the previous section(R(C)UNI, R(O)UNI, orR(S)UNI).
The average rank and AUC for the nine combinations of proposed methods are listed in Table 2. As seen in the table, it is difficult to choose between the proposed methods. We suggest that the uniform prioritization method based on seed degree
(R(C)UNI), combined with statistical adjustment based on centrality, can be considered the
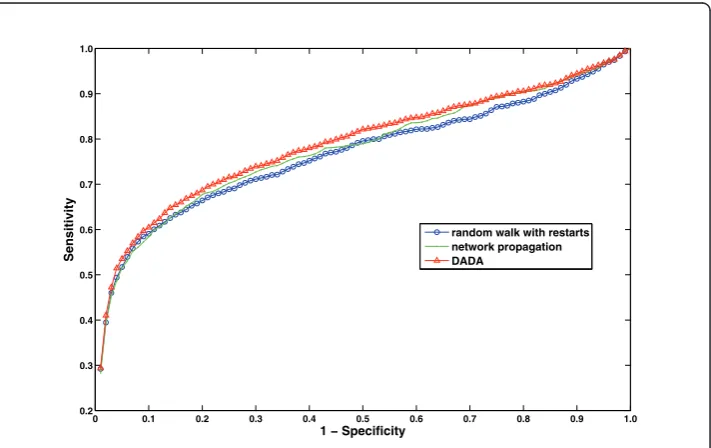
“winner”, since this approach is the only one that outperforms existing approaches in all performance metrics used. This setting is provided as the default combination of statistical adjustment and uniform prioritization methods in Matlab distribution of DADA. However, users are also given the option to configure these methods based on their needs, since the performance of these methods can be variable on different data-sets. We compare this combination of proposed algorithms to existing global methods in Table 3 and Figure 7. These results reflect the best performance that can be achieved by DADA on the OMIM dataset. These results clearly show that DADA out-performs existing methods with respect to all performance criteria, however, the over-all performance of DADA and Network Propagation are quite close to each other.
0 0.1 0.2 0.3 0.4 0.5 0.6 0.7 0.8 0.9 1.0
0.2 0.3 0.4 0.5 0.6 0.7 0.8 0.9 1.0
1 − Specificity
Sensitivity random walk with restarts
network propagation model based on seed degrees model based on candidate degree model based on centrality
Figure 6ROC curves for the proposed statistical adjustment strategies and existing methods.
Table 2 Performance of all combinations of uniform prioritization methods.
Candidate deg. Seed deg. Centrality
R(C)UNI R(O)UNI R(S)UNI R(C)UNI R(O)UNI R(S)UNI R(C)UNI R(O)UNI R(S)UNI Avg. Rank 20.89 20.82 20.56 21.07 21.10 21.38 21.14 20.95 21.52
AUROC 0.80 0.80 0.80 0.79 0.79 0.79 0.79 0.79 0.79
Furthermore, careful inspection of average rank with respect to the number of interac-tions of true disease gene in Figure 8 shows that, this method almost matches the per-formance of the best performing algorithm for each degree regime. Namely, if the target gene is loosely connected, our uniform prioritization method performs similar to statistically adjusted version of the random walk with restarts algorithm. On the other hand, it performs similar to the original random walk with restarts algorithm (with raw scores) for highly connected target genes.
Case Example
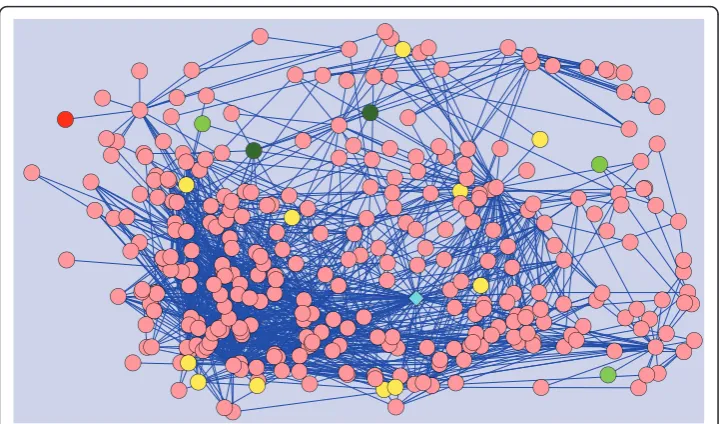
Here, we provide a real example to demonstrate the power of the proposed method in identifying loosely connected disease genes. We focus on Microphthalmiasince it pro-vides a clear example to illustrate the power of statistical adjustment in detecting true disease genes with few known interactions. Microphthalmiahas 3 genes directly asso-ciated with it in the PPI network, namely SIX6,CHX10andBCOR. In our experiments, we remove SIX6and try to predict this gene using the other two genes, as well genes associated with diseases similar to Microphthalmia. This experiment is illustrated in Figure 9. The figure shows the 2-neighborhood of proteins SIX6,CHX10andBCOR. As seen in the figure, the global methods fail because the product ofSIX6is not a cen-tralized protein with a degree of only 1. Thus, random walk with restarts model ranks this true gene as 26thand network propagation ranks it 16thamong 100 candidates. On the other hand, our method is able to correctly rank this gene as the 1stcandidate.
Table 3 Comparison of the proposed method with existing approaches.
METHOD Avg. Rank AUROC Perc. Ranked in top 1% Perc. Ranked in top 5%
DADA 21.52 0.79 29.41 53.57
Network propagation 22.75 0.77 28.18 51.52
Random walk w/restarts 23.75 0.76 29.25 51.76
0 0.1 0.2 0.3 0.4 0.5 0.6 0.7 0.8 0.9 1.0 0.2
0.3 0.4 0.5 0.6 0.7 0.8 0.9 1.0
1 − Specificity
Sensitivity
random walk with restarts network propagation DADA
Both random walk and network propagation rank the geneAKT1top among all candi-dates, which, not surprisingly, is a high degree protein (78), also connected to other hub proteins.
Conclusions
In this paper, we have shown that approaches based on global network properties in prioritizing disease-associated genes are highly biased by the degree of the candidate
1−20 3−4 5−8 9−16 17−32 33−64 65−128 129−256 257−512 10
20 30 40
degree of target gene’s product
average rank of target gene
random walk with restarts network propagation adjusted by candidate degree DADA
Figure 8The effect of connectivity of the target gene on overall performance of DADA. Comparison of the performances of the proposed uniform prioritization method and existing methods with respect to the number of interactions of the target gene.
Figure 9Case Example. Case example for the Microphthalmia disease. Products of genes associated with Microphthalmia or a similar disease are shown by green circles, where the intensity of green is
gene, thus perform poorly in detecting loosely connected disease genes. We proposed several statistical adjustment strategies that improve the performance, particularly in identifying loosely connected disease genes. We have shown that, when these adjust-ment methods are used together with existing global methods, the resulting method outperforms existing approaches significantly. These results clearly demonstrate that, in order to avoid exacerbation of ascertainment bias and propagation of noise, net-work-based biological inference methods have to be supported by statistical models that take into account the degree distribution. DADA is freely available for download at http://compbio.case.edu/dada/.
Acknowledgements
We would like to thank the reviewers for many useful suggestions. This work is supported, in part, by the National Science Foundation (NSF) Award CCF-0953195. This work is also supported, in part, by a Choose Ohio First Scholarship to SE by the State of Ohio.
Author details
1Department of Electrical Engineering and Computer Science, Case Western Reserve University, Cleveland, OH, USA. 2
Case Center for Proteomics and Bioinformatics, Case Western Reserve University, Cleveland, OH, USA.3Case Comprehensive Cancer Center, Case Western Reserve University, Cleveland, OH, USA.4Genomic Medicine Institute, Cleveland Clinic, Cleveland, OH, USA.5Department of Genetics, Case Western Reserve University, Cleveland, OH, USA.
Authors’contributions
RME conceived and formulated the problem; SE and MK conceived and formulated the proposed approach and algorithms; SE implemented and tested the algorithms, GB constructed the integrated PPI network; SE and MK drafted the manuscript; all authors reviewed, edited, and approved the final manuscript.
Received: 2 September 2010 Accepted: 24 June 2011 Published: 24 June 2011
References
1. Brunner HG, van Driel MA:From syndrome families to functional genomics.Nat Rev Genet2004,5(7):545-551. 2. Glazier AM, Nadeau JH, Aitman TJ:Finding Genes That Underlie Complex Traits.Science2002,298(5602):2345-2349
[http://www.sciencemag.org/cgi/content/abstract/298/5602/2345].
3. Lage K, Karlberg E, Storling Z, Olason P, Pedersen A, Rigina O, Hinsby A, Tumer Z, Pociot F, Tommerup N, Moreau Y, Brunak S:A human phenome-interactome network of protein complexes implicated in genetic disorders.Nat Bio
2007,25(3):309-316.
4. Aerts S, Lambrechts D, Maity S, Van Loo P, Coessens B, De Smet F, Tranchevent LC, De Moor B, Marynen P, Hassan B, Carmeliet P, Moreau Y:Gene prioritization through genomic data fusion.Nat Biotech2006,24(5):537-544. 5. Adie E, Adams R, Evans K, Porteous D, Pickard B:SUSPECTS: enabling fast and effective prioritization of positional
candidates.Bioinformatics2006,22(6):773-774[http://bioinformatics.oxfordjournals.org/cgi/content/abstract/22/6/773]. 6. Turner F, Clutterbuck D, Semple C:POCUS: mining genomic sequence annotation to predict disease genes.Genome
Biology2003,4(11):R75[http://genomebiology.com/2003/4/11/R75].
7. Masotti D, Nardini C, Rossi S, Bonora E, Romeo G, Volinia S, Benini L:TOM: enhancement and extension of a tool suite for in silico approaches to multigenic hereditary disorders.Bioinformatics2008,24(3):428-429[http:// bioinformatics.oxfordjournals.org/cgi/content/abstract/24/3/428].
8. Chen J, Aronow B, Jegga A:Disease candidate gene identification and prioritization using protein interaction networks.BMC Bioinformatics2009,10:73[http://www.biomedcentral.com/1471-2105/10/73].
9. Oti M, Snel B, Huynen MA, Brunner HG:Predicting disease genes using protein-protein interactions.J Med Genet
2006 [http://jmg.bmj.com/cgi/content/abstract/jmg.2006.041376v1], jmg.2006.041376. 10. Oti M, Brunner HG:The modular nature of genetic diseases.Clinical Genetics2007,71:1-11. 11. Goh KI, Cusick ME, Valle D, Childs B, Vidal M, Barabási ALAA:The human disease network.PNAS2007,
104(21):8685-8690.
12. Ideker T, Sharan R:Protein networks in disease.Genome research2008,18(4):644-652.
13. Köhler S, Bauer S, Horn D, Robinson PN:Walking the Interactome for Prioritization of Candidate Disease Genes.Am J Hum Genet2008,82(4):949-958[http://linkinghub.elsevier.com/retrieve/pii/S0002929708001729].
14. Vanunu O, Magger O, Ruppin E, Shlomi T, Sharan R:Associating genes and protein complexes with disease via network propagation.PLoS computational biology2010,6:e1000641+.
15. Edwards AM, Kus B, Jansen R, Greenbaum D, Greenblatt J, Gerstein M:Bridging structural biology and genomics: assessing protein interaction data with known complexes.Trends in Genetics2002,18(10):529-536.
16. George RA, Liu JY, Feng LL, Bryson-Richardson RJ, Fatkin D, Wouters MA:Analysis of protein sequence and interaction data for candidate disease gene prediction.Nucl Acids Res2006,34(19):e130[http://nar.oxfordjournals.org/cgi/content/ abstract/34/19/e130].
17. Navlakha S, Kingsford C:The power of protein interaction networks for associating genes with diseases.
19. Tong H, Faloutsos C, Pan JY:Random walk with restart: fast solutions and applications.Knowledge and Information Systems2008,14(3):327-346.
20. Macropol K, Can T, Singh A:RRW: repeated random walks on genome-scale protein networks for local cluster discovery.BMC Bioinformatics2009,10:283[http://www.biomedcentral.com/1471-2105/10/283].
21. Tong H, Faloutsos C:Center-piece subgraphs: problem definition and fast solutions.KDD‘06: Proceedings of the 12th ACM SIGKDDNY, USA: ACM; 2006, 404-413.
22. Nabieva E, Jim K, Agarwal A, Chazelle B, Singh M:Whole-proteome prediction of protein function via graph-theoretic analysis of interaction maps.Bioinf2005,21:i302-310[http://bioinformatics.oxfordjournals.org/cgi/content/abstract/21/ suppl_1/i302].
23. Brin S, Page L:The Anatomy of a Large-Scale Hypertextual Web Search Engine.Computer Networks and ISDN Systems
1998,30:107-117[http://citeseerx.ist.psu.edu/viewdoc/summary?doi=10.1.1.109.4049].
24. van Driel MA, Bruggeman J, Vriend G, Brunner HG, Leunissen JA:A text-mining analysis of the human phenome.
EJHG2006,14(5):535-542.
25. Maglott D, Ostell J, Pruitt KD, Tatusova T:Entrez Gene: gene-centered information at NCBI.Nucl Acids Res2007,
35(suppl-1):D26-31[http://nar.oxfordjournals.org/cgi/content/abstract/35/suppl_1/D26].
26. Bebek G, Yang J:PathFinder: mining signal transduction pathway segments from protein-protein interaction networks.BMC Bioinformatics2007,8:335.
27. Patel VN, Bebek G, Mariadason JM, Wang D, Augenlicht LH, Chance MR:Prediction and Testing of Biological Networks Underlying Intestinal Cancer.PLoS ONE2010,5(9):e12497.
28. Goldberg DS, Roth FP:Assessing experimentally derived interactions in a small world.Proc Natl Acad Sci USA2003,
100(8):4372-6.
29. Sprenger J, Lynn Fink J, Karunaratne S, Hanson K, Hamilton NA, Teasdale RD:LOCATE: a mammalian protein subcellular localization database.Nucleic Acids Res2008, ,36 Database:D230-3.
30. Huh WK, Falvo JV, Gerke LC, Carroll AS, Howson RW, Weissman JS, O’Shea EK:Global analysis of protein localization in budding yeast.Nature2003,425(6959):686-91.
31. Barrett T, Troup DB, Wilhite SE, Ledoux P, Rudnev D, Evangelista C, Kim IF, Soboleva A, Tomashevsky M, Marshall KA, Phillippy KH, Sherman PM, Muertter RN, Edgar R:NCBI GEO: archive for high-throughput functional genomic data.
Nucleic Acids Res2009, ,37 Database:D885-90.
32. Mewes HW, Amid C, Arnold R, Frishman D, Güldener U, Mannhaupt G, Münsterkötter M, Pagel P, Strack N, Stümpflen V, Warfsmann J, Ruepp A:MIPS: analysis and annotation of proteins from whole genomes.Nucleic Acids Res2004, ,32 Database:D41-4.
33. Smialowski P, Pagel P, Wong P, Brauner B, Dunger I, Fobo G, Frishman G, Montrone C, Rattei T, Frishman D, Ruepp A:
The Negatome database: a reference set of non-interacting protein pairs.Nucleic Acids Res2010, ,38 Database:
D540-4.
34. Erten MS:Network Based Prioritization of Disease Genes.Master’s thesisCase Western Reserve University; 2009. doi:10.1186/1756-0381-4-19
Cite this article as:Ertenet al.:DADA: Degree-Aware Algorithms for Network-Based Disease Gene Prioritization. BioData Mining20114:19.
Submit your next manuscript to BioMed Central and take full advantage of:
• Convenient online submission
• Thorough peer review
• No space constraints or color figure charges
• Immediate publication on acceptance
• Inclusion in PubMed, CAS, Scopus and Google Scholar
• Research which is freely available for redistribution