R E S E A R C H A R T I C L E
Open Access
The product of fasting plasma glucose and
triglycerides improves risk prediction of
type 2 diabetes in middle-aged Koreans
Joung-Won Lee
1,2, Nam-Kyoo Lim
1and Hyun-Young Park
1*Abstract
Background:Screening for risk of type 2 diabetes mellitus (T2DM) is an important public health issue. Previous studies
report that fasting plasma glucose (FPG) and triglyceride (TG)-related indices, such as lipid accumulation product (LAP) and the product of fasting glucose and triglyceride (TyG index), are associated with incident T2DM. We aimed to evaluate whether FPG or TG-related indices can improve the predictive ability of a diabetes risk model for middle-aged Koreans.
Methods: 7708 Koreans aged 40–69 years without diabetes at baseline were eligible from the Korean Genome and
Epidemiology Study. The overall cumulative incidence of T2DM was 21.1% (766 cases) in men and 19.6% (797 cases) in women. Therefore, the overall cumulative incidence of T2DM was 20.3% (1563 cases). Multiple logistic regression analysis was conducted to compare the odds ratios (ORs) for incident T2DM for each index. The area under the receiver operating characteristic curve (AROC), continuous net reclassification improvement (cNRI), and integrated discrimination improvement (IDI) were calculated when each measure was added to the basic risk model for diabetes.
Results:All the TG-related indices and FPG were more strongly associated with incident T2DM than WC in our study
population. The adjusted ORs for the highest quartiles of WC, TG, FPG, LAP, and TyG index compared to the lowest, were 1.64 (95% CI, 1.13–2.38), 2.03 (1.59–2.61), 3.85 (2.99–4.97), 2.47 (1.82–3.34), and 2.79 (2.16–3.60) in men, and 1.17 (0.83–1.65), 2.42 (1.90–3.08), 2.15 (1.71–2.71), 2.44 (1.82–3.26), and 2.85 (2.22–3.66) in women, respectively. The addition of TG-related parameters or FPG, but not WC, to the basic risk model for T2DM (including age, body mass index, family history of diabetes, hypertension, current smoking, current drinking, and regular exercise) significantly increased cNRI, IDI, and AROC in both sexes.
Conclusions: Adding either TyG index or FPG into the basic risk model for T2DM increases its prediction and
reclassification ability. Compared to FPG, TyG index was a more robust T2DM predictor in the stratified sex and fasting glucose level. Therefore, TyG index should be considered as a screening tool for identification of people at high risk for T2DM in practice.
Keywords: TyG index, Type 2 diabetes mellitus, Risk model
* Correspondence:mdhypark@gmail.com
1Division of Cardiovascular Diseases, Center for Biomedical Sciences, Korea National Institute of Health, 187 Osongsaengmyeng 2-ro, Osong-eup, Heungdeok-gu, Cheongju-si, Chungcheongbuk-do 361-951, South Korea Full list of author information is available at the end of the article
Background
Type 2 diabetes mellitus (T2DM) is one of the most prevalent non-communicable diseases in the middle-aged population worldwide, largely because of recent changes in diet and lifestyle [1, 2]. In the Korean National Health and Nutrition Examination Surveys (KNHANES), the prevalence of diabetes among adults aged 30 and over was found to have slightly in-creased, from 12.4% in 2011 to 13.0% in 2014 [3, 4]. According to an estimate by the International Dia-betes Federation, 46.3% of cases of diaDia-betes in Ko-reans aged 20–79 were undiagnosed in 2015 [5]. However, lifestyle intervention can reduce the risk of incident T2DM and mortality in individuals at high risk of diabetes [6, 7]. Therefore, it is important to screen high-risk individuals for T2DM regularly to ensure early diagnosis. For this reason, risk models for diabetes have been proposed in previous studies, and, recently, T2DM risk prediction models have been reported in Korea [8–14].
Obesity is the most significant risk factor for inci-dent T2DM [15, 16]. Body mass index (BMI) has been used as a surrogate marker for obesity and in-cluded as one of the variables in most risk models for T2DM [9, 11–14]. However, BMI does not reflect central obesity. Lee et al. selected waist circumference (WC) instead of BMI in their diabetes risk model considering its association with diabetes [10]. In the systematic review, more than 30% of the diabetes risk models stating its components included both BMI and WC [8]. To improve the prediction ability of a risk model for incident T2DM, blood parameters are also frequently included [8].
Also, the increase of fasting plasma glucose (FPG) in the normal range is associated with increased in-cident T2DM [17]. Of these, serum triglyceride (TG) has been used to identify people at high risk for T2DM, alongside obesity [18]. In addition, lipid ac-cumulation product (LAP) and the product of fasting plasma glucose and triglyceride (TyG index), com-posite indices including TG, have been proposed as predictors of T2DM [19, 20]. In particular, TyG index has been used as a marker of insulin resist-ance [19]. Although the simple diabetes risk model is convenient for self-assessment, more accurate pre-diction models that include blood parameters are also required to facilitate more accurate clinical con-sultations [8]. In Korea, most people are registered with the National Health Insurance (NHI), which provides biannual medical check-ups for middle-aged people, including the measurement of key blood pa-rameters [21]. Therefore, risk models for incident T2DM that are based on the data obtained from these medical check-ups would be of great use for
the prediction of risk of future T2DM. To date, few studies have been undertaken in Korea that compare the predictive ability for incident T2DM of the sim-ple model and composite models, which include blood test results [11, 22]. Recently, a risk model for T2DM that included blood test results was proposed based on cohort data, and its reclassification ability
was significantly improved when glycated
hemoglobin (HbA1c) was included [11]. However,
HbA1c is not assessed in the routine health
examin-ation and this study did not consider reclassificexamin-ation ability when other blood test results apart from HbA1c were included in the T2DM risk model [23].
Therefore, in the present study, we aimed to iden-tify which of the TG-related indices that can be de-rived from general check-up data would improve the prediction ability of the simple T2DM risk model in middle-aged Koreans.
Methods Study population
The Korean Genome and Epidemiology Study
(KoGES) consists of a gene-environment model and population-based studies [24]. KoGES: Ansan and Ansung study is an ongoing prospective cohort study conducted in urban (Ansan) and rural (Ansung) areas in Korea with biennial follow-ups, which started in 2001. 10038 people underwent an initial examination, and 9001 subjects were included after exclusion of 1037 who refused to participate or died. Thirty-five participants were not suitable for the present study because of their age, and subjects with a history of diabetes at baseline or incomplete data were also excluded. Finally, 7708 people aged 40 to 69 years remained eligible for the current study. Written informed consent was obtained from all subjects. The Institutional Review Board of the Ko-rean Centers for Disease Control and Prevention ap-proved the study protocol.
Measurements and surveys
Height and weight were measured to the nearest 0.1 cm and 0.1 kg using a digital stadiometer and a scale, respectively. Resting blood pressure while sit-ting was measured by trained technicians using a standard mercury sphygmomanometer. Blood sam-ples were collected after fasting for at least 8 h. The Friedewald formula was used to indirectly estimate low-density lipoprotein cholesterol levels in subjects with plasma TG < 400 mg/dl [25]. Diabetes was de-fined by FPG > 126 mg/dl, 2 h post-challenge plasma glucose > 200 mg/dl, HbA1c> 6.5%, or prescription
socio-demographics, family history of diabetes, and lifestyle factors including smoking and alcohol con-sumption. The subjects’ smoking and alcohol con-sumption status was subdivided according to their past and present habits. Regular exercise was defined as subjects’ exercise was over 90 min as the sum of moderate and vigorous physical activity a day [27].
LAP and TyG index were calculated as follows:
LAP for men¼½WC cmð Þ‐65 TG mmolð =LÞ LAP for women¼½WC cmð Þ‐58 TG mmolð =LÞ
TyG index¼ ln TG mg½ ð =dlÞ FPG mgð =dlÞ=2
Statistical analysis
Data are expressed as numbers and proportions for discrete variables and mean ± SD for continuous vari-ables, and were analyzed using Chi-square and Student’s t-tests, respectively.
Based on the maximized Youden index, we calcu-lated sex-specific cut-off points of each index for T2DM. Multiple logistic regression analysis was con-ducted and adjusted for age, BMI, hypertensive sta-tus, family history of diabetes, current smoking and alcohol consumption status, and regular exercise. The basic model was derived from the published diabetes risk model for middle-aged Koreans and in-cluded the variables listed above [10, 11]. We tested multicollinearity for all covariates based on the vari-able inflation factor (VIF). The area under the re-ceiver operating characteristic curve (AROC) was calculated for each risk model of incident T2DM, in-dicating the diagnostic power of each model for inci-dent T2DM during the follow-up period [28]. Differences in AROC between the basic model and each composite model were analyzed using the method of DeLong et al. [29]. Pencina et al. have suggested category-based net reclassification provement (NRI) and integrated discrimination im-provement (IDI) for calculating the usefulness of a new marker in prediction models [30]. The category-based NRI measures the accuracy of sification based on how well the subjects are reclas-sified as upwards for events and downwards for non-events. However, the category-based NRI can be affected by the number and choice of categories [31]. The continuous (category-free) NRI (cNRI) is an ex-panded method to solve limitation of the categories. They also proposed the IDI that calculates the extent of average sensitivity and‘1-specificity’when a new marker is added to the basic model [30]. We calculated the cNRI and IDI to compare the prediction and reclassification abilities of each measure when added to the basic model of diabetes.
Macros were used to calculate cNRI and IDI, and data analysis was performed using SAS 9.4 and MedCalc [32].
Results
Baseline characteristics
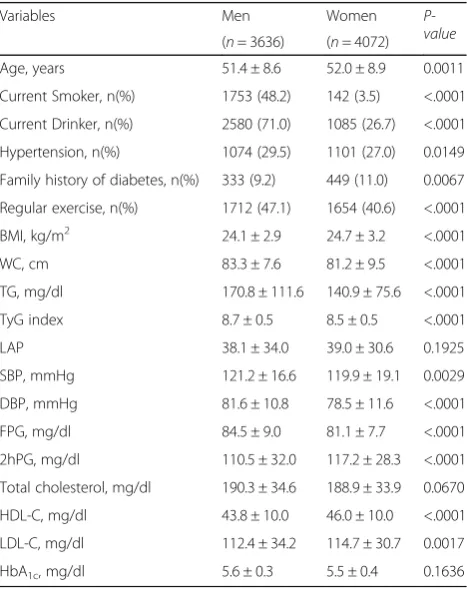
Table1indicates the baseline characteristics of the study subjects. The ages of the subjects were 51.4 ± 8.6 years for men and 52.0 ± 8.9 years for women. The prevalence of hypertension was higher in men than in women (29.5% vs. 27.0%,P= 0.0149). By contrast, the percentage of subjects with a family history of diabetes was higher in women than in men (11.0% vs. 9.2%, P= 0.0067). There were also significant differences in anthropomet-ric indices between sexes. Mean BMI and WC were 24.1 ± 2.9 kg/m2and 83.3 ± 7.6 cm in men, and 24.7 ± 3.2 kg/ m2and 81.2 ± 9.5 cm in women, respectively. Mean TG, FPG, LAP, and TyG index were 170.8 ± 111.6 mg/dl, 84.5 ± 9.0 mg/dl, 38.1 ± 34.0, and 8.7 ± 0.5 in men, and 140.9 ± 75.6 mg/dl, 81.1 ± 7.7 mg/dl, 39.0 ± 30.6, and 8.5 ± 0.5 in women, respectively. TG-related indices also showed significant differences between the sexes, with the exception of LAP.
Table 1Characteristics of the study population at baseline
Variables Men Women
P-value
(n= 3636) (n= 4072)
Age, years 51.4 ± 8.6 52.0 ± 8.9 0.0011
Current Smoker, n(%) 1753 (48.2) 142 (3.5) <.0001
Current Drinker, n(%) 2580 (71.0) 1085 (26.7) <.0001
Hypertension, n(%) 1074 (29.5) 1101 (27.0) 0.0149
Family history of diabetes, n(%) 333 (9.2) 449 (11.0) 0.0067
Regular exercise, n(%) 1712 (47.1) 1654 (40.6) <.0001
BMI, kg/m2 24.1 ± 2.9 24.7 ± 3.2 <.0001
WC, cm 83.3 ± 7.6 81.2 ± 9.5 <.0001
TG, mg/dl 170.8 ± 111.6 140.9 ± 75.6 <.0001
TyG index 8.7 ± 0.5 8.5 ± 0.5 <.0001
LAP 38.1 ± 34.0 39.0 ± 30.6 0.1925
SBP, mmHg 121.2 ± 16.6 119.9 ± 19.1 0.0029
DBP, mmHg 81.6 ± 10.8 78.5 ± 11.6 <.0001
FPG, mg/dl 84.5 ± 9.0 81.1 ± 7.7 <.0001
2hPG, mg/dl 110.5 ± 32.0 117.2 ± 28.3 <.0001
Total cholesterol, mg/dl 190.3 ± 34.6 188.9 ± 33.9 0.0670
HDL-C, mg/dl 43.8 ± 10.0 46.0 ± 10.0 <.0001
LDL-C, mg/dl 112.4 ± 34.2 114.7 ± 30.7 0.0017
HbA1c, mg/dl 5.6 ± 0.3 5.5 ± 0.4 0.1636
Pvalues are fromt-tests or chi-square tests for analysis of variance for continuous variables and categorical variables
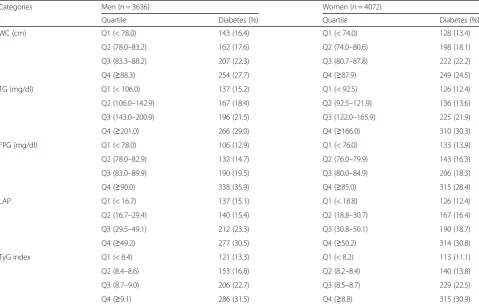
Incidence of T2DM according to each index category
During the 10 year follow-up, the overall cumula-tive incidence of T2DM was 21.1% (766 cases) in men and 19.6% (797 cases) in women. Table 2 shows the overall cumulative incidence of T2DM, categorized by quartiles for each index. In men, the cumulative incidences of T2DM across the quar-tiles of TyG index were (lowest-highest) 13.3 and 31.5% and those of FPG were 12.9 and 35.9% and those of WC were 16.4 and 27.7%. In women, the values for TyG index were 11.1 and 30.9% and those FPG were 13.9 and 28.4% and those WC were 13.4 and 24.5%. The increase in the cumula-tive incidence of T2DM with higher category of WC was less marked than that with increasing TyG index or FPG.
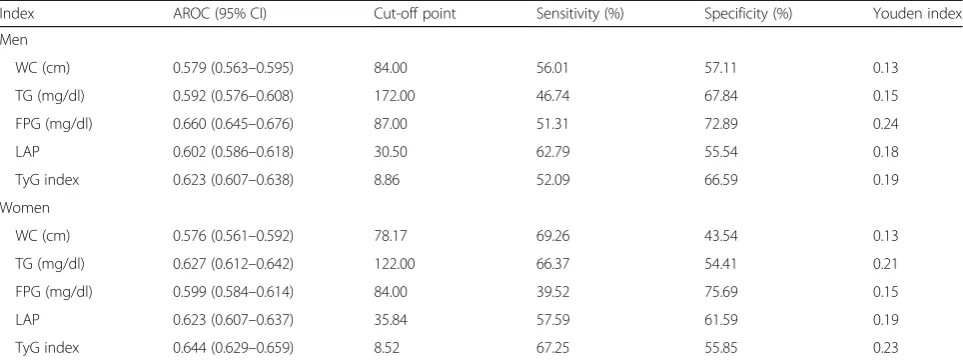
Cut-off points of each index for predicting T2DM
Table3shows the AROC values and cut-off points of the indices for predicting T2DM. The AROCs for WC, TG, FPG, LAP, and TyG index were 0.579, 0.592, 0.660, 0.602, and 0.623 in men 0.576, 0.627,
0.599, 0.623, and 0.644 in women respectively. The cut-off points for predicting T2DM were 84.00 cm, 172.00 mg/dl, 87.00 mg/dl, 30.50, and 8.86 in men and 78.17 cm, 122.00 mg/dl, 84.00 mg/dl, 35.84, and 8.52 in women for WC, TG, FPG, LAP, and TyG index, respectively.
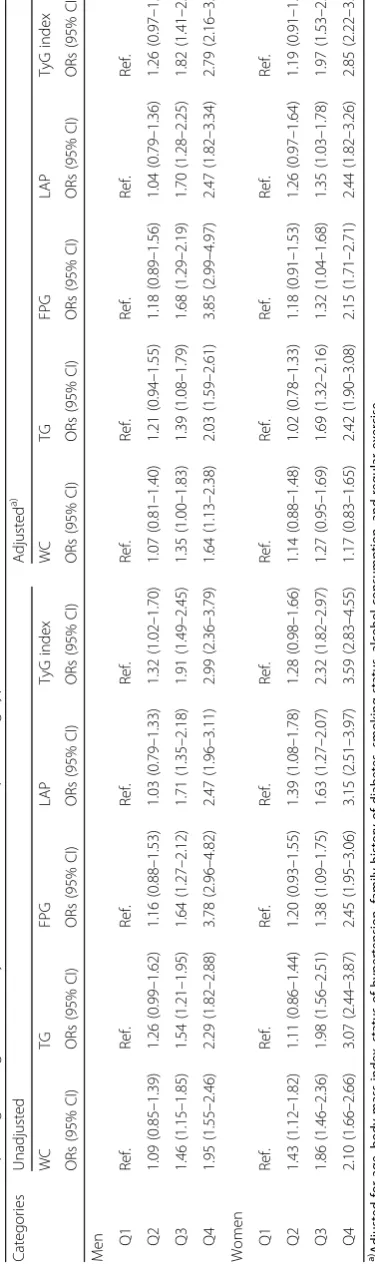
Odds ratios for incident T2DM for each composite predictive model
Table 4 shows the odds ratio (OR) for incident T2DM in higher quartiles compared to the first quartile of each index. The unadjusted ORs for all TG-related indices for incident T2DM were higher than that of WC. These trends were similar after ad-justment for age, BMI, hypertensive status, family history of diabetes, smoking, alcohol consumption status and regular exercise. When the highest quar-tile for each index was compared to the lowest, the adjusted ORs of WC, TG, FPG, LAP, and TyG index were 1.64 (95% confidence interval (CI), 1.13–2.38), 2.03 (1.59–2.61), 3.85 (2.99–4.97), 2.47 (1.82–3.34), and 2.79 (2.16–3.60) in men, and 1.17 (0.83–1.65),
Table 2Number of incident type 2 diabetes cases according to the quartiles for each measure
Categories Men (n = 3636) Women (n = 4072)
Quartile Diabetes (%) Quartile Diabetes (%)
WC (cm) Q1 (< 78.0) 143 (16.4) Q1 (< 74.0) 128 (13.4)
Q2 (78.0–83.2) 162 (17.6) Q2 (74.0–80.6) 198 (18.1)
Q3 (83.3–88.2) 207 (22.3) Q3 (80.7–87.8) 222 (22.2)
Q4 (≥88.3) 254 (27.7) Q4 (≥87.9) 249 (24.5)
TG (mg/dl) Q1 (< 106.0) 137 (15.2) Q1 (< 92.5) 126 (12.4)
Q2 (106.0–142.9) 167 (18.4) Q2 (92.5–121.9) 136 (13.6)
Q3 (143.0–200.9) 196 (21.5) Q3 (122.0–165.9) 225 (21.9)
Q4 (≥201.0) 266 (29.0) Q4 (≥166.0) 310 (30.3)
FPG (mg/dl) Q1 (< 78.0) 106 (12.9) Q1 (< 76.0) 133 (13.9)
Q2 (78.0–82.9) 132 (14.7) Q2 (76.0–79.9) 143 (16.3)
Q3 (83.0–89.9) 190 (19.5) Q3 (80.0–84.9) 206 (18.3)
Q4 (≥90.0) 338 (35.9) Q4 (≥85.0) 315 (28.4)
LAP Q1 (< 16.7) 137 (15.1) Q1 (< 18.8) 126 (12.4)
Q2 (16.7–29.4) 140 (15.4) Q2 (18.8–30.7) 167 (16.4)
Q3 (29.5–49.1) 212 (23.3) Q3 (30.8–50.1) 190 (18.7)
Q4 (≥49.2) 277 (30.5) Q4 (≥50.2) 314 (30.8)
TyG index Q1 (< 8.4) 121 (13.3) Q1 (< 8.2) 113 (11.1)
Q2 (8.4–8.6) 153 (16.8) Q2 (8.2–8.4) 140 (13.8)
Q3 (8.7–9.0) 206 (22.7) Q3 (8.5–8.7) 229 (22.5)
Q4 (≥9.1) 286 (31.5) Q4 (≥8.8) 315 (30.9)
2.42 (1.90–3.08), 2.15 (1.71–2.71), 2.44 (1.82–3.26), and 2.85 (2.22–3.66) in women, respectively. The calculated VIF for all covariates in the multivariate model, were below 5.0, indicating no severe multi-collinearity among covariates [33].
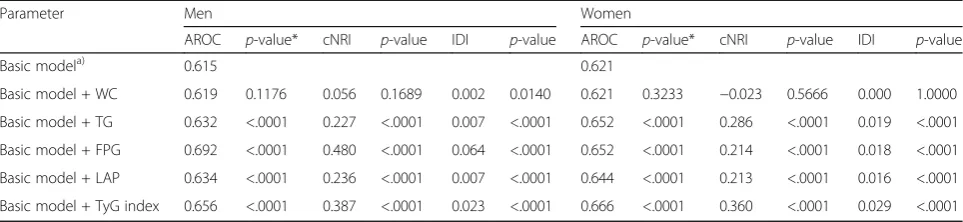
Effects of the addition of each index to the basic model of T2DM on cNRI, IDI, and AROC
Table 5 shows the reclassification and discrimination abilities when each measure was added to the basic model of diabetes. The AROCs for the addition of TyG index or FPG to the basic model were larger than those for the other indices in both sexes. The cNRI for TG, FPG, LAP, and TyG index were 22.7% (P< 0.0001), 48.0% (P< 0.0001), 23.6% (P< 0.0001), and 38.7% (P< 0.0001) in men, and 28.6% (P< 0.0001), 21.3% (P< 0.0001), 21.3% (P< 0.0001), and 36.0% (P< 0.0001) in women, respectively. By con-trast, the addition of WC made cNRI only 5.6% (P= 0.1689), in men and−2.3% (P= 0.5666), in women. The IDI was also higher when TG-related indices or FPG was added than when WC was added to the basic model of T2DM in both sexes.
Discussion
We showed that the predictive ability of the simple T2DM risk model was increased when TG-related indices or FPG was added. Recently, several dia-betes risk models have been proposed to screen high-risk groups, some of which included blood pa-rameters. WC was included as one of the compo-nents in the model because increased WC increases T2DM risk [8]. However, WC is not easily used in
practice because of measurement inaccuracy [34]. Among the TG-related indices analyzed in the present study, the AROC and reclassification ability of TyG index were higher than for TG or LAP. Although the inclusion of LAP also improved the predictive ability of the risk model for incident dia-betes, this required the additional inclusion of WC, while this was not required to demonstrate im-provements in the risk model by the inclusion of TG or TyG index [20]. Most studies that used TyG index to predict incident T2DM used it as a surro-gate for insulin resistance, and reported that its predictive ability is better than that of the homeo-stasis model of assessment (HOMA-IR) [19, 35, 36]. However, Abbasi and Reaven showed that the cor-relation between insulin-mediated glucose uptake (IMGU) and TyG index is not better than that be-tween IMGU and TG or HOMA-IR [37, 38]. Never-theless, it was noted that TyG index is a practical measure for use in T2DM prediction because of its cost-efficiency [37]. Moreover, the use of HbA1c
has been recommended for diagnosis and screening of patients. Lim et al. added HbA1c to a diabetes
risk model and demonstrated an increase in pre-dictive ability for T2DM in a middle-aged Korean cohort, while Ahn et al. also demonstrated through longitudinal validation analysis that adding FPG or HbA1c to the simple diabetes risk model also
im-proves its predictive ability [11, 22]. Thus, in gen-eral, the predictive ability of a diabetes risk model that includes laboratory parameters such as TG, FPG, or HbA1c is better than that of the simple
diabetes risk model [11, 14, 22].
Table 3The area under the ROC curve (AROC) and cut-off points for indices to predict type 2 diabetes
Index AROC (95% CI) Cut-off point Sensitivity (%) Specificity (%) Youden index
Men
WC (cm) 0.579 (0.563–0.595) 84.00 56.01 57.11 0.13
TG (mg/dl) 0.592 (0.576–0.608) 172.00 46.74 67.84 0.15
FPG (mg/dl) 0.660 (0.645–0.676) 87.00 51.31 72.89 0.24
LAP 0.602 (0.586–0.618) 30.50 62.79 55.54 0.18
TyG index 0.623 (0.607–0.638) 8.86 52.09 66.59 0.19
Women
WC (cm) 0.576 (0.561–0.592) 78.17 69.26 43.54 0.13
TG (mg/dl) 0.627 (0.612–0.642) 122.00 66.37 54.41 0.21
FPG (mg/dl) 0.599 (0.584–0.614) 84.00 39.52 75.69 0.15
LAP 0.623 (0.607–0.637) 35.84 57.59 61.59 0.19
TyG index 0.644 (0.629–0.659) 8.52 67.25 55.85 0.23
The advantages of the simple diabetes risk model are that it is inexpensive and patients can use it for self-assessment [8]. Weighed against the improved predictive accuracy obtained by the addition of HbA1c
and the Oral Glucose Tolerance Test (OGTT) to the T2DM risk model, there are substantial practical con-straints on screening the whole population using such measurements [22]. As an effective alternative, a two-pronged approach to screening has been pro-posed [22, 39]. This approach consists of using the non-laboratory score for the general population and using the laboratory score for patients in a higher-risk group for T2DM. For screening as part of the Korean NHI program, TG-related indices or FPG are more suitable as one of the components of the T2DM risk model than OGTT or HbA1c, given that these
mea-surements are not currently included in primary screening measurements in Korea [23]. To the best of our knowledge, there is no TyG index criterion yet. On the other hand, several studies conducted in Europe and Asian have shown that the risk of inci-dent T2DM was increased with increasing TyG index [40–42]. Some researchers have proposed a cut-off value of TyG index of 8.8 for incident T2DM and in-sulin resistance [41, 42]. The subjects in the present study were classified by the cut-off value of TyG index of 8.8. The adjusted odds ratio (95% CI) of in-cident T2DM in the subjects with TyG index ≥8.8 was 1.95 (1.73–2.20) compared to the counterparts. We also have proposed sex-specific cut-off points of TyG index (≥ 8.86 in men, ≥ 8.52 in women) as pre-dictors of T2DM based on the maximized Youden index. Compared to the counterparts, the adjusted odds ratio (95% CI) of incident T2DM in the men with TyG index ≥8.86 and in the women with TyG index ≥8.52 were 2.01 (1.69–2.39) and 2.16 (1.82– 2.56), respectively (Appendix 1). Considering NIH’s
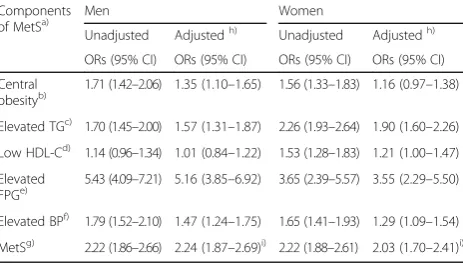
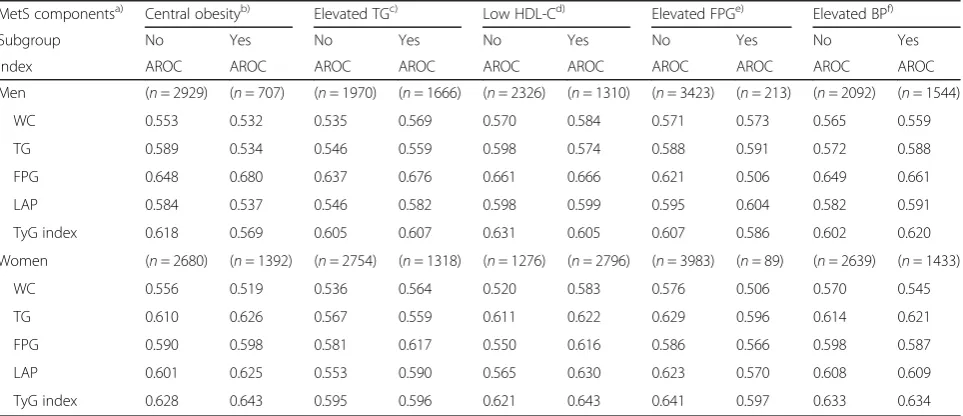
universe coverage, the health promotion that offered the general health check-ups for 17.6 million Koreans in 2016, and its following examination rate (77.7%), there should be less burden caused by blood tests than other countries [43]. Therefore, TyG index is recommended as a screening tool for the prediction of T2DM. Although TyG index predicts incident T2DM well, its usefulness is inconsistent, when com-pared to fasting glucose [38, 44]. For predicting T2DM risk, TyG index was not better than FPG or OGTT in Isfahan Diabetes Prevention Study [38]. Wang et al. reported that TyG index, LAP, and vis-ceral adiposity were not superior to FPG or WC alone as diabetes predictors among Chinese [44]. In the Vascular-Metabolic CUN cohort, Navarro-Gonzalez et al. compared the prediction ability of TyG index and FPG for onset T2DM [35]. Association between indexes and their discrimination for onset T2DM were different de-pending on the fasting glucose subgroup. When the highest quartile for each index was compared to the lowest, the hazard ratios (HRs) of TyG index and FPG were 3.0 and 7.3 in the impaired fasting glucose group. On the other hand, TyG index showed stron-ger association with onset DM than FPG in the nor-mal fasting glucose group (HRs: 6.8 vs. 4.6). The discrimination of TyG index for onset T2DM was also better than that of FPG in the normal fasting glucose group (AROC: 0.75 vs. 0.66). In the present study, we found the association between some meta-bolic syndrome (MetS) components and incident T2DM (Appendix 2). Therefore, we compared the discrimination of each index for incident T2DM in the stratified MetS components (Appendix 3). In the elevated FPG group, the discrimination of FPG (AROC: 0.506) for incident T2DM was inferior to that of other indices. On the other hand, TyG index was a more robust discrimination index than other
Table 5Reclassification and discrimination results associated with the risk prediction of incident type 2 diabetes according to each measure
Parameter Men Women
AROC p-value* cNRI p-value IDI p-value AROC p-value* cNRI p-value IDI p-value
Basic modela) 0.615 0.621
Basic model + WC 0.619 0.1176 0.056 0.1689 0.002 0.0140 0.621 0.3233 −0.023 0.5666 0.000 1.0000
Basic model + TG 0.632 <.0001 0.227 <.0001 0.007 <.0001 0.652 <.0001 0.286 <.0001 0.019 <.0001
Basic model + FPG 0.692 <.0001 0.480 <.0001 0.064 <.0001 0.652 <.0001 0.214 <.0001 0.018 <.0001
Basic model + LAP 0.634 <.0001 0.236 <.0001 0.007 <.0001 0.644 <.0001 0.213 <.0001 0.016 <.0001
Basic model + TyG index 0.656 <.0001 0.387 <.0001 0.023 <.0001 0.666 <.0001 0.360 <.0001 0.029 <.0001 a)
Basic model: age, body mass index, status of hypertension, family history of diabetes, smoking status, alcohol consumption, and regular exercise *P-value for AROC means vs. Basic model
indices in the group stratified by sex and MetS com-ponents. Our findings indicate that TyG index is not only a better predictor for incident diabetes than WC, LAP, and TG, but it also has a better reclassification ability. On the other hand, association between FPG and its(their) reclassification ability for incident T2DM were different depending on sex. The present study used community-based long-term prospective cohort data. Therefore, the temporal relationship be-tween each measure and incident diabetes is clear. Our findings indicate that TyG index is not only a better predictor for incident diabetes than WC, LAP, and TG, but it also has a better reclassification abil-ity. It was also noted that association between FPG and its reclassification ability for incident T2DM were different depending on sex. There were, however, a few limitations to this study. Firstly, even though KoGES is designed to include subjects who live both in rural and urban areas, the data are not representa-tive of the entire Korean population [45]. Secondly, dietary intake was not included in the analysis. More-over, Baik et al. had reported that the usefulness of dietary information in cardiovascular disease risk pre-diction models [46]. However, dietary information has been excluded from the questionnaire in medical check since 2009. Finally, our results were not vali-dated using a separate Korean dataset. Therefore, additional studies are required to validate our data.
Conclusions
In conclusion, TG-related indices and FPG were more accurate than WC in the prediction of incident T2DM. In the subgroup categorized by sex and fast-ing glucose level, TyG index was a more robust pre-dictor for onset T2DM than other indexes. Therefore, TyG index can be a useful screening tool for incident T2DM in middle-aged Koreans.
Appendix 1
Table 6Multiple logistic regression analyses for cutoff-points of TyG index in predicting type 2 diabetes (odds ratios and 95% confidence intervals)
Cutoff-points
Men Women
Unadjusted Adjusteda) Unadjusted Adjusteda)
ORs (95% CI) ORs (95% CI) ORs (95% CI) ORs (95% CI)
TyG index
≥8.8b) 2.05 (1.75–2.41) 1.93 (1.62–2.29) 2.41 (2.05–2.83) 2.03 (1.71–2.41)
TyG index
≥8.86/8.52c)
2.13 (1.82–2.51) 2.01 (1.69–2.39) 2.57 (2.18–3.02) 2.16 (1.82–2.56)
a)Adjusted for age, body mass index, status of hypertension, family history of
diabetes, smoking status, alcohol consumption, and regular exercise,b)TyG
index≥8.8 cm, Lee et al. [42],c)TyG index≥8.86 cm for men≥8.52 for
women in the present study
Abbreviations:ORsodds ratios; TyG index, the product of fasting glucose and triglycerides
Appendix 2
Table 7Multiple logistic regression analyses for each MetS component in predicting type 2 diabetes (odds ratios and 95% confidence intervals)
Components
of MetSa) Men Women
Unadjusted Adjustedh) Unadjusted Adjustedh)
ORs (95% CI) ORs (95% CI) ORs (95% CI) ORs (95% CI)
Central
obesityb) 1.71 (1.42–2.06) 1.35 (1.10–1.65) 1.56 (1.33–1.83) 1.16 (0.97–1.38)
Elevated TGc) 1.70 (1.45–2.00) 1.57 (1.31–1.87) 2.26 (1.93–2.64) 1.90 (1.60–2.26)
Low HDL-Cd) 1.14 (0.96–1.34) 1.01 (0.84–1.22) 1.53 (1.28–1.83) 1.21 (1.00–1.47)
Elevated
FPGe) 5.43 (4.09–7.21) 5.16 (3.85–6.92) 3.65 (2.39–5.57) 3.55 (2.29–5.50)
Elevated BPf) 1.79 (1.52–2.10) 1.47 (1.24–1.75) 1.65 (1.41–1.93) 1.29 (1.09–1.54)
MetSg) 2.22 (1.86–2.66) 2.24 (1.87–2.69)i) 2.22 (1.88–2.61) 2.03 (1.70–2.41)i) a)
Modified NCEP-ATP III criteria [47] with the Korean cut-off for WC,b)WC≥ 90 cm for men≥85 for women, Lee et al. [48],c)TG≥150 mg/dl,d)HDL-C <
40 mg/dl for men < 50 mg/dl for women,e)FPG≥100 mg/dl,f)Systolic blood
pressure≥130 mmHg or diastolic blood pressure≥85 mmHg,g)Number of
MetS components≥3,h)Adjusted for other components of MetS, age,
family history of diabetes, smoking status, alcohol consumption, and regular exercise,i)Adjusted for age, family history of diabetes, smoking status, alcohol consumption, and regular exercise
Abbreviations
AROC:Area under the receiver operating characteristic curve; BMI: Body mass index; CI: Confidence interval; cNRI: Continuous net reclassification improvement; FPG: Fasting plasma glucose; HbA1c: Glycated hemoglobin;
HRs: Hazard ratios; IDI: Integrated discrimination improvement; IMGU: Insulin-mediated glucose uptake; KNHANES: Korea National Health and Nutrition Examination; KNIH: Korea National Institute of Health; KoGES: Korean Genome and Epidemiology Study; LAP: Lipid accumulation product; NHI: National Health Insurance; OGTT: Oral Glucose Tolerance Test; ORs: Odds ratios; T2DM: Type 2 diabetes mellitus; TG: Triglyceride; TyG index: Product of fasting glucose and triglyceride; VIF: Variable inflation factor; WC: Waist circumference
Acknowledgements
Epidemiologic data used in this study were from the Korean Genome and Epidemiology Study (KoGES) of the Korea Centers for Disease Control & Prevention, Republic of Korea.
Funding
This study was supported by an intramural grant of the Korea National Institute of Health, Korea 4800–4845-302 (2017-NI63001–00). The funders had no role in the design of the study and collection, analysis, and interpretation of data and in writing the manuscript.
Availability of data and materials
The information of KoGES can be obtained at [http://www.nih.go.kr/NIH/ eng/main.jsp> Research infrastructure > KoGES]. The detailed cohort profile and how to access the data are described in the following source: KIM YJ, Han BG, KoGES group. Cohort profile: the Korean genome and epidemiology study (KoGES) Consortium. International journal of epidemiology, 2016, 46.2: e20-e20. The data that support the findings of this study are available from the Korea National Institute of Health (KNIH) but restrictions apply to the availability of these data. Data can be accessible upon reasonable request and with ap-proval of a designated research proposal review committee of the KNIH.
Authors’contributions
JWL carried out the data analysis and wrote the manuscript. NKL contributed to study design and advised statistical analyses. HYP contributed to study design and critically reviewed the paper. All authors read and approved the final manuscript.
Ethics approval and consent to participate
The Institutional Review Board of the Korean Centers for Disease Control and Prevention approved the KoGES protocol. Written informed consent was obtained from all subjects.
Competing interests
The authors declare that they have no competing interest.
Publisher’s Note
Springer Nature remains neutral with regard to jurisdictional claims in published maps and institutional affiliations.
Author details
1
Division of Cardiovascular Diseases, Center for Biomedical Sciences, Korea National Institute of Health, 187 Osongsaengmyeng 2-ro, Osong-eup, Heungdeok-gu, Cheongju-si, Chungcheongbuk-do 361-951, South Korea. 2Department of Public Health Sciences, Graduate School, Korea University, Seoul, South Korea.
Received: 18 July 2017 Accepted: 16 May 2018
References
1. Esteghamati A, Gouya MM, Abbasi M, Delavari A, Alikhani S, Alaedini F, Safaie A, Forouzanfar M, Gregg EW. Prevalence of diabetes and impaired fasting glucose in the adult population of Iran: National Survey of risk factors for non-communicable diseases of Iran. Diabetes Care. 2008; 31(1):96–8.
2. Kim DJ. The epidemiology of diabetes in Korea. Diabetes Metab J. 2011; 35(4):303–8.
3. Ministry of Health and Welfare of Korea KCfDCaP. Korea health statistics 2011: Korea National Health and Nutrition Examination Survey (KNHANES V-2). Seoul: Ministry of Health and Welfare of Korea; 2012.
4. Ministry of Health and Welfare of Korea KCfDCaP. Korea health statistics 2014: Korea National Health and Nutrition Examination Survey (KNHANES VI-2). Sejong: Ministry of Health and Welfare of Korea; 2015.
5. Federation ID. IDF Diabetes Atlas. 7th ed; 2015. Appendix 3
Table 8The area under the ROC curve (AROC) for indices to predict type 2 diabetes stratified by MetS components
MetS componentsa) Central obesityb) Elevated TGc) Low HDL-Cd) Elevated FPGe) Elevated BPf)
Subgroup No Yes No Yes No Yes No Yes No Yes
Index AROC AROC AROC AROC AROC AROC AROC AROC AROC AROC
Men (n= 2929) (n= 707) (n= 1970) (n= 1666) (n= 2326) (n= 1310) (n= 3423) (n= 213) (n= 2092) (n= 1544)
WC 0.553 0.532 0.535 0.569 0.570 0.584 0.571 0.573 0.565 0.559
TG 0.589 0.534 0.546 0.559 0.598 0.574 0.588 0.591 0.572 0.588
FPG 0.648 0.680 0.637 0.676 0.661 0.666 0.621 0.506 0.649 0.661
LAP 0.584 0.537 0.546 0.582 0.598 0.599 0.595 0.604 0.582 0.591
TyG index 0.618 0.569 0.605 0.607 0.631 0.605 0.607 0.586 0.602 0.620
Women (n= 2680) (n= 1392) (n= 2754) (n= 1318) (n= 1276) (n= 2796) (n= 3983) (n= 89) (n= 2639) (n= 1433)
WC 0.556 0.519 0.536 0.564 0.520 0.583 0.576 0.506 0.570 0.545
TG 0.610 0.626 0.567 0.559 0.611 0.622 0.629 0.596 0.614 0.621
FPG 0.590 0.598 0.581 0.617 0.550 0.616 0.586 0.566 0.598 0.587
LAP 0.601 0.625 0.553 0.590 0.565 0.630 0.623 0.570 0.608 0.609
TyG index 0.628 0.643 0.595 0.596 0.621 0.643 0.641 0.597 0.633 0.634
a)
Modified NCEP-ATP III criteria [47] with the Korean cut-off for WC,b)
WC≥90 cm for men≥85 for women, Lee et al. [48],c)
TG≥150 mg/dl,d)
HDL-C < 40 mg/dl for men < 50 mg/dl for women,e)
FPG≥100 mg/dl,f)
Systolic blood pressure≥130 mmHg or diastolic blood pressure≥85 mmHg
6. Li G, Zhang P, Wang J, An Y, Gong Q, Gregg EW, Yang W, Zhang B, Shuai Y, Hong J. Cardiovascular mortality, all-cause mortality, and diabetes incidence after lifestyle intervention for people with impaired glucose tolerance in the Da Qing diabetes prevention study: a 23-year follow-up study. Lancet Diabetes Endocrinol. 2014;2(6):474–80.
7. Tuomilehto J, Schwarz P, Lindström J. Long-term benefits from lifestyle interventions for type 2 diabetes prevention time to expand the efforts. Diabetes Care. 2011;34(Supplement 2):S210–4.
8. Noble D, Mathur R, Dent T, Meads C, Greenhalgh T. Risk models and scores for type 2 diabetes: systematic review. Bmj. 2011;343:d7163.
9. Chien K, Cai T, Hsu H, Su T, Chang W, Chen M, Lee Y, Hu F. A prediction model for type 2 diabetes risk among Chinese people. Diabetologia. 2009; 52(3):443–50.
10. Lee Y-H, Bang H, Kim HC, Kim HM, Park SW, Kim DJ. A simple screening score for diabetes for the Korean population development, validation, and comparison with other scores. Diabetes Care. 2012;35(8):1723–30. 11. Lim N-K, Park S-H, Choi S-J, Lee K-S, Park H-Y. A risk score for predicting the
incidence of type 2 diabetes in a middle-aged Korean cohort. Circ J. 2012; 76(8):1904–10.
12. Lindström J, Tuomilehto J. The diabetes risk score. Diabetes Care. 2003;26(3): 725–31.
13. Mann DM, Bertoni AG, Shimbo D, Carnethon MR, Chen H, Jenny NS, Muntner P. Comparative validity of 3 diabetes mellitus risk prediction scoring models in a multiethnic US cohort the multi-ethnic study of atherosclerosis. Am J Epidemiol. 2010;171(9):980–8.
14. Wilson PW, Meigs JB, Sullivan L, Fox CS, Nathan DM, D’Agostino RB. Prediction of incident diabetes mellitus in middle-aged adults: the Framingham offspring study. Arch Intern Med. 2007;167(10):1068–74. 15. Consultation WE: Waist circumference and waist-hip Ratio 2011.
16. Ko G, Chan J, Woo J, Lau E, Yeung V, Chow C, Wai H, Li J, So W, Cockram C: Simple anthropometric indexes and cardiovascular risk factors in Chinese. Int J Obes Relat Metab Disord 1997, 21(11):995–1001.
17. Janghorbani M, Amini M. Normal fasting plasma glucose and risk of prediabetes and type 2 diabetes: the Isfahan diabetes prevention study. Rev Diabet Stud. 2011;8(4):490.
18. Zhang M, Gao Y, Chang H, Wang X, Liu D, Zhu Z, Huang G.
Hypertriglyceridemic-waist phenotype predicts diabetes: a cohort study in Chinese urban adults. BMC Public Health. 2012;12(1):1081.
19. Lee S-H, Kwon H-S, Park Y-M, Ha H-S, Jeong SH, Yang HK, Lee J-H, Yim H-W, Kang M-I, Lee W-C. Predicting the development of diabetes using the product of triglycerides and glucose: the Chungju metabolic disease cohort (CMC) study. PLoS One. 2014;9(2):e90430.
20. Kahn HS. The lipid accumulation product is better than BMI for identifying diabetes a population-based comparison. Diabetes Care. 2006;29(1):151–3. 21. Song YJ. The south Korean health care system. JMAJ. 2009;52(3):206–9. 22. Ahn CH, Yoon JW, Hahn S, Moon MK, Park KS, Cho YM. Evaluation of
non-laboratory and non-laboratory prediction models for current and future diabetes mellitus: a cross-sectional and retrospective cohort study. PLoS One. 2016; 11(5):e0156155.
23. Korean National Health Insurance Service:National Health Insurance [http://www.nhis.or.kr/static/html/wbd/g/a/wbdga0606.html]. 24. Kim Y, Han B-G. Cohort profile: the Korean genome and epidemiology
study (KoGES) consortium. Int J Epidemiol. 2016;46(2):e20–e20.
25. Friedewald WT, Levy RI, Fredrickson DS. Estimation of the concentration of low-density lipoprotein cholesterol in plasma, without use of the preparative ultracentrifuge. Clin Chem. 1972;18(6):499–502.
26. Association AD. Diagnosis and classification of diabetes mellitus. Diabetes Care. 2010;33(Supplement 1):S62–9.
27. Park SK, Ryoo J-H, Oh C-M, Choi J-M, Choi Y-J, Lee KO, Jung JY. The risk of type 2 diabetes mellitus according to 2-hour plasma glucose level: the Korean genome and epidemiology study (KoGES). Diabetes Res Clin Pract. 2017.
https://www.ncbi.nlm.nih.gov/pubmed/?term=The+risk+of+type+2+diabetes +mellitus+according+to+2-hour+plasma+glucose+level%3A+the+Korean +genome+and+epidemiology+study.
28. Zweig MH, Campbell G. Receiver-operating characteristic (ROC) plots: a fundamental evaluation tool in clinical medicine. Clin Chem. 1993;39(4):561–77. 29. DeLong ER, DeLong DM, Clarke-Pearson DL. Comparing the areas under
two or more correlated receiver operating characteristic curves: a nonparametric approach. Biometrics. 1988;44(3):837–45.
30. Pencina MJ, D'Agostino RB, D'Agostino RB, Vasan RS. Evaluating the added predictive ability of a new marker: from area under the ROC curve to reclassification and beyond. Stat Med. 2008;27(2):157.
31. Pencina MJ, D'Agostino RB, Steyerberg EW. Extensions of net reclassification improvement calculations to measure usefulness of new biomarkers. Stat Med. 2011;30(1):11–21.
32. Kennedy K, Pencina M. A SAS macro to compute added predictive ability of new markers predicting a dichotomous outcome. In: SouthEeast SAS Users Group Annual Meeting Proceedings: 2010; 2010.
33. Vatcheva KP, Lee M, McCormick JB, Rahbar MH. Multicollinearity in regression analyses conducted in epidemiologic studies. Epidemiol. 2016; 6(227).https://doi.org/10.4172/2161-1165.1000227.https://www.omicsonline. org/open-access/multicollinearity-in-regression-analyses-conducted-in-inepidemiologic-studies-2161-1165-1000227.php?aid=69442. 34. Sebo P, Beer-Borst S, Haller DM, Bovier PA. Reliability of doctors'
anthropometric measurements to detect obesity. Prev Med. 2008;47(4): 389–93.
35. Navarro-González D, Sánchez-Íñigo L, Pastrana-Delgado J, Fernández-Montero A, Martinez JA. Triglyceride–glucose index (TyG index) in comparison with fasting plasma glucose improved diabetes prediction in patients with normal fasting glucose: the vascular-metabolic CUN cohort. Prev Med. 2016;86:99–105.
36. Vasques ACJ, Novaes FS, MdS d O, JRM S, Yamanaka A, Pareja JC, Tambascia MA, MJA S, Geloneze B. TyG index performs better than HOMA in a Brazilian population: a hyperglycemic clamp validated study. Diabetes Res Clin Pract. 2011;93(3):e98–e100.
37. Abbasi F, Reaven G. Statin-induced diabetes: how important is insulin resistance? J Intern Med. 2015;277(4):498–500.
38. Janghorbani M, Almasi SZ, Amini M. The product of triglycerides and glucose in comparison with fasting plasma glucose did not improve diabetes prediction. Acta Diabetol. 2015:1–8.
39. Wannamethee S, Papacosta O, Whincup P, Thomas M, Carson C, Lawlor D, Ebrahim S, Sattar N. The potential for a two-stage diabetes risk algorithm combining laboratory-based scores with subsequent routine non-fasting blood tests: results from prospective studies in older men and women. Diabet Med. 2011;28(1):23–30.
40. Zheng R, Mao Y. Triglyceride and glucose (TyG) index as a predictor of incident hypertension: a 9-year longitudinal population-based study. Lipids Health Dis. 2017;16(1):175.
41. Navarro-González D, Sánchez-Íñigo L, Fernández-Montero A, Pastrana-Delgado J, Martinez JA. TyG index change is more determinant for forecasting type 2 diabetes onset than weight gain. Medicine. 2016;95(19) 42. Lee DY, Lee ES, Kim JH, Park SE, Park C-Y, Oh K-W, Park S-W, Rhee E-J, Lee W-Y. Predictive value of triglyceride glucose index for the risk of incident diabetes: a 4-year retrospective longitudinal study. PLoS One. 2016;11(9): e0163465.
43. National Health Insurance Service. 2016 National health screening statistical yearbookhttp://www.nhis.or.kr/menu/boardRetriveMenuSet.xx?menuId=F3328. 44. Wang B, Zhang M, Liu Y, Sun X, Zhang L, Wang C, Linlin L, Ren Y, Han C,
Zhao Y. Utility of three novel insulin resistance-related lipid indexes for predicting type 2 diabetes mellitus among people with normal fasting glucose in rural China. J Diab. 2018.https://www.ncbi.nlm.nih.gov/pubmed/ 29322661.
45. Shin C, Abbott R, Lee H, Kim J, Kimm K. Prevalence and correlates of orthostatic hypotension in middle-aged men and women in Korea: the Korean health and genome study. J Hum Hypertens. 2004;18(10):717–23. 46. Baik I, Cho N, Kim S, Shin C. Dietary information improves cardiovascular
disease risk prediction models. Eur J Clin Nutr. 2013;67(1):25.
47. Third Report of the National Cholesterol Education Program.(NCEP) expert panel on detection, evaluation, and treatment of high blood cholesterol in adults (adult treatment panel III) final report. Circulation. 2002;106(25): 3143–421.