www.nat-hazards-earth-syst-sci.net/7/177/2007/ © Author(s) 2007. This work is licensed under a Creative Commons License.
and Earth
System Sciences
Field observations of the 17 July 2006 Tsunami in Java
F. Lavigne1, C. Gomez1, M. Giffo1, P. Wassmer1, C. Hoebreck1, D. Mardiatno2, J. Prioyono2, and R. Paris3
1Laboratoire de G´eographie Physique, UMR CNRS 8591, Meudon, France 2Research Center for Disasters, University Gadjah Mada, Indonesia 3G´eolab UMR 6042 CNRS, Clermont-Ferrand, France
Received: 9 October 2006 – Revised: 19 January 2007 – Accepted: 19 January 2007 – Published: 9 February 2007
Abstract. The 17 July 2006, a tsunami struck the southern coast of Java, Indonesia, causing over 730 casualties. The triggering earthquake located 225 km off the coast of Pan-gandaran (9.222◦S, 107.320◦E), occurred at 15:19 LT (UTC +7) with a 7.7 magnitude on the Richter scale (Harward Cen-ter and CEA/DAM). In order to calibrate numerical models and understand the phenomenon, we conducted a 6-weeks field survey in July and August 2006 from Cimerak district in West Java to Gunung Kidul district in Central Java. Data collection involved measurements of wave height before its breaking, flow depth, run-up height, inundation depth, flow directions and a detailed chronology of the tsunami.
Eyewitnesses accounted for three main waves. The max-imum height of the second wave ranged from 4.2 to 8.6 m before its breaking. Maximum flow depth after the wave’s breaking reached 5 m, and maximum runup heights reached 15.7 m. Our run-up values are about 1.5 higher than those obtained by the other field surveys carried out until present. They are also higher than the values computed through pre-liminary models.
The 17 July 2006 tsunami has been generated by a “tsunami earthquake”, i.e. an earthquake of low or medium scale that triggers a tsunami of high magnitude. The run-up heights progressively decreased eastwards, which is consis-tent with a tsunami triggered by fault dislocation, as the one that hit the Nicaragua’s coast with similar run-up heights on the 2 September 1992. An earthquake with associated land-slides could also have generated the 17 July 2006 tsunami, as ever observed in Papua-New-Guinea in 1998.
Correspondence to: F. Lavigne ([email protected])
1 Introduction
A tsunami is an exceptional marine event characterised by high energy waves triggered by an earthquake, a volcanic eruption, or a submarine landslide (Fryer et al., 2003; Fine et al., 2004; Maramai et al., 2004; Tinti et al., 2005; An-drade et al., 2006). Around 75% of the Indonesian coastline is under threat from tsunamis. According to the NOAA (Na-tional Oceanic and Atmospheric Administration), during the last 450 years tsunamis have taken more than 470 000 lives worldwide. The 26 December 2004 tsunami itself caused 230 000 casualties, including 170 000 in Indonesia.
The recent tsunami disaster struck the southern coast of Java on 17 July 2006 (Fig. 1a). At the begin-ning of August, the Indonesian Ministry of Health re-ported that approximately 668 people died, 65 were missing and 9299 were in-treatment as a result of the disaster (http://www.searo.who.int/LinkFiles/Indonesia - Emergency Situation Report ESR 11 3 Aug-06.pdf). At Pangandaran, the tsunami’s intensity ranked 5 (very strong) on the Sieberg and Ambraseys’ scale (Ambraseys, 1962), and between IX and X (destructive to very destructive) on the Pa-padopoulos and Imamura’s scale (2001).
According to the USGS and the French CEA-DASE, this event was triggered by a 7.7 magnitude earthquake on the Richter scale that occurred at 8:19 GMT, 15:19 LT. The epi-centre (9.222◦S, 107.320◦E) was located 34 km deep below the South of Pangandaran coastal resort (USGS).
0 4 8 C
Indian Ocean
B A 16h19 16h20 16h18 16h30 8°S 7°S 6°S 5°S 9°S107°E 109°E 111°E 113°E
0246651 0224019
Kebongcar ik
0245688 0288131
Widar a P
ayung
0322425 0330502 0343556 0398353 0406612 0425508 0266496 0266373
0239071 0236545
YOGYAKARTA KEBUMEN
PANGANDARAN CILACAP PURWOREJO
Glagah Per
misan Cilacap city
Run
up height (m a.s
.l)
0 1 2 km Kar
angbolong Keta wang Congot Bugel Samas Keb uruhan Baron Kukup Krakal 0456281 0450304 0452000 0418958 0393525 0380163 0308560 0297234 Bunton
0262066 0252616
Longitude UTM49 (m)
0 20 40 km
0242457 0241405 0240312 Kar angsar i
0 100 200 km Village
0331550
Pur ing
0378139
Longitude UTM49 (m)
Earthquake location (m = 7.7)
Direction of the tsunami wave propagation
Pertamina PLTU 12 16
Indian Ocean
Pangandaran Bay Pangandaran Pananjung Par angtr itisJAVA
16h19 Arrival time of the tsunami
Ayah Nusa Kambangan Batukar as Krap yak
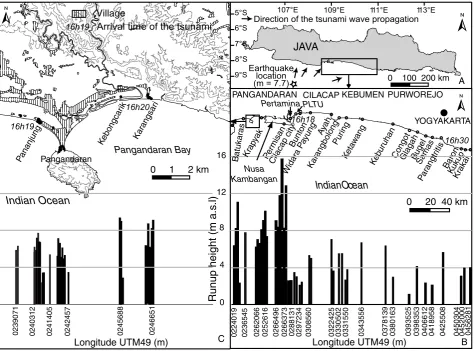
Fig. 1. Runup heights distribution of the 17 July 2006 tsunami along the south coast of Java. (A) Location of the field study in Java with indication of the 17 July 2004 earthquake epicentre. (B) Runup heights distribution and arrival time at selected spots along the Javanese coastline. (C) Zoom at the Pangandaran district.
2 Methods
We carried out 152 measurements of wave height before its breaking (i.e. height of the tsunami bore), run-up height and flow-depth distribution along the affected coastline (Sup-plement File: http://www.nat-hazards-earth-syst-sci.net/7/ 177/2007/nhess-7-177-2007-supplement.pdf). The run-up height is defined as the maximum vertical elevation of a point located on initially dry land that is inundated by the waves (Synolakis et al., 2005). The flow depth is measured from the ground. Using a laser range finder (LaserAce 300), we mea-sured the highest marks on scorched trees – excluding palm trees and coconut trees that can bent – and the upper limit of destruction traces and mud lines on buildings and hill slopes. For these measures, the bench mark calculated from astro-nomical tide tables is the mean sea level. We also collected flow directions attested by tilted trunks, pillars, and debris us-ing compass and GPS. In selected locations, we measured the inundation depth, defined as the maximum horizontal
pene-tration of waves in the direction normal to the beach during the flooding (Synolakis et al., 2005).
3 Results
3.1 Wave and run-up height, tsunami intensity and over-land flow depth
Along the south coast of Java between Batukaras and Baron (Fig. 1), the maximum height of the waves before their breaking ranged from 4.2 to 8.6 m, and the measured run-up heights (RU) ranged from less than 1 m to 15.7 m (Srun-up- (Sup-plement File: http://www.nat-hazards-earth-syst-sci.net/7/ 177/2007/nhess-7-177-2007-supplement.pdf). The Fig. 1b clearly distinguishes two coastal regions based on the run-up heights of the tsunami: at Pangandaran district, wave heights as well as run-up heights commonly exceeded 8 m, with an intensity of 2.5–3 on the Imamura and Ida’s scale (Ida, 1956). East from Cilacap, the run-up values were lower than 6 m and the intensity less than 2.5.
We measured the maximum run-up of the 17 17 July 2006 tsunami on Nusa Kambangan Island. Near the prison of Per-misan, a 5 m to 8 m-high wave broke on the beach (Fig. 1b). Then the overland flow inundated tens or hundreds of meters, due to high cliffs and coastal hillslopes. The run-up values measured on these cliffs ranged from 8.2 to 15.7 m (Supple-ment File: http://www.nat-hazards-earth-syst-sci.net/7/177/ 2007/nhess-7-177-2007-supplement.pdf).
The highest run-up heights on the island of Java were mea-sured at Batukaras (RU=10.4 m; Fig. 1b). In this area, the wave broke overland as far as 120 m from the shoreline, and the inundation depth reached hundreds of meters. At Kebon-carik (Fig. 1c) and near Krapyak (RU=9.2 m at both sites), the wave broke on the beach and rapidly decreased landward as far as a few hundred meters, due to a raise in the local topography.
Other beaches were not so heavily affected by the tsunami waves. For example, the Pantai Timur (East Beach) of the Pangandaran peninsula (Fig. 1c) suffered from limited wave heights and inundation depth due to the urbanization of the Pantai Barat (West Beach). The high density of hotels along the seashore played the role of a barrier, so that the second range of hotel was not destroyed. The Pantai Timur was therefore only affected by refracted and diffracted waves. Five kilometres eastward, however, the local effects due to the peninsula are mitigated and the maximum run-up mea-sured at Karangsari exceeded 8 m again.
In Cilacap city, run-up heights did not exceed 3 m, barely reaching the beach ridge in front of the build-ings of Pertamina. Indeed, the city was protected by the island of Nusa Kambangan. To the East of Cilacap, maximum run-up heights were measured at Pantai Ayah (6.7 m), where the tsunami wave broke on the wall along the beach. Then a progressive decrease of the run-up is observed along the coastline towards the East (Supple-ment File: http://www.nat-hazards-earth-syst-sci.net/7/177/ 2007/nhess-7-177-2007-supplement.pdf), until South of Yo-gyakarta city. Measured run-up in this area did not exceed
4 m, except in specific spots where the tsunami wave reached the top of the sand dunes up to 6.7 m a.s.l. (e.g. at Ketapang beach).
3.2 Tsunami arrival time, chronology, velocity, and flow di-rections
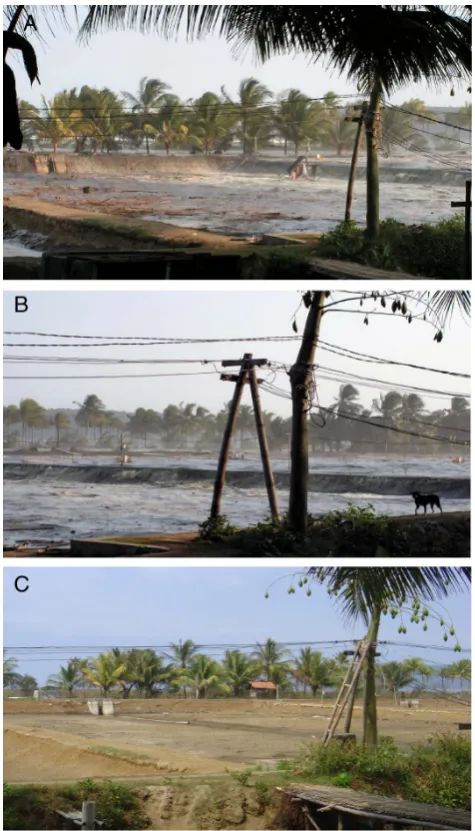
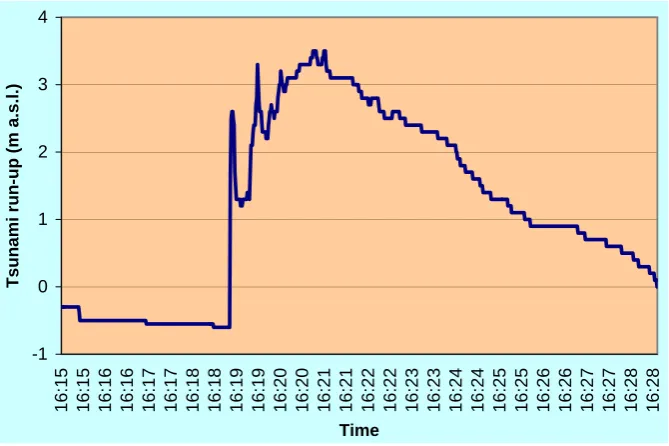
Along the Javanese coast, the chronological data collected show an eastward timing slide from Pangandaran to East Java and Bali. The tsunami event chronology is well known at Pangandaran (225 km away from the earthquake epicentre – Fig. 1c), because a clock destroyed by the tsunami inside the hall of a school stopped working at 16:19 LT, one hour after the main earthquake. This is consistent with numerous reli-able eyewitness accounts at Pangandaran and at Karangsari village a few kilometers east from Pangandaran peninsula. They attest to a wave arrival around 16:20 LT. At Keboncarik a violent wave entering the shrimp basins between 16:16 and 16:20 LT has been documented with photographs by two workers (Fig. 2). In Cilacap, images captured on videos at the PLTU power plant show the waves arrival at 16:18 LT in the water intake (Fig. 3), one hour after the earthquake, followed by a second wave of higher magnitude 2 to 3 min later. Then, a third one arrived on shores a few minutes later (Fig. 4). At Baron beach, about 200 km east of Pangandaran, fishermen were waiting for the high tide in front of a clock placed in a small “warung” (caf´e) for this purpose, and could attest to the tsunami’s arrival around 16:30 LT. In Bali, the tsunami wave was recorded by the tide gauge at Benoa beach at 17:00 LT, one hour and forty minutes after the earthquake.
The overall results on Javanese and Balinese coasts ex-emplify the progressive propagation of the wave from Pan-gandaran towards the East. The precise arrival time of the tsunami at several coastal locations allow us to calculate the tsunami mean velocity from the earthquake epicentre to Ja-vanese and Balinese coasts. We computed the wave speed considering an earthquake point source, although an ex-tended source may have triggered the tsunami. The tsunami reached Pangandaran and PLTU Cilacap in one hour with a mean velocity of 225 and 256 km/h, respectively. This veloc-ity reached 300 km/h until Baron Beach – 360 km away from the earthquake epicentre – and up to 510 km/h until Benoa on Bali. These data highlight the increasing of the tsunami mean velocity towards the East. The wave propagation par-allel to the isobaths explains the high velocity of the tsunami before it reached Bali. On the contrary, multiple refraction effects on the continental shelf near Pangandaran and Cila-cap may explain the rapid decreasing of the tsunami velocity in these areas.
Fig. 2. Tsunami wave entering a shrimp basin (tambak) at Kebon-carik between 16:16 and 16:20 (B, C). View of the same basin on the 30 August 2006. Photos: Pusat Studi Bencana (A, B) and F. Lavigne (C).
the time perpendicular to the coast, excepted for punctual variations due to local topographic settings (Supplement File: http://www.nat-hazards-earth-syst-sci.net/7/177/2007/ nhess-7-177-2007-supplement.pdf). On some beaches, a third wave has been reported by eyewitnesses. Its direction differed from the preceding one, suggesting that it was gen-erated by reflection effects on the cliffs (e.g. at Keboncarik and Karangsari).
4 Discussion and conclusion
One and a half year after the megatsunami that destroyed the Aceh coastal regions, a new tsunami damaged the Javanese
south coast on the 17 July 2006. This tsunami, which was triggered by a 7.7 earthquake located 220 km off Java Is-land, travelled the Indian Ocean with a velocity ranging from 225 km/h – as far as West Java coast – to 510 km/h as far as Bali. The tsunami propagation was faster than the one of the 2 September 1992 tsunami that hit the Nicaragua’s coast (180 km/h: Kanamori and Masayuki, 1993). The epicenter of the 1992 earthquake was located at only 60 km from the coast. the velocity of the tsunami was therefore reduced by refraction effects. On the contrary, the velocity of the July 2006 tsunami wave was much lower than the one of the 26 December 2004 tsunami. On the same distance of 255 km, the 2004 tsunami reached the coastline of Banda Aceh at 600 km/h (Borrero, 2005), whereas the July 2006 reached Cilacap city at only 256 km/h, due to lesser ocean depth.
During the 17 July 2006 event, the drawdown related to the leading depression wave was followed by two main waves. A third wave reported by testimonies in several sites resulted from wave reflexion which should have enhanced the local effects of the tsunami, as reported on Babi Island on Flores in 1992 (Minoura et al., 1997).
The maximum wave height was 8.6 m and the maximum run-up height reached 15.7 m a.s.l. Our results highlight three main issues.
Firstly, our results are not consistent with the different re-sults presented until now on the internet by most of the other survey teams. Indeed, the other teams have underestimated the maximum run-up heights. For example, the team con-ducted by Widjo Kongko (BPPT) measured a maximum run-up height reaching only 3.6 m a.s.l (http://ioc3.unesco.org/ itic/files/tsunami-java170706 e.pdf). As for the team of the Indonesian Geological Survey, they measured a 3.3 m max-imum in Pangandaran (http://www.grdc.esdm.go.id), which is less than half the values we measured. The closest values to ours were found by the team led by Prof. Tsuji, which re-ported run-up heights that are close to the one we have mea-sured, e.g. 7.7 m at Pangandaran (http://aeic.bmg.go.id/file/ Pangadaran report en.pdf).
Fig. 3. Tsunami waves at the PLTU power plant. (A) Tsunami bore of the first wave at 16:18:53 LT. (B) Drawdown following the first wave at 16:19:02 LT. (C) Second wave at 16:19:24 LT. (D) Maximum flow depth at 16:20:25 LT. See some PLTU staff carried by the tsunami wave. (E) Drawdown at 16:24:24 LT. (F) Normal sea level at 16:28:40 LT. Courtesy: Ir. Chandra Dwi Putra, MM, PLTU Cilacap.
3.5 m. This breaking line has been confirmed by eyewitness accounts.
Secondly, this tsunami was without any doubt bigger than predicted by theoretical models. Indeed, the measured
-1 0 1 2 3 4
16:15 16:15 16:16 16:16 16:17 16:17 16:18 16:18 16:19 16:19 16:20 16:20 16:21 16:21 16:22 16:22 16:23 16:23 16:24 16:24 16:25 16:25 16:26 16:26 16:27 16:27 16:28 16:28
Time
Ts
una
m
i r
un-up (
m
a
.s
.l.)
Fig. 4. Hydrogram of the tsunami at the PLTU power plant. We have reconstructed the tsunami depth through video frame analysis.
Tohoku University (http://www.tsunami.civil.tohoku.ac.jp/ hokusai2/disaster/06 Java/July17 Java.html), Bologna Uni-versity (http://labtinti4.df.unibo.it/site/simulation java.php), or CEA (http://www-dase.cea.fr/actu/dossiers scientifiques/ 2006-07-17/index.html) give maximum run-up values rang-ing from 0.1 m to 3.5 m. These values are a quarter to a half of those we measured on the Javanese coast. These ences may result from two main reasons. Firstly, the differ-ent models have not been calibrated with field data as yet, and were only based on the tsunamigenic earthquake prop-erties and rough bathymetric settings. Secondly the 17 July 2006 tsunami may have been generated by a tsunami earth-quake, i.e. an earthquake of low or medium scale that trig-ger a tsunami of high magnitude. Run-up higher than pre-dicted on the basis of the magnitude of the tsunamigenic earthquake may result from the creation of a new fault associ-ated with subducted sediments along the Java trench. In this case, the origin of this tsunami should be compared to the 2 September 1992 tsunami earthquake of magnitude 7 that hit the Nicaragua’s coast with similar run-up heights rang-ing from 8 to 15 m (Kanamori and Masayuki, 1993). An earthquake with associated landslides could also have gener-ated the 17 July 2006 tsunami. Indeed, similar events have already been reported in 1771 and 1896 on the Japanese Is-lands of Ryukyu and Honshu (NGDC database), or in 1946 in the Aleutian archipelago (Fryer et al., 2003). The 1998 tsunami earthquake on Papua New-Guinea generated run-up heights up to 15 m (Tappin et al., 2001), which is comparable to the maximum run-up heights we measured in 2006 along the Javanese coast.
Thirdly, if we compare the 2006 event with the 2004 tsunami at Banda Aceh, we can observe differences but also
similarities. The 17 July 2006 tsunami was triggered by a 7.7 magnitude earthquake on the Richter scale, which is not as important as the 9.3 tsunamigenic earthquake triggered on the 24 December 2004 (Stein et al., 2005). Therefore run-up heights were not as elevated as the 51 m run-up measured to the South of Lhok Nga at Labuhan (Lavigne et al., 2006a, b), but still presented a maximum run-up in excess of 15 m a.s.l. Moreover the continental shelf to the South of Java Island is not as wide as the one extending away from Aceh, and there-fore not prone to gigantic run-up heights. The event was of smaller magnitude, which explains the limited geomorpho-logic impacts. The 17 July 2004 tsunami did not generate significant flooding lasting from months to years as in Banda Aceh (Wassmer et al., 2006), nor could it decapitate sand dunes like in Lampuuk (Gomez et al., 2006). Regarding the tsunami impacts on the infrastructures, the seaside villages of the south coast of Java were not totally destroyed. Only the single storey houses and the hotel’s ground floors were heavily damaged.
Although of lesser magnitude than the dramatic 2004 event, the 2006 tsunami in Java took more than 800 lives. It was much more deadly and destructive than the last tsunami-related disaster that occurred on East Java in 1994 (Maramai and Tinti, 1997; Tsuji et al., 1995). In fact, the 2006 event is the most deadly earthquake-triggered tsunami ever recorded for this island.
Acknowledgements. The authors are indebted to the French D´el´egation Interminist´erielle pour l’Aide Post-Tsunami (DIPT), the French Embassy in Indonesia, and the French CNRS (ATIP program) for financial support. We are also grateful for the cooperation and help extended to us by the Research Center for Risk at Gadjah Mada University. H. H´ebert and F. Schindele (CEA) are acknowledged for their advice.
Edited by: S. Tinti Reviewed by: two referees
References
Ambraseys, N. N.: Data for the investigation of the seismic sea-waves in the Eastern Mediterranean, Bulletin of the Seismologi-cal Society of America, 52, 895–913, 1962.
Andrade, C., Borges, P., and Freitas, M. C.: Historical tsunami in the Azores archipelago (Portugal), Journal of Volcanology and Geothermal Research, 156, 1–2, 172–185, 2006.
Borrero, J. C: Field data and satellite imagery of the tsunami effects in Banda Aceh, Science, 308, 1596, 2005.
Fine, I. V., Rabinovich, A. B., Bornhold, B. D., Thomson, R. E., and Kulikov, E. A.: The Grand Banks landslide-generated tsunami of November 18, 1929: preliminary analysis and numerical mod-elling, Marine Geology, 215, 1–2, 45–57, 2004.
Fryer, G. J., Watts, P., and Lincoln, F.: Source of the great tsunami of 1 April 1946: Aleutian forearc, Mar. Geol., 203, 1–2, 201– 218, 2003.
Gomez, C., Lavigne, F., Lespinasse, N., Saintenoy, A., and Lep-aroux, D.: Mise en ´evidence de dunes tronqu´ees par le tsunami du 26 d´ecembre 2004 et de d´epˆots sableux corr´elatifs par radar g´eologique, in: Le tsunami du 26 d´ecembre 2004 en In-don´esie. Rapport scientifique du programme TSUNARISQUE. D´el´egation Interminist´erielle pour l’aide Post-Tsunami (DIPT), edited by: Lavigne, F. and Paris, R., 127–134, 2006.
Ida, K.: Earthquakes accompanied by tsunamis occurring under the sea off the islands of Japan, J. Earth Sci., Nagoya University, 4, 1–43, 1956.
Kanamori, H. and Masayuki, K.: The 1992 Nicaragua earthquake: a slow tsunami earthquake associated with subducted sediments, Nature, 361, 714–716, 1993.
Lavigne, F., Paris, R., Wassmer, P., Gomez, C., Brunstein, D., Grancher, D., Vautier, F., Sartohadi, J., Setiawan, A., Syahnan, Gunawan, T., Fachrizal, Waluyo, B., Mardiatno, D., Widagdo, A., Cahyadi, R., Lespinasse, N., and Mahieu, L.: Learning from a major disaster (Banda Aceh, December 26th, 2004): a method-ology to calibrate simulation codes for tsunami inundation mod-els, Zeitschrift f¨ur Geomorphologie, N.F., Suppl.-vol. 146, 253– 265, 2006a.
Lavigne, F., Paris, R., Grancher, D., Wassmer, P., Setiawan, A., Syahnan, Gunawan, T., Fachrizal, Waluyo, Cahyadi, R., Flohic, F., De Coster, B., and Mahieu, L.: Le tsunami du 26 d´ecembre 2004 : chronologie et reconstitution de la catastrophe dans la r´egion de Banda Aceh Sumatra, Indon´esie, in: Le tsunami du 26 d´ecembre 2004 en Indon´esie, Rapport scientifique du programme TSUNARISQUE. D´el´egation Interminist´erielle pour l’aide Post-Tsunami (DIPT), edited by: Lavigne, F. and Paris, R., 21–37, 2006b.
Maramai, A., Graziani, L., and Tinti, S.: Tsunamis in the Aeolian Island (southern Italy): a review, Mar. Geol., 215, 1–2, 11–21, 2004.
Maramai, S. and Tinti S.: The 3rd June, 1994 Java tsunami: a post-event survey of the coastal effects, Nat. Hazards, 15, 31– 49, 1997.
Minoura, K., Imamura, F., Takahashi, T., and Shuto, N: Sequence of sedimentation processes caused by the 1992 Flores tsunami: Evidence from Babi Island, Geology, 25, 6, 523–526, 1997. Papadopoulos, G. A. and Imamura, F.: A proposal for a new
tsunami intensity scale, Proc. Internat. Tsunami Conference, 7–9 August 2001, Seattle, 569–577, 2001.
Stein, S. and Okal, E.: Speed and size of the Sumatra earthquake, Nature, 434, 581–582, 2005.
Synolakis, C., Okal, E., and Bernard, E.: The Megatsunami of De-cember 26 2004, Bridge, 35, 2, 26–35, 2005.
Tappin, D. R., Watts, P., McMurtry, G. M., Lafoy, Y., and Mat-sumoto, T.: The Sissano, Papua New Guinea Tsunami of July 1998 - Offshore Evidence on the Source Mechanism, Mar. Geol., 175, 1–23, 2001.
Tinti, S., Armigliato, A., Manucci, A., Pagnoni, G., Zaniboni, F., Yalciner, A. C., and Altinok, Y.: The generating mechanisms of the August 17, 1999 Izmit bay tsunami: Regional tectonic and local mass instabilities causes, Mar. Geol., 225, 1–4, 311–330, 2005.
Tsuji, Y., Imamura, F., Matsutomi, H., Synolakis, C. E., Nanang P. T., Jumadi, Harada, S., Han, S. S., Arai, K., and Cook, B.: Field Survey of the East Java Earthquake and Tsunami of June 3, 1994, Pure Appl. Geophys., 144, 3/4, 839–854, 1995.
Wassmer, P., Paris, R., and Lavigne, F.: Apports de la photogra-phie a´erienne oblique dans l’analyse des impacts environnemen-taux du tsunami, in: Le tsunami du 26 d´ecembre 2004 en In-don´esie, Rapport scientifique du programme TSUNARISQUE. D´el´egation Interminist´erielle pour l’aide Post-Tsunami (DIPT), edited by: Lavigne, F. and Paris, R., 97–113, 2006.