Themed Section: Science and Technology
Effect of Company Size, Profitability and Solvability of Delay Audit
(Empirical Study on Mining Companies Registered In Indonesia Stock Exchange 2012 - 2016)Matdio Siahaan,Serlie Royani Apriyadi
Program Study Accounting, Faculty Economy, University Bhayangkara Jakarta Raya, Jakarta
ABSTRACT
This study aims to analyze whether the size of the company as measured by total assets, profitability as measured by ROA and solvability as measured by DER both partially and simultaneously affect the audit delay in mining companies listed on the Stock Exchange in 2012 - 2016. Data used in this study is secondary data and the method used is “purposive sampling method with a sample of 140 companies processed using software spss version 22”. The research method used is multiple analysis method with classical assumption test that is normality, multicollinearity, heteroscedasticity, and autocorrelation and by testing the hypothesis, namely the coefficient of determination R2, t test and f test. The results of this study are, that the size of the company partially has no effect on audit delay, partial profitability as measured by ROA has no effect on audit delay, and partial solvency as measured by DER has a positive effect on audit delay. And simultaneously the size of the company, profitability and solvability together affect the audit delay of 18.9%.
Keywords : Audit Delay, Company Size, Profitability, Solvability
I.
INTRODUCTIONFinancial statements are an important instrument in the survival of the company, especially for companies going public in stock trading. This encourages the Indonesia Stock Exchange (IDX) and the Capital Market Supervisory Agency (Bapepam) to require public companies listed on the Indonesia Stock Exchange (IDX) to publish financial statements which has been audited by an independent auditor within a certain period after the end of the financial year so that Bapepam can monitor and evaluate the company's performance.
According to Hery (2014, p. 3), financial statements are the final product of a series of processes for recording and summarizing business transaction data. The financial statements are basically a result of an accounting process that can be used as a tool to communicate financial data and company activities to
interested parties. The parties that have an interest in the financial position and development of the company are divided into two, namely internal parties such as company management and company employees. And the second is external parties such as shareholders, creditors, government and society. So it can be concluded that financial statements are an information tool that connects companies with interested parties, which shows the condition of the
company's financial health and company
performance.
are material if the misstatement can affect the decisions taken by users of financial statements.
Timeliness in the issuance of audit financial statements is also an important factor for users of financial statements in decision making because audit financial statements that are issued on time will greatly influence the value of the audit financial statements. That is, the information contained in the audit financial statements, for example profit, will affect the fluctuations in stock prices. The importance of timeliness in financial reporting is what makes the length of time to complete an audit conducted by the auditor or what is usually called an audit delay is very important to learn.
According to Hilmi and Ali (2008), on time is the quality of information availability on
when needed or the quality of information is good in terms of time. The faster the financial statements are published to the public, the more useful information is for decision making. Conversely, if there is a delay in reporting time that is not semesinya, the resulting information will lose its relevance in terms of making a decision. Besides that timeliness is an obligation for companies listed on the Indonesia Stock Exchange to periodically submit financial reports.
Compliance demands in the submission of financial statements are regulated in the explanation of Law No. 8 of 1995 and updated with the decision of the chairman of Bapepam No.Ke. 36 / PM / 2003 relates to the obligation of a periodic report which explains that the audit financial statements are mandatory with a time limit of 90 days from the end of the year to the date of submission of audited financial statements to Bapepam.
Formulation of the problem
With the background described previously, the problems in this study are formulated as follows: a. Does the Company Size affect audit delay? b. Does Profitability affect audit delay?
c. Does Solvability affect audit delay?
d. Are Company Size, Profitability, and Solvability jointly influencing audit delay?
Research Purposes
Based on the formulation of the problems described above, the objectives of this study are as follows: a. To find out empirical evidence, does the size of the company affect audit delay in mining companies in 2012-2016?
b. To find out empirical evidence whether profitability affects audit delays in mining companies in 2012-2016?
c. To find out empirical evidence, does solvency affect audit delay in mining companies in 2012-2016? d. To find out empirical evidence whether the size of the company, profitability and solvency together influence the audit delay in mining companies in 2012-2016?
II.
LITERATURE REVIEWAuditing
According to Agoes (2012, p 4) Auditing is an examination that is carried out critically and systematically, with the aim of being able to provide opinions regarding the fairness of the financial statements by an independent party, to the financial statements prepared by management, along with accounting records and supporting evidence.
Audit Delay
The delay in the audited financial report submitted by the auditor to the company can affect the quality of information from the report because the length of the audit delay shows that the information provided is not up to date and the old information indicates that the quality of the audited financial statements is bad. The relevance of an audited financial report can be obtained if the audited financial statements can be completed in a timely manner when needed.
The length of the audit completion process can affect the audit delay in submitting audited financial statements to the public so that it can adversely affect the market reaction (Hesti, 2011) and cause uncertainty in terms of economic decision making especially for users of financial statements. To see the timeliness of a study usually sees a lag.
Information that is actually of high value can be irrelevant if it is not available when needed. Timeliness of information implies that information is available before losing its ability to influence or make a difference in decisions. Information must be submitted as early as possible to be used as a basis to assist in economic decision making and to avoid delays in decision making (Baridwan, 2001).
Company Size
Company size is a scale in which the size of a company can be classified according to various ways, including total assets, stock market value, total sales, number of workers, and so on. Basically, the size of the company is only divided into three categories: large firm, medium-sized firm and small firm (Machfoedz, 1994) in (Herliana, 2016).
According to Courtis in New Zealand, Gilling research, Davies and Whitterd research in Australia, and so on in Rachmawati (2008) showed that audit delay has a negative relationship with the size of the company that uses proxy total assets. The cause is
first, companies going public or large companies have a good internal control system so as to reduce the level of errors in the presentation of the company's financial statements so that it makes it easier for auditors to audit financial statements and encourage auditors to be able to complete their audit work on time. The weak internal control of clients gives a longer audit delay because auditors need some time to look for more complete and complex evidential matter to support their opinions. Second, large companies have financial resources to pay greater audit fees in order to get audit services that are faster and immediately carried out after the end of the financial year. Third, large companies tend to get high external pressure on the company's financial performance, so management will try to publish audit reports and audited financial statements more timely (Ahmad and Kamarudin in Yuliana and Ardiati, 2004).
Profitability
Profitability ratio is the ratio used to measure the company's ability to generate profits from the normal activities of its business. Profitability ratios are also known as profitability ratios. Besides aiming to determine the company's ability to generate profits during a certain period, this ratio also aims to measure the level of effectiveness of management in running the company's operations. The profitability ratio is the ratio describes the company's ability to generate profits through its capabilities and resources, namely those derived from sales, use of assets, and the use of capital. (Herry, 2015 p 226).
Solvability
According to Sutrisno (2013, p. 15) Solvability is the company's ability to fulfill all of its obligations if the company is liquidated. Usually the problem that arises when the company is liquidated (closed) concerns whether the assets owned by the company are able to cover all of its debts. If all of the company's assets are able to cover all of its debts, it means that the company is in solvable condition, on the contrary if when the company is liquidated, the company cannot cover all its debts, it means the company is in an insovable condition. To cover all debts, the company guarantees with all its assets (assets), thus the solvency of the company can be calculated by dividing the total assets with the total debt.
According to Herry (2015, p 90) Solvency ratio or leverage ratio is the ratio used to measure the extent to which a company's assets are financed by debt. In other words, solvency ratios or leverage ratios are the ratios used to measure how much debt burden the company must bear in order to fulfill assets. In a broad sense, the solvency ratio is used to measure the company's ability to fulfill all its obligations, both short-term liabilities and long-term liabilities.
Companies with high solvency ratios (have large debt) can have an impact on the emergence of large financial risks, but also have great opportunities to generate high profits. This large financial risk arises because companies must bear or be burdened with large interest payments. However, if the proceeds from the sale are used efficiently and effectively by buying productive assets certain or to finance the expansion of the company's business, this will provide a great opportunity for the company to increase its business results. Conversely, companies with low solvency ratios have little financial risk, but also have small opportunities to generate large profits.
High debt to equity ratios reflect high financial risk and companies experience financial difficulties. These financial difficulties are bad news that will affect the condition of the company in the eyes of the public. The management also tends to delay the submission of financial reports that contain bad news. Companies with high debt to capital ratio conditions will be late in submitting their financial reporting, because the time available is used to reduce the debt to equity ratio as low as possible (Utami, 2006).
Based on the literature review and theoretical framework, the research hypothesis is formulated as follows:
1. Ho1: Company size has a negative effect on audit delay in mining companies on the Indonesia Stock Exchange.
The greater the size of the company, the better the internal control of the company and the corporate governance. Large-sized companies can collaborate with qualified KAP or independent auditors that can shorten audit delay.
2. Ho2: Profitability has a negative effect on audit delay in mining companies on the Indonesia Stock Exchange.
The greater the profit generated by the company, the faster the audited reports will be published. Because it is good news for companies and companies will not
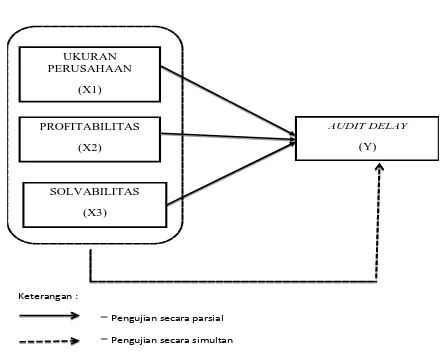
Gambar 2. 1 Kerangka Pemikiran Teoritis
Keterangan :
= Pengujian secara parsial
= Pengujian secara simultan
UKURAN PERUSAHAAN
(X1)
PROFITABILITAS (X2)
SOLVABILITAS (X3)
AUDIT DELAY
delay the good news to be able to attract potential investors.
3. Ho3: Solvability has a positive effect on audit delay in mining companies on the Indonesia Stock Exchange.
High debt-to-equity ratios reflect financial risks and companies experience financial difficulties. These financial difficulties are bad news that will affect the condition of the company in the eyes of the public. The management will tend to delay the submission of financial reports that contain bad news. Because the time used to suppress the debt to equity ratio is as low as possible.
4. Ho4: Company Size, Profitability, and Solvability together influence audit delay in mining companies on the Indonesia Stock Exchange.
III.
RESEARCH METHODOLOGYTypes and Sources of Research
In this study the type of data used is secondary data because to get information about all the variables in this study obtained indirectly through intermediary media, both published and unpublished. Secondary data used in this study are the financial statements of mining companies listed on the Stock Exchange in 2012-2016. Data obtained from Indonesian Capital Market Directory (ICMD), www.idx.co.id. The sampling method used is purposive sampling method, where the population that will be used as the research sample is a population that meets certain sample criteria. These criteria are as follows:
1. Mining companies listed on the IDX for the 2012-2016 period.
2. The mining company has submitted successive financial statements for 2012-2016 that have been audited and accompanied by the auditor's report. 3. Displays data and information used to analyze factors that affect audit delay for the period 2012-2016.
Method of collecting data
Data collection methods use documentation
techniques, namely by collecting some information on knowledge, facts and data. Collect and classify written materials related to research problems, both from sources of documents, books, scientific journals, websites and others. In this case the author analyzes secondary data in the form of financial statements and independent auditor reports. The company's audited financial statements are obtained from access
to the Indonesia Stock Exchange website
(www.idx.co.id) and the Indonesian Capital Market Directory (ICMD). This research was also carried out by using literature study, namely by reading, studying literature and publishing other information related to this research.
Research Variables and Operational Research Definitions
In order to test the hypothesis that has been proposed, the variables to be examined in this study can be classified into 2, namely: dependent variable (Y) and independent variable (X).
The dependent variable in this study is the audit delay measured from the number of days from the financial year ended December 31 to the date of the independent auditor's report.
Audit Delay = Audit Report Date - Date of Book Year Ended
Company Size
In this study the size of the company is proxyed with the natural logarithm value of the total assets, formulated as follows:
Population and Sample
The population used in this study is a Mining Company listed on the Stock Exchange in 2012-2016. The company was chosen because the mining sector is the main sector driving the rise of the Composite Stock Price Index (JCI), where shares in the mining sector are a fairly liquid sector and are excellent for investors. Because of this, timely and accurate mining
increasingly important and the investor's need for information is increasing.
The sampling method used is purposive sampling method, where the population that will be used as the research sample is a population that meets certain sample criteria. These criteria are as follows:
1. Mining companies listed on the IDX for the 2012-2016 period.
2. The mining company has submitted successive financial statements for 2012-2016 that have been audited and accompanied by the auditor's report. 3. Displays data and information used to analyze factors that affect audit delay for the period 2012-2016.
Method of collecting data
Data collection methods use documentation
techniques, namely by collecting some information on knowledge, facts and data. Collect and classify written materials related to research problems, both from sources of documents, books, scientific journals, websites and others. In this case the author analyzes secondary data in the form of financial statements and independent auditor reports. The company's audited financial statements are obtained from access
to the Indonesia Stock Exchange website
(www.idx.co.id) and the Indonesian Capital Market Directory (ICMD). This research was also carried out by using literature study, namely by reading, studying literature and publishing other information related to this research.
Research Variables and Operational Research Definitions
In order to test the hypothesis that has been proposed, the variables to be examined in this study can be classified into 2, namely: dependent variable (Y) and independent variable (X).
The dependent variable in this study is the audit delay measured from the number of days from the financial year ended December 31 to the date of the independent auditor's report.
Audit Delay = Audit Report Date - Date of Book Year Ended
Company Size
In this study the size of the company is proxyed with the natural logarithm value of the total assets, formulated as follows:
Company Size = Ln Total Assets Profitability
Profitability is a ratio that shows the level of effectiveness and assesses how far the company's performance in generating profits for investors. Profitability in this study uses the ratio of net income divided by total assets or can be written as follows: Return on asset ratio (ROA) = (Net Income) / (Total Asset) x 100%
Solvability
Solvency is the company's ability to pay all its debts (both short-term debt and long-term debt) from the equity of the company. In this study solvency is measured using the ratio between total debt divided by total equity or can be written as follows:
Debt to equity ratio (DER) = (Total Debt) / (Total Equity) x 100%
IV.
ANALYSIS AND DISCUSSIONThe research data used in this study are mining companies listed on the Indonesia Stock Exchange (IDX) during the period 2012-2016, or mean for five years. The selection process was carried out starting from population counting, sample selection with purposive sampling technique.
Descriptive Analysis Results
in this section a description of the data obtained from the financial statements, the following is a table descriptive analysis:
Table 4. 1 Descriptive Statistical Analysis
Classic assumption test Normality test
Table 4. 2 Analysis of the Kolmogrov-Smirnov One-Sample Test
Based on the table results of the one-sample kolmogrov-smirnov test above shows that the results of the significance level of 0.200 which is above 0.05. Thus the residual value is normally distributed so that the research model is stated to have fulfilled the assumption of normality
Multicollinearity Test
Table 4. 3 Analysis of Cofficients Multicollinearity Test
The results from the table above illustrate that the calculated Tolerance value of Total Assets, ROA, and DER is below 0.10 and the VIF value is calculated from the Total Assets, ROA, and DER is above 10. This shows that the sample is free from multicollinearity interference.
Heteroscedasticity Test
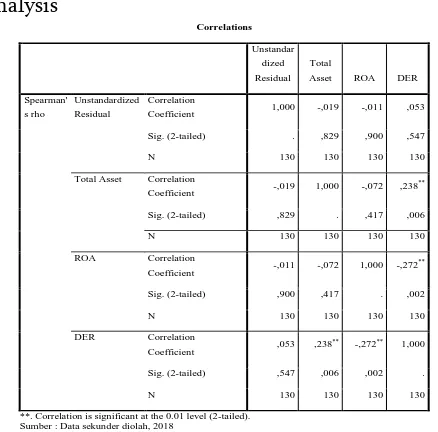
Table 4. 4 Heteroscedasticity Correlations Test Analysis
.
Based on the above table it is known that the significance value of the independent variable is greater than the significance level of 0.05. This means that the regression model in this study does not occur heteroscedasticity.
Descriptive Statistics
N Minimum Maximum Mean Std. Deviation
Audit Delay 130 17,00 143,00 72,5846 18,44993
Ukuran Perusahaan 130 26,00 34,00 29,1385 1,64601
Return on Asset 130 -,27 ,30 ,0322 ,08714
Debt to Equity 130 ,00 5,00 1,0615 1,04267
Valid N (listwise) 130
Sumber : Data sekunder diolah, 2018
One-Sample Kolmogorov-Smirnov Test
Unstandardized
Residual
N 130
Normal Parametersa,b
Mean ,0000000
Std. Deviation 16,61656179
Most Extreme Differences Absolute ,059
Positive ,055
Negative -,059
Test Statistic ,059
Asymp. Sig. (2-tailed) ,200c,d
a. Test distribution is Normal. b. Calculated from data. c. Lilliefors Significance Correction. d. This is a lower bound of the true significance. Sumber : Data sekunder diolah, 2018
Coefficientsa Model Unstandardized Coefficients Standardized Coefficients
T Sig.
Collinearity Statistics
B Std. Error Beta
Tolera nce VIF
1 (Constant) 125,074 26,453 4,728 ,000
Total Asset -1,878 ,908 -,168 -2,068 ,041 ,980 1,020
ROA -63,235 17,789 -,299 -3,555 ,001 ,912 1,096
DER 4,021 1,490 ,227 2,698 ,008 ,907 1,102
a. Dependent Variable: Audit Delay Sumber : Data sekunder diolah, 2018
**. Correlation is significant at the 0.01 level (2-tailed). Sumber : Data sekunder diolah, 2018
Correlations
Unstandar dized Residual
Total
Asset ROA DER
Spearman' s rho
Unstandardized Residual
Correlation
Coefficient 1,000 -,019 -,011 ,053
Sig. (2-tailed) . ,829 ,900 ,547
N 130 130 130 130
Total Asset Correlation
Coefficient -,019 1,000 -,072 ,238
**
Sig. (2-tailed) ,829 . ,417 ,006
N 130 130 130 130
ROA Correlation
Coefficient -,011 -,072 1,000 -,272
**
Sig. (2-tailed) ,900 ,417 . ,002
N 130 130 130 130
DER Correlation
Coefficient ,053 ,238
**
-,272**
1,000
Sig. (2-tailed) ,547 ,006 ,002 .
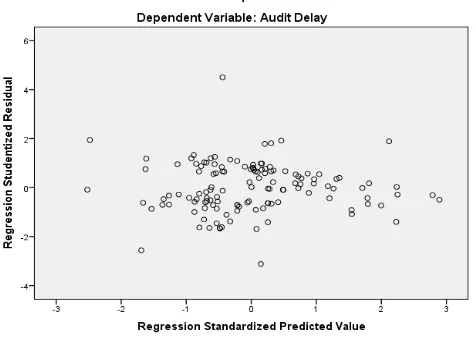
Heteroscedasticity test can also be done by plotting a graph between SRESID and ZPRED where heteroscedasticity disorders will be seen with the presence of certain patterns on the graph. The following is a test of heteroscedasticity in the model in this study:
Figure 4. 1 Scatterplots
The scatterplot graph above shows that there are no specific patterns on the graph. The point on the graph is relatively evenly spread which means there is no heteroscedasticity disorder in the model in this study.
Autocorrelation Test
Table 4.5 Analysis of Durbin-Watson Autocorrelation Test
Based on the Durbin-Watson table at a significance of 5%, with a total sample of 130 and the number of independent variables 3 (k = 3) the Durbin Watson table will give a value:
dU = 1.7610 dL = 1.6667
can be seen in the table that the dW value is 2,249 which means:
4 - dU <dW <4 - dL, namely: 4 - (1,7610) <2,249 <4 - (1,6667) 2,239 <2,249 <2,3333
That is, the results cannot be concluded, therefore to convince the researcher whether the results are autocorrelated or not, the researcher continues with the Run-Test Test to see whether or not the correlation is determined from the significance of the residual parameter coefficient. If the residual significance is> 0.05, it can be concluded that autocorrelation does not occur. The following table from the results of the run-test test:
Table 4. 6 Run-Test Autocorrelation Test Analysis
Can be seen in the results of the Run-Test Test table above the significance value of 0.078 which is greater
than 0.05, which means that the sample of this study is free from autocorrelation.
Multiple Regression Analysis
Table 4. 7 Multiple Regression Analysis
Model Summaryb
Model R R Square
Adjusted R Square
Std. Error of the
Estimate Durbin-Watson
1 ,435a ,189 ,170 16,813 2,249
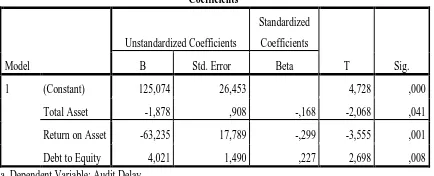
Based on the table above, the regression equation is obtained as follows:
Audit Delay (Y) = a + TotalAsset (X¹) + ROA (X²) + DER (X³)
Audit Delay (Y) = 125,074 + (-1,878X¹) + (-63,235 X²) + 4,021X³ + e
Information :
1. The dancing of 125,074 shows that if there are no independent variables or independent variables of company size, ROA, and DER (X1, X2, X3 = 0) then the Audit Delay is 125,074 or 125 Days.
2. Regression coefficients of total asset variables of -1,878 indicate that there is a negative direction between company size and audit delay, each increase in total assets is 1%, it will reduce audit delay by 1,878 days assuming other variables remain.
So, the higher the total assets, the shorter the audit delay.
3. The ROA variable regression coefficient of -63.235 shows that there is a negative direction between profitability and audit delay. every increase in ROA of 1%, it will reduce audit delay by 63,235 days assuming other variables remain. In this test profitability is represented by ROA. So, the higher the profitability, the shorter the audit delay.
4. DER variable regression coefficient of 4.021 indicates that there is a positive direction between solvency and audit delay. each increase in DER by 1%, it will increase or extend the audit delay by 4,021 days assuming other variables remain. In this test solvability is represented by DER. So, the higher the solvency, the longer the audit delay will be.
Hypothesis testing
Partial Regression Coefficient Test (t-test) Table 4. 8 Analysis of Partial T Test
Based on the results of the t-test table above, t counts from the variable Total Asset, ROA and DER can be seen in the table below. Here are the results of the significance test of the T-Test regression model:
Table 4. 9 Significant Test Results of T-Test Regression Models
According to the table above, the results of the test of the significance of the t-test regression model obtained a conclusion:
4.5.2.1 Effect of Company Size on Audit Delay A. Testing of H1
T. count> T. Table -2,068> 1,979
Based on the statement above, T count has a value smaller than T table. So it can be concluded that Ha1 is rejected which means that there is no significant
Coefficientsa
Model
Unstandardized Coefficients
Standardized Coefficients
T Sig.
B Std. Error Beta
1 (Constant) 125,074 26,453 4,728 ,000
Total Asset -1,878 ,908 -,168 -2,068 ,041
Return on Asset -63,235 17,789 -,299 -3,555 ,001
Debt to Equity 4,021 1,490 ,227 2,698 ,008
a. Dependent Variable: Audit Delay Sumber : Data sekunder diolah, 2018
Coefficientsa
Model
Unstandardized Coefficients
Standardized
Coefficients
T Sig.
B Std. Error Beta
1 (Constant) 125,074 26,453 4,728 ,000
Total Asset -1,878 ,908 -,168 -2,068 ,041
ROA -63,235 17,789 -,299 -3,555 ,001
DER 4,021 1,490 ,227 2,698 ,008
a. Dependent Variable: Audit Delay Sumber : Data sekunder diolah, 2018
Variabel Koefesien
Beta
t-Hitung t-Tabel Kesimpulan
Total Asset -1,878 -2,068 1,979 Ho1 Diterima
Ha1 Ditolak
Tidak Berpengaruh Signifikan
ROA -63,235 -3,555 1,979 Ho2 Diterima
Ha2 Ditolak
Tidak Berpengaruh Signifikan
DER 4,021 2,698 1,979 Ho3 Ditolak
Ha3 Diterima
Berpengaruh Signifikan
partial effect between X1 (Company Size) and Y (Audit Delay).
4.5.2.2 Effect of Profitability on Audit Delay B. Testing for H2
T. count> T. Table -3,555> 1,979
Based on the statement above, T count has a value smaller than T table. So it can be concluded that Ha2 is rejected which means that there is no partial significant effect between X2 (Profitability) and Y (Audit Delay).
4.5.2.3 Effect of Solvability on Audit Delay C. Testing against H3
T. count> T. Table 2,698> 1,979
Based on the statement above, T count has a value greater than T table. So it can be concluded that Ha3 is accepted which means there is a significant partial effect between X3 (Solvability) and Y (Audit Delay). Simultaneous Regression Test Coefficient (f-Test)
Table 4. 10 Simultaneous F Test Analysis
In accordance with the hypothesis proposed in this study, the f-test results calculated from the variable Company Size, ROA and DER can be seen in table
4.11 above. Here are the results of the significance test of the f-test regression model:
Table 4. 11 Test Results of Significance of the F-Regression Test Model
Can be seen in the table above, that F Calculate has a value of 9,779 which is greater than F Table whose value is 2.68 with a significance level of 0.00 where the significance value is below 0.05 which indicates that Ho is accepted, which means the independent variable together the same has a significant effect on audit delay.
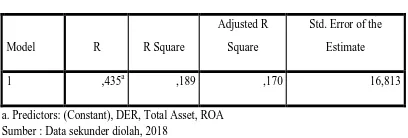
Determination Coefficient Analysis Test (R²) Table 4. 12 Determination Coefficient Analysis (R²)
The predictive ability of the three independent variables, namely Total Asset, ROA, and DER together, has an effect on Audit Delay of 0.189 as shown in Adjusted R Square in the table above. This means the amount.
The effect of variations in the independent variables used in the model is able to explain 18.9% variation in the dependent variable of Audit Delay in companies listed on the Indonesia Stock Exchange. While the remaining 81.1% is influenced or explained by other independent variables outside this linear regression analysis model.
ANOVAa
Model Sum of Squares Df Mean Square F Sig.
1 Regression 8293,363 3 2764,454 9,779 ,000b
Residual 35618,206 126 282,684
Total 43911,569 129
a. Dependent Variable: Audit Delay b. Predictors: (Constant), DER, Total Asset, ROA Sumber : Data sekunder diolah, 2018
N F Hitung Α R. Square F Tabel Kesimpulan
130 9,779 0,05 0,189 2,68 Signifikan
Sumber : Data sekunder diolah, 2018
Model Summary
Model R R Square
Adjusted R Square
Std. Error of the Estimate
1 ,435a ,189 ,170 16,813
V.
Conclusion and Managerial Implications
Conclusion
A. The partial test results between the size of the
company and audit delay shows that there is no significant effect between the size of the company and audit delay on mining companies listed on the Stock Exchange in 2012-2016.
B. Partial test results between profitability and audit
delay indicate that there is no significant effect between profitability and audit delay on mining companies listed on the Stock Exchange in 2012-2016.
C. Partial test results between solvency and audit
delay indicate that there is significant positive influence between solvency and audit delay on mining companies listed on the Stock Exchange in 2012-2016.
D. Test results simultaneously show that company
size, profitability and solvency jointly influence audit delay in mining companies on the IDX in 2012-2016. This indicates that predicting audit delay must also take into account the size of the company, profitability and joint solvability aimed at the value of the adjusted R square coefficient of 18.9% the magnitude of the variation in the effect of firm size, profitability, and solvency on audit delay. While the rest that is equal to 81.1% is influenced by other variables outside this research variable.
Managerial Implications
A. The results of this study are expected so that the
company can conduct periodic evaluations and also improvements on internal factors that affect audit delay as in this study.
B. The results of this study are expected to be a
material consideration for investors in making appropriate decisions before investing in a registered company by considering audit delays
that occur in companies that will be given investment.
C. The results of this study are expected to be
additional information to the auditor relating to the factors that affect audit delay so that the auditor can estimate the length of work in the audit of the company's financial statements and can plan more thoroughly before conducting a field audit.
VI.
REFERENCES
[1]. Soetrisno. (2013). Financial management
concept theory and application, Yogyakarta: Econisia.
[2]. Hery. (2015). Analysis of financial statements
of financial ratio approaches, Jakarta: Center for Academic Publishing Service.
[3]. Agoes, S. (2016). Auditing practical instructions
for checking accountants by public
accountants, Jakarta: Salemba Empat.
[4]. Bastian, I. (2014). Public sector audit of
government accountability reporting, Jakarta: Salemba Empat.
[5]. Sugiyono. (2014). Management research
method, Bandung: Alfabeta.
[6]. Sunyoto, D. (2016). Descriptive and probability
statistics, Yogyakarta: Center for Academic Publishing Service.
[7]. Algifari, (2015). Descriptive plus statistics for
economics and business, Yogyakarta: YKPN College of Management.
[8]. Santoso, S. (2014). Parametric statistics of
concepts and applications with spss, Jakarta: Elex Media Komputindo.
[9]. Sunyoto, D. (2011). Regression analysis and
hypothesis testing, Yogyakarta: Center for Academic Publishing Service.
[10]. Puspitasari, N. (2015). Analysis of the Effect of
on Audit Delay. Semarang: Walisongo State Islamic University.
[11]. Ardianti, F. (2013). Analysis of Factors that
Influence Audit Delay. Semarang: Diponogoro University.
[12]. Estrini, D.W. (2013). Analysis of Factors
Affecting Audit Delay. Semarang: Diponogoro University.
[13]. Sari, H.C. (2011). Analysis of Factors that
Influence the Period of Audit Completion. Semarang: Diponogoro University.
[14]. Lestari, D. (2010). Analysis of Factors Affecting
Audit Delay. Semarang: Diponogoro University.
[15]. Kurniati, M.M.R. (2015). Factors Affecting
Audit Delay. Jember: University of Jember.
[16]. Andini, H.W. (2016). Factors that Influence the
Timeliness of Submission of Financial