Spatial and Temporal Analysis of the Stomach and
Small-Intestinal Microbiota in Fasted Healthy Humans
Anna M. Seekatz,
aMatthew K. Schnizlein,
bMark J. Koenigsknecht,
a,cJason R. Baker,
dWilliam L. Hasler,
dBarry E. Bleske,
eVincent B. Young,
a,bDuxin Sun
caDepartment of Internal Medicine, Division of Infectious Disease, University of Michigan, Ann Arbor, Michigan, USA bDepartment of Microbiology and Immunology, University of Michigan, Ann Arbor, Michigan, USA
cDepartment of Pharmaceutical Sciences, College of Pharmacy, University of Michigan, Ann Arbor, Michigan, USA
dDepartment of Internal Medicine, Division of Gastroenterology and Hepatology, University of Michigan, Ann Arbor, Michigan, USA eDepartment of Pharmacy Practice and Administrative Sciences, University of New Mexico, Albuquerque, New Mexico, USA
ABSTRACT
Although the microbiota in the proximal gastrointestinal (GI) tract have
been implicated in health and disease, much about these microbes remains
under-studied compared to those in the distal GI tract. This study characterized the
micro-biota across multiple proximal GI sites over time in healthy individuals. As part of a
study of the pharmacokinetics of oral mesalamine administration, healthy, fasted
vol-unteers (
n
⫽
8; 10 observation periods total) were orally intubated with a four-lumen
catheter with multiple aspiration ports. Samples were taken from stomach,
duode-nal, and multiple jejunal sites, sampling hourly (
ⱕ
7 h) to measure mesalamine
(ad-ministered at
t
⫽
0), pH, and 16S rRNA gene-based composition. We observed a
pre-dominance of
Firmicutes
across proximal GI sites, with significant variation compared
to stool. The microbiota was more similar within individuals over time than between
subjects, with the fecal microbiota being unique from that of the small intestine.
The stomach and duodenal microbiota displayed highest intraindividual variability
compared to jejunal sites, which were more stable across time. We observed
signifi-cant correlations in the duodenal microbial composition with changes in pH; linear
mixed models identified positive correlations with multiple
Streptococcus
operational
taxonomic units (OTUs) and negative correlations with multiple
Prevotella
and
Pas-teurellaceae
OTUs. Few OTUs correlated with mesalamine concentration. The
stom-ach and duodenal microbiota exhibited greater compositional dynamics than the
je-junum. Short-term fluctuations in the duodenal microbiota were correlated with pH.
Given the unique characteristics and dynamics of the proximal GI tract microbiota, it
is important to consider these local environments in health and disease states.
IMPORTANCE
The gut microbiota are linked to a variety of gastrointestinal diseases,
including inflammatory bowel disease. Despite this importance, microbiota dynamics
in the upper gastrointestinal tract are understudied. Our article seeks to understand
what factors impact microbiota dynamics in the healthy human upper gut. We
found that the upper gastrointestinal tract contains consistently prevalent bacterial
OTUs that dominate the overall community. Microbiota variability is highest in the
stomach and duodenum and correlates with pH.
KEYWORDS
mesalamine, microbiota, pH, small intestine, stomach
T
he microbiota of the proximal gastrointestinal tract in humans represent an
under-studied yet highly relevant microbial community (1). Physiological processes such
as gastric emptying, bile acid secretion, and the transit of food can influence the
proximal gastrointestinal (GI) tract and disease development (2–5). However, there is
CitationSeekatz AM, Schnizlein MK, Koenigsknecht MJ, Baker JR, Hasler WL, Bleske BE, Young VB, Sun D. 2019. Spatial and temporal analysis of the stomach and small-intestinal microbiota in fasted healthy humans. mSphere 4:e00126-19.https://doi.org/10.1128/ mSphere.00126-19.
EditorKatherine McMahon, University of Wisconsin—Madison
Copyright© 2019 Seekatz et al. This is an open-access article distributed under the terms of theCreative Commons Attribution 4.0 International license.
Address correspondence to Vincent B. Young, [email protected], or Duxin Sun, [email protected].
A.M.S., M.K.S., and M.J.K. contributed equally to this article.
@MattSchnizlein and @Annaerobe publish their survey of the upper gastrointestinal tract microbiota. Great collaboration with Duxin Sun of @UMichPharmacy. #GoBlue @a2binny @umpibs
Received22 February 2019 Accepted23 February 2019 Published13 March 2019
Host-Microbe Biology
crossm
on September 8, 2020 by guest
http://msphere.asm.org/
limited information on how the microbiota in this region are related to these processes
and how these impact health and disease throughout the GI tract.
Much of our knowledge about the involvement of the human GI microbiota in
maintaining health and preventing disease has relied on fecal sampling, a noninvasive
sampling method that is largely representative of the large intestine (6, 7). Although it
is known that the microbiota across the GI tract vary in composition and density (8–10),
studying the microbiota at these sites is difficult, limiting our knowledge to invasive
procedures, specific patient populations, or single time points (1). Analyses of mucosal
samples from autopsies, endoscopies, and colonoscopies have revealed that
strepto-cocci and lactobacilli— both members of the oral and esophageal microbiota—are
abundant members of the jejunal and ileal microbiota (11–17). Studies using naso-ileal
catheters and ileostoma effluent, which allow collection over time, have supported
these conclusions and revealed that the small intestinal microbiota is highly dynamic
over short time courses, likely reflective of physiological processes at the stomach-small
intestine interface (18–21).
Understanding how the microbiota along the GI tract are related is of physiological
relevance, particularly in relation to intestinal homeostasis and disease. Recent
evi-dence suggests that the drug mesalamine, designed to reach high concentrations in
the GI tract as a treatment for inflammatory bowel disease (IBD), may directly target the
microbiota in addition to host effectors (22, 23). Interestingly, mesalamine is less
effective in treating IBD in the upper GI tract, which manifests as Crohn’s disease, than
the lower GI tract, which manifests as ulcerative colitis. It is possible that some of the
effectiveness of mesalamine as a treatment for IBD, or lack thereof, is mediated by the
microbiota, potentiating the need to characterize these microbial communities to a
fuller extent in the context of mesalamine administration.
This study investigated the bacterial composition across the intact upper GI tract in
the same healthy, fasted adults over time. We used a multilumen tube designed to
sample multiple sites along the upper GI tract. As part of a previously published study
aimed at measuring mesalamine dissolution, subjects were given a dose of mesalamine
and the proximal GI tract lumen was sampled over time (24). We used these samples
to (i) characterize and compare microbial community dynamics over time at multiple
upper GI sites within an individual and (ii) identify how environmental factors, such as
pH and the acute effect of mesalamine, shaped the microbiota. To the best of our
knowledge, this is the first study to characterize the luminal microbiota across multiple
upper GI sites over time within the same individual.
RESULTS
Study population.
Using a multichannel catheter with multiple aspiration points,
samples collected from the upper GI tract of 8 healthy subjects during 10 different
study visits were processed for 16S microbial community analysis (24) (Table 1; see Text
S1 and Table S1 in the supplemental material). Samples were collected hourly up to 7
h primarily from the proximal GI tract in the following possible locations: the stomach
(
n
⫽
44), duodenum (
n
⫽
64), proximal/mid/distal jejunum (
n
⫽
46), and stool (
n
⫽
3).
At the beginning of the study, subjects were given one form of mesalamine (Table 1).
One of the seven subjects was studied three times over the course of 10 months; for
most analyses, each study visit from this subject was considered independently.
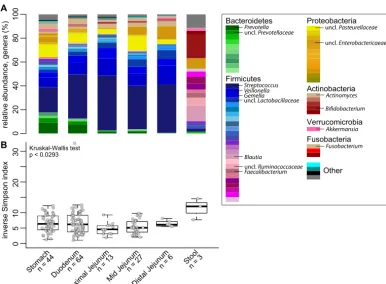
The proximal GI microbiota are dominated by
Firmicutes
and distinct from the
fecal microbiota.
Analysis of the relative abundances of 16S rRNA-encoding genes
from the GI tract across all time points and individuals demonstrated that the
small-intestinal microbiota was compositionally unique compared to stool (Fig. 1A). At all four
sites in the proximal GI tract,
Firmicutes
composed the most abundant phyla (i.e.,
Streptococcus
,
Veillonella
, and
Gemella
). Higher levels of
Bacteroidetes
species (
Pre-votella
) were detected in the stomach and duodenum.
Proteobacteria
and
Actinobac-teria
predominated in the remainder of the community at all sites. Diversity of the
microbiota (inverse Simpson index) was decreased in sites of the upper GI tract
on September 8, 2020 by guest
http://msphere.asm.org/
compared to stool, which was enriched in
Firmicutes
(
Blautia
,
Ruminococcaceae
, and
Faecalibacterium
) and depleted in
Bacteroidetes
in these individuals (
n
⫽
3) (Fig. 1B).
The proximal GI microbiota are individualized and variable over time.
To
compare the microbiota across the proximal GI tract within and across individuals, we
assessed pairwise community dissimilarity using the Yue and Clayton dissimilarity index
(
YC), which takes into account relative abundance of operational taxonomic unit (OTU)
compositional data. Both across (interindividual) and within (intraindividual) subjects,
TABLE 1Subject recruitment
Subjecta
Mesalamine
formulationb Age (yr) BMI Sex
No. of samples from:
Stomach Duodenum
Jejunum
Stool Total
Proximal Mid Distal
M046-A Pentasa 38 21.2 M 1 8 7 1 17
M046-B Apriso 38 21.3 M 8 5 6 19
M046-C Lialda 38 21.7 M 8 6 7 1 22
M047 Pentasa 36 21.1 M 8 6 14
M048 Apriso 51 34.3 F 5 7 12
M053 Apriso 34 25.2 F 1 7 3 11
M061 Pentasa 51 21.6 M 7 8 15
M062 Pentasa 37 27.3 M 7 7 1 15
M063 Lialda 26 28.6 M 7 5 5 17
M064 Lialda 25 27.5 F 8 7 15
Summary 40% Pentasa, 30% Apriso, 30% Lialda
37⫾8.6 25⫾4.4 70% M 44 64 13 27 6 3 157
aShown are selected metadata and sample collection demographics for 10 admissions. Subject M046 was admitted for three visits: A, B, and C. All subjects identified
as Caucasian, and none identified as Hispanic/Latinx.
bPentasa has immediate release in stomach acid, Apriso has extended release at a pH of⬎6, and Lialda has extended release at a pH of⬎7.
02
0
40
60
80
100
relative abundance, genera (%)
0
5
10
20
30
inverse Simpson index
Stomach n = 44
Duodenum n = 64
Proximal Jejunum n = 13
Mid Jejunum n = 27
Distal Jejunum
n = 6 Stool n = 3
Kruskal-Wallis test p < 0.0293
Bacteroidetes
Firmicutes
Proteobacteria
Actinobacteria
Verrucomicrobia
Akkermansia
Other Fusobacteria
Fusobacterium Prevotella
uncl. Lactobacillaceae uncl. Prevotellaceae
Streptococcus Gemella Veillonella
Blautia
uncl. Ruminococcaceae Faecalibacterium
uncl. Pasteurellaceae
uncl. Enterobactericaeae
Actinomyces
Bifidobacterium
A
B
FIG 1 Bacterial community relative abundance and diversity in the upper GI tract. (A) The mean relative abundance of
genera at each GI site (sample number [n] is indicated). (B) Box plots of the inverse Simpson index measuring community
diversity across the GI tract (shown as median with first and third interquartile ranges). Statistical analysis was performed with the Kruskal-Wallis test (not significant).
on September 8, 2020 by guest
http://msphere.asm.org/
stool was highly dissimilar to any proximal GI site (Fig. 2A and B). Across proximal GI
sites, subjects were more similar to their own samples than samples across other
individuals (Fig. 2A to D). The stomach microbiota were highly dissimilar across
individuals compared to the duodenum or any part of the jejunum, which exhibited the
least amount of dissimilarity (Fig. 2C). A similar degree of dissimilarity was observed
within an individual in the stomach, duodenum, and combined parts of the jejunum
(Fig. 2D).
Using a dissimilarity measure such as
YCallowed us to assess stability based on
changes in the relative abundance of OTUs. It is possible that certain GI sites fluctuate
more in total OTUs. To measure whether any site had a higher rate of flux in their
community (i.e., a higher rate of OTU turnover), we calculated the percentage of OTUs
detected at a given time point from the total number of OTUs detected within that
individual at a given site. We observed that for each proximal GI site, a mean of 36.6%
of the OTUs ever detected in that subject at a given site (mean number of total OTUs
ever detected per subject per site
⫽
135; range, 78 to 212) were detectable at a given
time point (Fig. 3A). Similarly, we calculated the number of OTUs that were consistently
present in all samples collected at that site within an individual (mean number of
consistently detected OTUs per subject per site
⫽
14.1; range, 2 to 45). Overall, only
28.7% of the total OTUs ever detected at a given time point within an individual at a
given site were represented by these consistently prevalent OTUs (Fig. 3B). However,
these prevalent OTUs explained an average of 72.0% of the relative abundance
observed in the samples (Fig. 3C). Of all sites, the relative abundance explained by the
Stomach
Duodenum Jejunum 0.0
0.2 0.4 0.6 0.8 1.0
0.0 0.2 0.4 0.6 0.8 1.0
Stomach
Duodenum Jejunum StomachDuodenum
Proxi
mal JejunumMid Jejunum
Stool Stool Distal Jejunum Mid Jejunum Proximal Jejunum Duodenum Stomach
NA
Stomach Duodenum
Proximal Jejunum
Mid JejunumDistal Jejunum Stool
Distal Jejunum Mid Jejunum Proximal Jejunum Duodenum Stomach
Stool
Distal Jejunum
Dissimilarity,
YCA
B
C
D
0 YC 1
**
*** *** ***
FIG 2 Dissimilarity of the proximal GI tract within and across individuals. (A and B) Heat map of the Yue and Clayton dissimilarity
index (YC), comparing different proximal GI sites and stool across individuals (interindividual pairwise comparisons) (A) and within
individuals (intraindividual pairwise comparisons) (B). (C and D) Interindividual (C) and intraindividual (D) dissimilarities in the stomach, duodenum, and jejunum (sites combined). Statistical analysis was performed with the Kruskal-Wallis test. We plot each sample at a given site rather than site averages, since this allows us to capture potential extreme states that those communities might adopt over time. Statistical analyses were performed with Dunn’s test for multiple comparisons with a Benjamini-Hochberg
Pvalue adjustment:**,P⬍0.001;***,P⬍0.0001.
on September 8, 2020 by guest
http://msphere.asm.org/
individual’s most prevalent OTUs in the stomach was lowest, followed by the
duode-num, suggesting more variation at these sites compared to the jejunum (Kruskal-Wallis,
P
⬍
0.05).
One subject (M046) returned three times over the course of 10 months, allowing us
to compare long-term changes. Across the sites that were sampled during multiple
visits (the duodenum and mid-jejunum), prevalent OTUs were still detected during all
three visits, explaining 74.4% and 66.1% OTUs in the duodenum and mid-jejunum,
respectively (see Fig. S1 in the supplemental material).
Large fluctuations in the duodenal microbiota are associated with pH but not
mesalamine.
We next investigated how these compositional trends changed over time
across the subjects. We focused on the duodenum and stomach since these sites were
highly sampled across and within individuals and demonstrated variable pH. In the
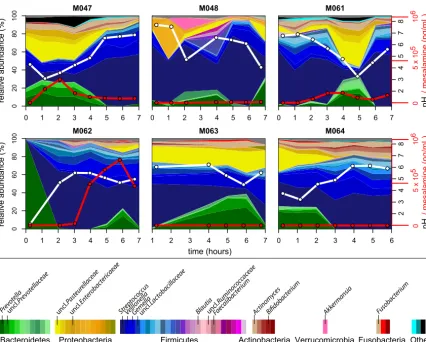
duodenum, we observed large fluctuations in genus-level composition across hourly
time points within individuals (Fig. 4; see Fig. S2 and S3 in the supplemental material).
Specifically, the relative abundance of
Streptococcus
,
Prevotella
, and an unclassified
Pasteurellaceae
species fluctuated in all individuals. We hypothesized that these
fluc-0
20
40
60
80
100
%OTUs detected
of total OTUs per patient
p < 0.652
0
2
04
06
08
0
1
0
0
% prevalent OTUs detected
in all OTUs at a given timepoint
p < 0.109
0
20
40
60
80
100
% of relative abundance
occupied by prevalent OTUs
Stomach n = 42 Duodenum n = 64 Proximal Jejunum
n = 13 Mid Jejunum n = 27
Distal Jejunum n = 6
p < 0.0241
A
B
C
FIG 3 Fluctuations in prevalent OTUs observed within an individual across the proximal GI tract. (A) Box plots of the percentage of OTUs detected in a given sample out of all OTUs detected (all OTUs possible for that individual) at a subject site. (B) Box plots of the percentage of OTUs that were consistently detected at a subject site out of the total OTUs detected in a given sample. (C) The percentage of relative abundance explained by prevalent OTUs at a subject site in a given sample. Statistical analyses were performed with the Kruskal-Wallis test.
on September 8, 2020 by guest
http://msphere.asm.org/
tuations could be driven by mesalamine, administered in different forms to each
subject at study onset. However, no visible pattern was observed with mesalamine
levels. Interestingly, we observed that these compositional changes tracked with pH
fluctuations (Fig. 4). These patterns were less apparent in the stomach, where
individ-uals displayed variable dynamics and highly individualized compositional patterns
independent of mesalamine levels or pH. A similar trend was observed in the jejunum
of the subject with three different admissions, where pH fluctuated less (Fig. S1 and S2).
To identify whether any singular OTUs correlated with changes in pH, we applied a
generalized linear mixed-model approach that takes into account subject specificity
(25–27). Within duodenal samples (
n
⫽
56), we observed 15 OTUs that significantly
correlated with pH changes. Linear regression of pH and relative abundance of these
OTUs were significant across all samples (Fig. 5; see Table S2 in the supplemental
material). Of the negatively correlated OTUs, six OTUs were classified as
Bacteroidetes
—
mainly
Prevotella
—and two OTUs were classified as
Pasteurellaceae
(
Proteobacteria
). The
majority of the OTUs that were positively correlated with pH were
Firmicutes
, mainly
Streptococcus
, alongside an
Actinomyces
OTU (
Actinobacteria
). Only one OTU in the
duodenum was significantly correlated to mesalamine (Table S2). We identified 17
OTUs that correlated with pH or mesalamine in the stomach; however, these were not
representative at all sites (Table S2).
DISCUSSION
Our results demonstrate that the microbial communities inhabiting the GI tract are
distinct and dynamic across different sites within the proximal GI tract. Our sampling
0 1 2 3 4 5 6 7
0 2 04 06 08 0 1 0 0 M047
0 1 2 3 4 5 6 7
M048
0 1 2 3 4 5 6 7
M061 2 3 4 56 7 pH 05 x 1 0 5 10 6
0 1 2 3 4 5 6 7
02 0 4 0 6 0 8 0 1 0 0 M062
1 2 3 4 5 6 7
M063
0 1 2 3 4 5 6
M064
/ mesalamine (ng/mL)
23 4 567 pH 05 x 1 0 5 10 6
/ mesalamine (ng/mL)
relative abundance (%)
relative abundance (%)
Bacteroidetes Proteobacteria Firmicutes Actinobacteria Verrucomicrobia Akke rmansia Other Fusobacteria Fusobac terium Prev otella uncl. Lactobacillac eae uncl. Prev otellac eae Strept ococ cus Gemella
Veillonella Blautiauncl
. Rum
inoco ccac eae Faec alibac terium uncl. Paste urellac eae uncl. Enter oba cteric aeae Actino myce s Bifidobacterium time (hours) 8 8
FIG 4 Longitudinal compositional dynamics, mesalamine levels, and pH in the duodenum. Shown are stream plots of genus-level
composition over time in the duodenum of six individuals (percentage as indicated on the leftyaxis, with genera color-coded according
to the color key at the bottom). White lines indicate pH measurements (blacky-axis labels on the right), and red lines indicate mesalamine
concentration (redy-axis labels on the right).
on September 8, 2020 by guest
http://msphere.asm.org/
procedure provided us with an opportunity to longitudinally characterize such
micro-bial populations in conjunction with the administration of a commonly used drug,
mesalamine. We observed high stability of the microbiota in the jejunum compared to
the stomach or duodenum, indicating that the indigenous microbiota residing in more
proximal regions of the GI tract may experience greater changes. While we did not
observe strong correlations between mesalamine concentration and particular
micro-biota members at any site, we did observe a strong correlation between the micromicro-biota
composition and pH, particularly in the duodenum.
In this report, we describe the use of a multilumen catheter design with unique
aspiration ports that enabled sampling of small-intestinal content over the course of 7
h (24). Many studies aimed at investigating the microbiota of the proximal GI have
overcome sampling difficulty in this region by using ileostoma effluent, samples from
newly deceased individuals, or naso-ileal tubes. Although easy to access, ileostoma
effluent does not fully recapitulate the distal small intestine, as it more closely
resem-bles the colon than the small intestine due to increased oxygen concentrations near the
stoma (28–31). Single lumen naso-ileal tubes are unable to sample multiple sites
simultaneously (18, 20, 21, 32). GI fluid collected with our methodology was sufficient
for determining mesalamine concentration, assaying fluid pH, and isolating microbial
DNA across time and GI sites, which has not been previously described (24).
Our results support previous observations that the small intestine is dynamic with
higher interindividual than intraindividual variability (18, 21, 33). However, the mid- to
distal small intestine also contains a resilient microbial community composed of several
highly abundant OTUs. This resilience is demonstrated by the shift from an altered to
a normal ileal microbiota following the resolution of an ileostoma (34). This mirrors the
FIG 5 Relative abundance of significant OTUs versus pH. Shown is the log relative abundance [log10(RA)] as a function of pH of OTUs found to be significantly
correlated with pH using linear mixed models (all samples with measurable pH). Lines represent linear fit per OTU. OTUs classified asFirmicutes(A),Bacteroidetes
(B),Proteobacteria(C), andActinobacteria(D) are depicted. The genus-level OTU classification is defined in the color code key in each panel.
on September 8, 2020 by guest
http://msphere.asm.org/
colonic microbiota, which also has a small community that is stable over long periods
of time (30, 35, 36).
This and other studies have shown that the jejunal and proximal ileal microbiota are
distinct from the colonic microbiota (10, 37). Despite changes in overall community
structure and an overall decrease in microbial diversity across the stomach and small
intestine compared to stool, many of the same organisms commonly observed in stool
were also present in the upper GI tract, albeit at very different abundances (10).
Interestingly, colonic resection and ileal pouch-anal anastomosis have been shown to
shift the terminal ileum microbiota to a state similar to the colon, suggesting that a
colonic community structure can develop at these sites given the right conditions (21,
31, 37–39).
Many of the abundant microbes observed in our study (
Streptococcus
,
Veillonella
,
Gemella
, and
Pasteurellaceae
species) are also common residents of the oral cavity,
which reflects the proximity of these locations in the GI tract. Populations of
Proteo-bacteria
, such as
Pasteurellaceae
, have also been observed consistently in the
small-intestinal microbiota in other studies, particularly in patients with IBD (14, 40–42). In our
study,
Streptococcus
and
Veillonella
were correlated with pH in duodenal samples. It is
possible that growth of these organisms drives a decrease in pH via metabolism of
short-chain fatty acids, an observed functional capacity of these genera (21, 43).
Conversely, large fluctuations in environmental pH may select for genera like
Strepto-coccus
, which have evolved a variety of mechanisms to control pH intracellularly
(44–47). In any case, our data suggest a relationship between microbial dynamics and
environmental physiology of the duodenum, which is an important observation to
consider when comparing this site across individuals.
We observed little association between mesalamine concentration and changes in
microbial relative abundance in our cohort. Several studies have reported differences in
the fecal microbiota of patients with or without IBD, in particular Crohn’s disease, which
can affect the small intestine (40). Compositional shifts in the small intestine have been
reported during IBD, specifically increased levels of
Enterobacteriaceae
species, such as
Enterococcus
,
Fusobacterium
, or
Haemophilus
(14, 41, 42). It has been hypothesized that
mesalamine’s ability to reduce inflammation in patients with ulcerative colitis could be
by altering the microbiota (22, 23). While acute effects of mesalamine on the microbiota
have not previously been reported, earlier work has demonstrated that mesalamine
decreases bacterial polyphosphate accumulation and pathogen fitness, suggesting an
influence on the microbiota (23). We did not observe strong correlations between
mesalamine concentration and the microbiota here. However, our study was small,
used different doses of mesalamine that may be metabolized differently across GI sites,
and was conducted in healthy individuals (24). It is possible that mesalamine is less
likely to impact the small-intestinal microbiota compared to the large intestine; indeed,
mesalamine is historically known to have a lower efficacy in treating Crohn’s disease,
which manifests in the small intestine, compared to ulcerative colitis, which manifests
in the large intestine (22, 48, 49). As indicated by the variability of mesalamine in the
subjects in this study, the effects of mesalamine on the small-intestinal microbiota may
be highly individualized (24, 50–52). Furthermore, individuals with disease may harbor
a distinct microbiota that responds to mesalamine differently.
Despite the opportunity provided by our method to describe the microbiota across
the GI tract, our study has some lingering questions. Movement by the subject during
the study can result in movement of each sampling port, particularly between the distal
stomach and antrum. This may explain the inconsistent pH values and severe
fluctu-ations of the microbiota observed in the stomach. Similarly, the shorter length of the
sampling device, compared to a naso-ileal catheter, prevented reliable collection of
fluid from the distal small intestine, limiting our sampling to the proximal region. We
also were limited to three concurrent fecal samples, each of which was low in
Bacte-roidetes
, a profile generally observed in individuals on low-fat, high-fiber, non-Western
diets (53). While this could have been due to the influence of mesalamine on the
colonic microbiota, we did not have a sufficient
n
to test this hypothesis.
on September 8, 2020 by guest
http://msphere.asm.org/
The use of a novel catheter allowed us to assess the microbiota across several
proximal GI sites over time, representing a powerful clinical and/or investigative tool for
studying the small-intestinal microbiota. Future studies on the upper GI microbiota
should collect concurrent oral swab/sputum and fecal samples to strengthen the ability
to “track” microbial populations across the GI tract, potentiating our ability to correlate
the microbiota from fecal sampling, a more convenient method to study the
microbi-ota, to other sites of the GI tract.
MATERIALS AND METHODS
Study recruitment. Healthy individuals (ages 18 to 55 years) were included who were free of
medications for the past 2 weeks, passed a routine health screening, had a body mass index (BMI) of 18.5 to 35, and had no significant clinical illness within 3 weeks. Health screening included a review of medical history and a physical examination (checking vital signs, electrocardiography, and clinical laboratory tests) as described by Yu et al. (24).
Catheter design and sterilization.A customized multichannel catheter was constructed by
Arn-dorfer, Inc. (Greendale, WI), consisting of independent aspiration ports located 50 cm apart. The catheter had a channel to fit a 0.035-in. by 450-cm guide wire (Boston Scientific, Marlborough, MA), a channel connected to a balloon that could be filled with 7 ml of water to assist tube placement, and an end that was weighted with 7.75 g of tungsten. Each single-use catheter was sterilized according to guidelines set by the American Society for Gastrointestinal Endoscopy at the University of Michigan prior to insertion (54) (Text S1).
Collection of GI fluid samples. The full details of catheter placement have been described
previously (24). Briefly, catheter placement occurred approximately 12 h before sample collection. The catheter was orally inserted into the GI tract, with aspiration ports located in the stomach, duodenum, and the proximal, mid-, and distal jejunum, confirmed by fluoroscopy. Subjects were given a light liquid snack approximately 11 h before sample collection and fasted overnight for 10 h prior to sample collection. At 0 h, a mesalamine formulation was administered to each subject (Table 1). Luminal GI fluid samples (approximately 1.0 ml) were collected from up to four sites of the upper GI tract hourly up to
7 h. Samples were collected by syringe, transferred to sterile tubes, and placed at⫺80°C until sample
processing. A paired sample was collected to detect pH using a calibrated micro-pH electrode (Orion pH probe catalog no. 9810BN; Thermo Scientific, Waltham, MA).
DNA extraction and Illumina MiSeq sequencing.The detailed protocol for DNA extraction and
Illumina MiSeq sequencing was followed as previously described with modifications (55) (Text S1). Briefly, 0.2 ml of GI fluid or 20 mg of stool was used for DNA isolation using a Qiagen (Germantown, MD) MagAttract Powermag microbiome DNA isolation kit (catalog no. 27500-4-EP). Barcoded dual-index primers specific to the V4 region of the 16S rRNA gene were used to amplify the DNA (56), using a “touchdown PCR” protocol (Text S1). Multiple negative controls were run parallel to each PCR. PCR mixtures were normalized, pooled, and quantified (56). Libraries were prepared and sequenced using the 500-cycle MiSeq V2 reagent kit (catalog no. MS-102-2003; Illumina, San Diego, CA). Raw FASTQ files, including those for negative controls, were deposited in the Sequence Read Archive (SRA) database.
Data processing and microbiota analysis.Analysis of the V4 region of the 16S rRNA gene was done
using mothur (v1.39.3) (56, 57). Full methods, including detailed processing steps, raw processed data, and code for each analysis, are described in GitHub. Briefly, following assembly, quality filtering, and trimming, reads were aligned to the SILVA 16S rRNA sequence database (v128) (58). Chimeric sequences were removed using UCHIME (59). Prior to analysis, both mock and negative-control samples (water)
were assessed for potential contamination; samples with⬍2,500 sequences were excluded (Table S1).
Sequences were binned into operational taxonomic units (OTUs), with 97% similarity, using the opticlust algorithm (60). The Ribosomal Database Project (v16) was used to classify OTUs or sequences directly for
compositional analyses (⬎80% confidence score) (61). Alpha and beta diversity measures (inverse
Simpson index and the Yue and Clayton dissimilarity index [YC]) were calculated from unfiltered OTU
data (62). Basic R commands were used to visualize results, calculate percentage of OTUs shared between samples, and conduct statistics, using the packages plyr, dplyr, gplots, tidyr, and tidyverse. The
non-parametric Kruskal-Wallis test, using Dunn’s test for multiple comparisons and adjustingPvalues with the
Benjamini-Hochberg method when indicated, was used for multigroup comparisons. The R packages lme4 and lmerTest were used for mixed linear models for comparisons between OTU relative abundance (filtered to include OTUs present in at least half of samples collected from a subject per site) and pH or mesalamine (63, 64).
Ethics approval and consent to participate.Samples collected in this study were part of clinical
trial NCT01999400. The institutional review boards at the University of Michigan (IRBMED) and the Department of Health and Human Services, Food and Drug Administration (Research Involving Human Subjects Committee [RIHSC]), both approved the study protocol (IRB approved on 4 February 2015). All subjects provided written informed consent in order to participate. Informed consent was obtained from individuals prior to the time of sampling.
Availability of data.Raw FASTQ files, including those for negative controls, were deposited in
the SRA database under BioProject ID no. PRJNA495320 and BioSample ID no.SAMN10224451 to
SAMN10224634. Detailed processing steps, raw processed data, and code for each analysis are described
in GitHub athttps://github.com/aseekatz/SI_mesalamine.
on September 8, 2020 by guest
http://msphere.asm.org/
SUPPLEMENTAL MATERIAL
Supplemental material for this article may be found at
https://doi.org/10.1128/
mSphere.00126-19
.
TEXT S1
, PDF file, 0.2 MB.
FIG S1
, PDF file, 0.1 MB.
FIG S2
, PDF file, 0.4 MB.
FIG S3
, PDF file, 0.3 MB.
TABLE S1
, XLSX file, 0.4 MB.
TABLE S2
, XLSX file, 0.1 MB.
ACKNOWLEDGMENTS
This research was funded by FDA grant HHSF223201000082C. Clinical samples were
collected with help from the Michigan Institute for Clinical and Health Research (MICHR)
NIH grant UL1TR000433. This research was funded by the FDA (HHSF223201000082C)
and the NIH (5U01AI124255-03).
We also thank the Host Microbiome Initiative and the Microbial Systems Molecular
Biology Laboratory at the University of Michigan for their support of the 16S rRNA
sequencing and Krishna Rao and Rose Putler for their assistance with the modeling and
statistical analyses.
The authors declare they have no conflicts of interest.
M.J.K., D.S., B.E.B., A.M.S., V.B.Y., and M.K.S. contributed to the conception or design
of the work. M.J.K., B.E.B., W.L.H., and J.R.B. performed data collection. A.M.S., M.J.K., and
M.K.S. performed data analysis and interpretation. M.K.S. and A.M.S. drafted the article.
M.K.S., A.M.S., D.S., and V.B.Y. performed critical revision of the article. A.M.S., M.K.S.,
M.J.K., J.R.B., W.L.H., B.E.B., V.B.Y., and D.S. gave final approval of the version to be
published.
REFERENCES
1. El Aidy S, van den Bogert B, Kleerebezem M. 2015. The small intestine microbiota, nutritional modulation and relevance for health. Curr Opin
Biotechnol 32:14 –20.https://doi.org/10.1016/j.copbio.2014.09.005.
2. Poulakos L, Kent TH. 1973. Gastric emptying and small intestinal pro-pulsion in fed and fasted rats. Gastroenterology 64:962–967. 3. Ridlon JM, Kang DJ, Hylemon PB, Bajaj JS. 2014. Bile acids and the gut
microbiome. Curr Opin Gastroenterol 30:332–338. https://doi.org/10
.1097/MOG.0000000000000057.
4. Araújo JR, Tomas J, Brenner C, Sansonetti PJ. 2017. Impact of high-fat diet on the intestinal microbiota and small intestinal physiology before
and after the onset of obesity. Biochimie 141:97–106.https://doi.org/10
.1016/j.biochi.2017.05.019.
5. Martinez-Guryn K, Hubert N, Frazier K, Urlass S, Musch MW, Ojeda P, Pierre JF, Miyoshi J, Sontag TJ, Cham CM, Reardon CA, Leone V, Chang EB. 2018. Small intestine microbiota regulate host digestive and absorp-tive adapabsorp-tive responses to dietary lipids. Cell Host Microbe 23:
458 – 469.e5.https://doi.org/10.1016/j.chom.2018.03.011.
6. Flynn KJ, Ruffin MT, Turgeon DK, Schloss PD. 2018. Spatial variation of the native colon microbiota in healthy adults. Cancer Prev Res (Phila)
11:393– 402.https://doi.org/10.1158/1940-6207.CAPR-17-0370.
7. Falony G, Vieira-Silva S, Raes J. 2018. Richness and ecosystem develop-ment across faecal snapshots of the gut microbiota. Nat Microbiol
3:526 –528.https://doi.org/10.1038/s41564-018-0143-5.
8. Sekirov I, Russell SL, Antunes LCM, Finlay BB. 2010. Gut microbiota in
health and disease. Physiol Rev 90:859 –904.https://doi.org/10.1152/
physrev.00045.2009.
9. Donaldson GP, Lee SM, Mazmanian SK. 2016. Gut biogeography of the
bacterial microbiota. Nat Rev Microbiol 14:20.https://doi.org/10.1038/
nrmicro3552.
10. Zmora N, Zilberman-Schapira G, Suez J, Mor U, Dori-Bachash M, Bashiardes S, Kotler E, Zur M, Regev-Lehavi D, Brik RB, Federici S, Cohen Y, Linevsky R, Rothschild D, Moor AE, Ben-Moshe S, Harmelin A, Itzkovitz S, Maharshak N, Shibolet O, Shapiro H, Pevsner-Fischer M, Sharon I, Halpern Z, Segal E, Elinav E. 2018. Personalized gut mucosal colonization resistance to empiric probiotics is associated with unique host and
microbiome features. Cell 174:1388 –1405.e21.https://doi.org/10.1016/j
.cell.2018.08.041.
11. Hayashi H, Takahashi R, Nishi T, Sakamoto M, Benno Y. 2005. Molecular analysis of jejunal, ileal, caecal and recto-sigmoidal human colonic microbiota using 16S rRNA gene libraries and terminal restriction
frag-ment length polymorphism. J Med Microbiol 54:1093–1101.https://doi
.org/10.1099/jmm.0.45935-0.
12. Wang M, Ahrné S, Jeppsson B, Molin G. 2005. Comparison of bacterial diversity along the human intestinal tract by direct cloning and
sequenc-ing of 16S rRNA genes. FEMS Microbiol Ecol 54:219 –231.https://doi.org/
10.1016/j.femsec.2005.03.012.
13. Wang X, Heazlewood SP, Krause DO, Florin THJ. 2003. Molecular char-acterization of the microbial species that colonize human ileal and colonic mucosa by using 16S rDNA sequence analysis. J Appl Microbiol
95:508 –520.https://doi.org/10.1046/j.1365-2672.2003.02005.x.
14. Dey N, Soergel DA, Repo S, Brenner SE. 2013. Association of gut micro-biota with post-operative clinical course in Crohn’s disease. BMC
Gas-troenterol 13:131.https://doi.org/10.1186/1471-230X-13-131.
15. Barrett E, Guinane CM, Ryan CA, Dempsey EM, Murphy BP, O’Toole PW, Fitzgerald GF, Cotter PD, Ross RP, Stanton C. 2013. Microbiota diversity and stability of the preterm neonatal ileum and colon of two infants.
Microbiologyopen 2:215–225.https://doi.org/10.1002/mbo3.64.
16. Di Pilato V, Freschi G, Ringressi MN, Pallecchi L, Rossolini GM, Bechi P. 2016. The esophageal microbiota in health and disease. Ann N Y Acad
Sci 1381:21–33.https://doi.org/10.1111/nyas.13127.
17. Verma D, Garg PK, Dubey AK. 2018. Insights into the human oral
micro-biome. Arch Microbiol 200:525–540. https://doi.org/10.1007/s00203-018
-1505-3.
18. Booijink CC, El Aidy S, Rajilic´-Stojanovic´ M, Heilig HG, Troost FJ, Smidt H, Kleerebezem M, Vos WM, Zoetendal EG. 2010. High temporal and inter-individual variation detected in the human ileal microbiota.
Environ Microbiol 12:3213–3227.https://doi.org/10.1111/j.1462-2920
.2010.02294.x.
19. den Bogert B, Erkus O, Boekhorst J, Goffau M, Smid EJ, Zoetendal EG, Kleerebezem M. 2013. Diversity of human small intestinal Streptococcus
on September 8, 2020 by guest
http://msphere.asm.org/
and Veillonella populations. FEMS Microbiol Ecol 85:376 –388.https://
doi.org/10.1111/1574-6941.12127.
20. Angelakis E, Armougom F, Carrière F, Bachar D, Laugier R, Lagier J-C, Robert C, Michelle C, Henrissat B, Raoult D. 2015. A metagenomic investigation of the duodenal microbiota reveals links with obesity. PLoS
One 10:e0137784.https://doi.org/10.1371/journal.pone.0137784.
21. Zoetendal EG, Raes J, van den Bogert B, Arumugam M, Booijink CC, Troost FJ, Bork P, Wels M, de Vos WM, Kleerebezem M. 2012. The human small intestinal microbiota is driven by rapid uptake and conversion of simple
carbohydrates. ISME J 6:1415.https://doi.org/10.1038/ismej.2011.212.
22. Hauso Ø, Martinsen TC, Waldum H. 2015. 5-Aminosalicylic acid, a specific
drug for ulcerative colitis. Scand J Gastroenterol 50:933–941.https://doi
.org/10.3109/00365521.2015.1018937.
23. Dahl J-U, Gray MJ, Bazopoulou D, Beaufay F, Lempart J, Koenigsknecht MJ, Wang Y, Baker JR, Hasler WL, Young VB, Sun D, Jakob U. 2017. The anti-inflammatory drug mesalamine targets bacterial polyphosphate
accumulation. Nat Microbiol 2:16267.https://doi.org/10.1038/nmicrobiol
.2016.267.
24. Yu A, Baker JR, Fioritto AF, Wang Y, Luo R, Li S, Wen B, Bly M, Tsume Y, Koenigsknecht MJ, Zhang X, Lionberger R, Amidon GL, Hasler WL, Sun D. 2017. Measurement of in vivo gastrointestinal release and dissolution of three locally acting mesalamine formulations in regions of the human
gastrointestinal tract. Mol Pharm 14:345–358.https://doi.org/10.1021/
acs.molpharmaceut.6b00641.
25. Xia Y, Sun J. 2017. Hypothesis testing and statistical analysis of microbiome.
Genes Dis 4:138–148.https://doi.org/10.1016/j.gendis.2017.06.001.
26. Gajer P, Brotman RM, Bai G, Sakamoto J, Schutte UM, Zhong X, Koenig SS, Fu L, Ma ZS, Zhou X, Abdo Z, Forney LJ, Ravel J. 2012. Temporal dynamics of the human vaginal microbiota. Sci Transl Med 4:132ra52.
https://doi.org/10.1126/scitranslmed.3003605.
27. Mehta SD, Donovan B, Weber KM, Cohen M, Ravel J, Gajer P, Gilbert D, Burgad D, Spear GT. 2015. The vaginal microbiota over an 8- to 10-year period in a cohort of HIV-infected and HIV-uninfected women. PLoS One
10:e0116894.https://doi.org/10.1371/journal.pone.0116894.
28. Heimesaat MM, Boelke S, Fischer A, Haag L-M, Loddenkemper C, Kühl AA, Göbel UB, Bereswill S. 2012. Comprehensive postmortem analyses of intestinal microbiota changes and bacterial translocation in human flora
associated mice. PLoS One 7:e40758. https://doi.org/10.1371/journal
.pone.0040758.
29. DeBruyn JM, Hauther KA. 2017. Postmortem succession of gut microbial
communities in deceased human subjects. PeerJ 5:e3437.https://doi
.org/10.7717/peerj.3437.
30. Fukuyama J, Rumker L, Sankaran K, Jeganathan P, Dethlefsen L, Relman DA, Holmes SP. 2017. Multidomain analyses of a longitudinal human microbiome intestinal cleanout perturbation experiment. PLoS Comput
Biol 13:e1005706.https://doi.org/10.1371/journal.pcbi.1005706.
31. Young VB, Raffals LH, Huse SM, Vital M, Dai D, Schloss PD, Brulc JM, Antonopoulos DA, Arrieta RL, Kwon JH, Reddy KG, Hubert NA, Grim SL, Vineis JH, Dalal S, Morrison HG, Eren AM, Meyer F, Schmidt TM, Tiedje JM, Chang EB, Sogin ML. 2013. Multiphasic analysis of the temporal development of the distal gut microbiota in patients following ileal
pouch anal anastomosis. Microbiome 1:9.https://doi.org/10.1186/2049
-2618-1-9.
32. Muller-Lissner SA, Fimmel CJ, Will N, Muller-Duysing W, Heinzel F, Blum AL. 1982. Effect of gastric and transpyloric tubes on gastric emptying and duodenogastric reflux. Gastroenterology 83:1276.
33. Onishi JC, Campbell S, Moreau M, Patel F, Brooks AI, Zhou YX, Häggblom MM, Storch J. 2017. Bacterial communities in the small intestine respond differently to those in the caecum and colon in mice fed low- and
high-fat diets. Microbiology 163:1189 –1197.https://doi.org/10.1099/mic
.0.000496.
34. Hartman AL, Lough DM, Barupal DK, Fiehn O, Fishbein T, Zasloff M, Eisen JA. 2009. Human gut microbiome adopts an alternative state following small bowel transplantation. Proc Natl Acad Sci U S A 106:17187–17192.
https://doi.org/10.1073/pnas.0904847106.
35. Caporaso JG, Lauber CL, Costello EK, Berg-Lyons D, Gonzalez A, Stom-baugh J, Knights D, Gajer P, Ravel J, Fierer N, Gordon JI, Knight R. 2011.
Moving pictures of the human microbiome. Genome Biol 12:R50.https://
doi.org/10.1186/gb-2011-12-5-r50.
36. Dethlefsen L, Relman DA. 2011. Incomplete recovery and individualized responses of the human distal gut microbiota to repeated antibiotic
perturbation. Proc Natl Acad Sci U S A 108:4554 – 4561.https://doi.org/
10.1073/pnas.1000087107.
37. Villmones HC, Haug ES, Ulvestad E, Grude N, Stenstad T, Halland A,
Kommedal Ø. 2018. Species level description of the human ileal bacterial
microbiota. Sci Rep 8:4736.https://doi.org/10.1038/s41598-018-23198-5.
38. Hinata M, Kohyama A, Ogawa H, Haneda S, Watanabe K, Suzuki H, Shibata C, Funayama Y, Takahashi K-i, Sasaki I, Fukushima K. 2012. A shift from colon- to ileum-predominant bacteria in ileal-pouch feces
follow-ing total proctocolectomy. Dig Dis Sci 57:2965–2974.https://doi.org/10
.1007/s10620-012-2165-9.
39. Maharshak N, Cohen NA, Reshef L, Tulchinsky H, Gophna U, Dotan I. 2017. Alterations of enteric microbiota in patients with a normal ileal
pouch are predictive of pouchitis. J Crohns Colitis 11:314 –320.https://
doi.org/10.1093/ecco-jcc/jjw157.
40. Harris KG, Chang EB. 2018. The intestinal microbiota in the pathogenesis of inflammatory bowel diseases: new insights into complex disease. Clin
Sci (Lond) 132:2013–2028.https://doi.org/10.1042/CS20171110.
41. De Cruz P, Kang S, Wagner J, Buckley M, Sim WH, Prideaux L, Lockett T, McSweeney C, Morrison M, Kirkwood CD, Kamm MA. 2015. Association between specific mucosa-associated microbiota in Crohn’s disease at the time of resection and subsequent disease recurrence: a pilot study.
J Gastroenterol Hepatol 30:268 –278.https://doi.org/10.1111/jgh.12694.
42. Gevers D, Kugathasan S, Denson LA, Vazquez-Baeza Y, Van Treuren W, Ren B, Schwager E, Knights D, Song SJ, Yassour M, Morgan XC, Kostic AD, Luo C, Gonzalez A, McDonald D, Haberman Y, Walters T, Baker S, Rosh J, Stephens M, Heyman M, Markowitz J, Baldassano R, Griffiths A, Sylvester F, Mack D, Kim S, Crandall W, Hyams J, Huttenhower C, Knight R, Xavier RJ. 2014. The treatment-naive microbiome in new-onset Crohn’s disease. Cell Host
Mi-crobe 15:382–392.https://doi.org/10.1016/j.chom.2014.02.005.
43. Pancholi V, Caparon C. 2016. Streptococcus pyogenes metabolism.In
Ferretti JJ, Stevens DL, Fischetti VA (ed), Streptococcus pyogenes: basic biology to clinical manifestations. University of Oklahoma Health Sci-ences Center, Oklahoma City, OK.
44. Scott KP, Gratz SW, Sheridan PO, Flint HJ, Duncan SH. 2013. The
influ-ence of diet on the gut microbiota. Pharmacol Res 69:52– 60.https://doi
.org/10.1016/j.phrs.2012.10.020.
45. Abuhelwa AY, Williams DB, Upton RN, Foster DJR. 2017. Food, gastroin-testinal pH, and models of oral drug absorption. Eur J Pharm Biopharm
112:234 –248.https://doi.org/10.1016/j.ejpb.2016.11.034.
46. Lund P, Tramonti A, De Biase D. 2014. Coping with low pH: molecular strategies in neutralophilic bacteria. FEMS Microbiol Rev 38:1091–1125.
https://doi.org/10.1111/1574-6976.12076.
47. Bradshaw D, Marsh PD. 1998. Analysis of pH-driven disruption of oral
microbial communities in vitro. Caries Res 32:456 – 462.https://doi.org/
10.1159/000016487.
48. Wright EK, Kamm MA, Teo SM, Inouye M, Wagner J, Kirkwood CD. 2015. Recent advances in characterizing the gastrointestinal microbiome in Crohn’s disease: a systematic review. Inflamm Bowel Dis 21:1219 –1228.
https://doi.org/10.1097/MIB.0000000000000382.
49. Lim WC, Wang Y, MacDonald JK, Hanauer S. 2016. Aminosalicylates for induction of remission or response in Crohn’s disease. Cochrane
Data-base Syst Rev 7:CD008870.https://doi.org/10.1002/14651858.CD008870
.pub2.
50. Allocca M, Landi R, Bonovas S, Fiorino G, Papa A, Spinelli A, Furfaro F, Peyrin-Biroulet L, Armuzzi A, Danese S. 2017. Effectiveness of mesalazine, thiopurines and tumour necrosis factor antagonists in preventing post-operative Crohn’s disease recurrence in a real-life setting. Digestion
96:166 –172.https://doi.org/10.1159/000480231.
51. Hanauer SB, Korelitz BI, Rutgeerts P, Peppercorn MA, Thisted RA, Cohen RD, Present DH. 2004. Postoperative maintenance of Crohn’s disease remission with 6-mercaptopurine, mesalamine, or placebo: a 2-year trial.
Gastroenterology 127:723–729.https://doi.org/10.1053/j.gastro.2004.06
.002.
52. Singh S, Nguyen GC. 2017. Management of Crohn’s disease after surgical
resection. Gastroenterol Clin North Am 46:563–575.https://doi.org/10
.1016/j.gtc.2017.05.011.
53. Smits SA, Leach J, Sonnenburg ED, Gonzalez CG, Lichtman JS, Reid G, Knight R, Manjurano A, Changalucha J, Elias JE, Dominguez-Bello MG, Sonnenburg JL. 2017. Seasonal cycling in the gut microbiome of the
Hadza hunter-gatherers of Tanzania. Science 357:802– 806.https://doi
.org/10.1126/science.aan4834.
54. ASGE Quality Assurance in Endoscopy Committee, Petersen BT, Chennat J, Cohen J, Cotton PB, Greenwald DA, Kowalski TE, Krinsky ML, Park WG, Pike IM, Romagnuolo J, Society for Healthcare Epidemiology of America, Rutala WA. 2011. Multisociety guideline on reprocessing flexible
gastro-intestinal endoscopes: 2011. Gastrointest Endosc 73:1075–1084.https://
doi.org/10.1016/j.gie.2011.03.1183.
on September 8, 2020 by guest
http://msphere.asm.org/
55. Seekatz AM, Theriot CM, Molloy CT, Wozniak KL, Bergin IL, Young VB. 2015. Fecal microbiota transplantation eliminates Clostridium difficile in a murine model of relapsing disease. Infect Immun 83:3838 –3846.
https://doi.org/10.1128/IAI.00459-15.
56. Kozich JJ, Westcott SL, Baxter NT, Highlander SK, Schloss PD. 2013. Development of a dual-index sequencing strategy and curation pipeline for analyzing amplicon sequence data on the MiSeq Illumina sequencing
platform. Appl Environ Microbiol 79:5112–5120.https://doi.org/10.1128/
AEM.01043-13.
57. Schloss PD, Westcott SL, Ryabin T, Hall JR, Hartmann M, Hollister EB, Lesniewski RA, Oakley BB, Parks DH, Robinson CJ, Sahl JW, Stres B, Thallinger GG, Van Horn DJ, Weber CF. 2009. Introducing mothur: open-source, platform-independent, community-supported software for de-scribing and comparing microbial communities. Appl Environ Microbiol
75:7537–7541.https://doi.org/10.1128/AEM.01541-09.
58. Pruesse E, Quast C, Knittel K, Fuchs BM, Ludwig W, Peplies J, Glockner FO. 2007. SILVA: a comprehensive online resource for quality checked and aligned ribosomal RNA sequence data compatible with ARB. Nucleic
Acids Res 35:7188 –7196.https://doi.org/10.1093/nar/gkm864.
59. Edgar RC, Haas BJ, Clemente JC, Quince C, Knight R. 2011. UCHIME
improves sensitivity and speed of chimera detection. Bioinformatics
27:2194 –2200.https://doi.org/10.1093/bioinformatics/btr381.
60. Westcott SL, Schloss PD. 2017. OptiClust, an improved method for assigning amplicon-based sequence data to operational taxonomic
units. mSphere 2:e00073-17.https://doi.org/10.1128/mSphereDirect
.00073-17.
61. Cole JR, Wang Q, Cardenas E, Fish J, Chai B, Farris RJ, Kulam-Syed-Mohideen AS, McGarrell DM, Marsh T, Garrity GM, Tiedje JM. 2009. The Ribosomal Database Project: improved alignments and new tools for
rRNA analysis. Nucleic Acids Res 37:D141–D145.https://doi.org/10.1093/
nar/gkn879.
62. Yue JC, Clayton MK. 2005. A similarity measure based on species
pro-portions. Commun Stat Theory Methods 34:2123–2131.https://doi.org/
10.1080/STA-200066418.
63. Bates D, Mächler M, Bolker B, Walker S. 2015. Fitting linear mixed-effects
models using lme4. J Stat Software 67:1– 48.https://doi.org/10.18637/
jss.v067.i01.
64. Kuznetsova A, Brockhoff PB, Christensen RHB. 2017. lmerTest package:
tests in linear mixed effects models. J Stat Software 82:1–26.https://doi
.org/10.18637/jss.v082.i13.