Proc. IAHS, 372, 83–87, 2015 proc-iahs.net/372/83/2015/ doi:10.5194/piahs-372-83-2015
© Author(s) 2015. CC Attribution 3.0 License.
Open Access
v
ention
and
mitigation
of
natur
al
and
anthropogenic
hazards
due
to
land
subsidence
Towards a global land subsidence map
G. Erkens1,2and E. H. Sutanudjaja1,2
1Deltares Research Institute, Utrecht, the Netherlands
2Utrecht University, Utrecht, the Netherlands
Correspondence to: G. Erkens ([email protected])
Published: 12 November 2015
Abstract. Land subsidence is a global problem, but a global land subsidence map is not available yet. Such map is crucial to raise global awareness of land subsidence, as land subsidence causes extensive damage (probably in the order of billions of dollars annually). With the global land subsidence map relative sea level rise predictions may be improved, contributing to global flood risk calculations.
In this paper, we discuss the approach and progress we have made so far in making a global land subsidence map. Initial results will be presented and discussed, and we give an outlook on the work needed to derive a global land subsidence map.
1 Introduction
Although its impact on flood risk is locally outranging the impact of absolute sea level rise, over the last decades land subsidence retrieved much less attention in terms of research. One of the reasons for this is the unknown extent of land sub-sidence around the world, in contrast to absolute sea level rise. For the latter, there are models that predict global abso-lute sea level rise (Church et al., 2013). For land subsidence there are many examples around the world, but a compre-hensive picture of the global extent is currently unavailable. This originates from the heterogeneity of the land subsidence signal: an array of potential drivers and the heterogeneous subsurface hydrology and geology, makes land subsidence mainly a local phenomenon on a global scale.
A map showing the extent of land subsidence around the world, the global land subsidence map, would be very use-ful. It would raise awareness among scientist and policymak-ers alike. The land subsidence rates could be used – together with regional absolute sea level rise predictions – to estimate relative sea level rise in coastal areas. This serves as input for flood risk calculations. Lastly, a global land subsidence map would not only locate current land subsidence hotspots but also help to identify future sinking areas under predicted socio-economic development scenarios.
The maps that come close to a global land subsidence map are those based on a collection of globally spread case stud-ies. However, these have two major limitations:
i. They are static and show the current land subsidence rates, but not necessarily at a single moment in time. They also have no predictive power.
ii. They are biased towards well-studied areas. Large cities or classic study sites in western countries show up most prominently.
Considering these limitations, we set out to produce a global land subsidence map that is derived from numerical model calculations. In this way, we are able to introduce a temporal component showing both historical and predicted future land subsidence under different development scenarios.
In this paper, we discuss the approach and progress we have made so far. Initial results will be presented and dis-cussed, and we give an outlook on the work needed to derive a global land subsidence map.
2 The approach
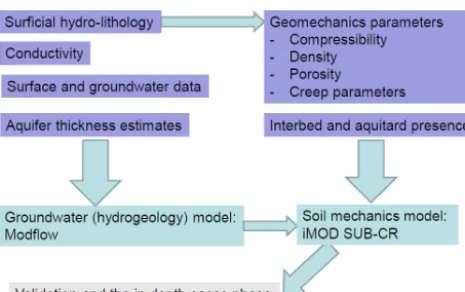
Figure 1.The proposed model suite to derive a global land sub-sidence map consists of three coupled models: the surface water model, the ground water model and a soil mechanics model.
to one driver. One of the most prominent causes for land subsidence is aquifer compaction as a result of excessive groundwater extraction for domestic, agricultural and indus-trial use (Galloway and Burbey, 2011). For instance, the Vietnamese Mekong Delta sinks on average 1.6 cm yr−1, at-tributed to groundwater extraction (Erban et al., 2014). Cru-cially, in many coastal mega-cities, land subsidence is ac-celerated by ongoing urbanization and related increased de-mands for (ground) water. In Jakarta land subsidence is up to 20 cm yr−1(Abidin et al., 2008). With ongoing economic de-velopment in the near future the expectation is that ground-water abstraction and, consequently, land subsidence rates, will accelerate and areas affected will expand as well as. Therefore, in this paper, we chose to focus on aquifer ab-straction induced land subsidence and present our numerical approach on constructing a global land subsidence map.
Figure 1 illustrates different the model components used in this study. The integrated global hydrological and water resources model, PCR-GLOBWB (Van Beek et al., 2011; Sutanudjaja et al., 2015; Van Beek, 2008; Van Beek and Bierkens, 2009), serves as the starting point. The model is fed by global meteorological forcing data (i.e. precipitation, temperature and reference potential evaporation) and param-eterized based on only global datasets (for an extensive list, see e.g. Sutanudjaja et al., 2011). PCR-GLOBWB simulates daily river discharge and groundwater recharge, as well as surface water and groundwater abstraction rates. The latter are estimated internally within the model based on the simu-lation of their availabilities and water demands for irrigation and other sectors (De Graaf et al., 2014; Wada et al., 2014). The daily output of PCR-GLOBWB would then be aggre-gated to the monthly resolution and used to force the MOD-FLOW groundwater model (McDonald and Harbaugh, 1988; Sutanudjaja et al., 2011, 2014) resolving spatio-temporal groundwater head dynamics, incorporating the simulated groundwater abstraction of PCR-GLOBWB. Subsequently, the simulated monthly groundwater head changes are fed into
In this study we perform all aforementioned model simula-tions for the period 1958–2010. Our results are focused on the simulation results of PCR-GLOBWB that are fed in the MODFLOW model, particularly the rates of groundwater de-pletion, i.e. the abstraction of groundwater stores that are not being replenished by groundwater recharge. More specifi-cally, we present and summarize the groundwater depletion rates in urban areas.
3.1 First attempt: depletion in urban area missed Figure 2 shows first results for the island of Java, Indonesia. This is an area that is well known for its extensive land sub-sidence as a result ground water extraction. The map shows the depletion of ground water as calculated by the PCR-GLOBWB hydrology model. Most of the areas that show depletion are irrigation areas, where the model suggests that groundwater is excessively used. Large urban areas, such as Jakarta, with well-known depletion of groundwater and re-lated land subsidence, are completely missed.
This misconception is attributed to the previous assump-tion in the PCR-GLOBWB model that simplifies that the fraction of water demands that is satisfied by groundwater resource (GWfrac) as a ratio between simulated baseflow and river discharge. Agricultural irrigation results in a high wa-ter demand, and because the river discharge in those areas is dominated by baseflow, the model assumes the use of groundwater. While in the urban area of Jakarta where river flows are not baseflow dominant, water demands are lower and as a result, surface water availability as simulated for Jakarta is sufficient for the domestic and industrial water de-mand. However, in reality, the urban areas in Java rely on ground water as a clean and reliable source of water. In turn, it is foremost surface water that is used for irrigation in Java.
Figure 2.Screen shot of initial depletion (m yr−1) results as calculated by the global hydrology model for the island of Java, Indonesia. It shows the depletion of the groundwater as a result of abstraction for irrigation of agricultural areas, but misses known depleted urban areas, such as Jakarta.
Table 1.Calculated depletion (m yr−1for the period 2000–2010) for a selection of cities that are known to subside.
Country City Depletion (m yr−1)
United States San Jose 3.27 Mexico Mexico City 1.30 United States Tucson 1.29 United States San Francisco 1.25
Iran Tehran 1.23
United States Sacramento 1.18
aforementioned inventories. This outcome resembles much closer the expected outcome: dominant depletion in the ur-ban areas.
In Fig. 4, the results of the same model run for the South China Sea area are depicted (depletion in m yr−1). This matches known areas of subsidence and groundwater extrac-tion, such as the western half of Taiwan, the cities of Hong Kong, Shanghai, Qingdao and Beijing. It also captured the North China Plain, which is an agricultural area with strongly depleted aquifers. These results give confidence in the valid-ity of the model.
3.3 A global city database of groundwater abstractions and discussion
Based on the model calculations, we are now able provide de-pletion per year for different urban areas. Table 1 lists some examples of calculated depletion rates for a selected number of cities for the period 2000–2010.
Most of the cities that are known to have depletion of the aquifers are found on the list. Some cities, such as Ho-Chi-Minh City (Vietnam) or Albuquerque (New Mexico, USA) are, however, missed. One of the possible explanations for this is the unknown contribution of irrigation. This may be overestimated in urban areas, which suffer from land surface sealing as a result of building. The rates as calculated by the model are on the lower end of reported depletion rates. This
may be the consequence of the scale that we use: depletion rates are averaged over a 10×10 km gridcel. Groundwater extraction and depletion, specifically for industrial sites, may however be much more local than that. Another interesting outcome is the prominent position of the city of San Jose (USA) with 3.27 m yr−1 depletion calculated for the 2000– 2010 period (Table 1). In reality, depletion in the San Jose area has essentially stopped after dramatic subsidence forced the local government to reduce groundwater abstraction (In-gebritsen and Jones, 1999). Surface water is now being im-ported from elsewhere and the imim-ported water is partly used for recharging the aquifer systems. The model however, still calculates the consumption of ground water in San Jose, as in the model local surface water availability is insufficient.
4 Towards a global land subsidence map
The PCR-GLOBWB outcomes will be used to force a two-layer global Modflow model, consisting of an upper unit with low permeability and a deeper confined aquifer sys-tem. The groundwater model will yield hydraulic heads. A decrease in hydraulic head will not automatically imply that subsidence will occur. If the deposits consist of sand, or are (over)consolidated, the hydraulic pressure decrease and ef-fective stress increase will not lead to inelastic volume reduc-tion. There is enough global information on the surface geol-ogy (e.g. Dürr, et al., 2005) to be able to focus only on those areas that are susceptible to subside. The required subsurface information to parameterize the geotechnical model is how-ever unavailable on a global scale at this time, but will be approached by using different scenarios of subsurface build-up.
Figure 3.Screen shot of revised depletion (m yr−1) results as calculated by the global hydrology model for the island of Java, Indonesia. It shows the depletion of the groundwater as a result of ground water abstraction in the urban area of Jakarta. The calculated depletion in the irrigation areas is now minor.
Figure 4.Screen shot of depletion (m yr−1) results as calculated by the global hydrology model for the east coast of China and Taiwan. The cities of Hong Kong, Shanghai, Qingdao and Beijing can be recognised. The large area in the north is the North China Plain, which is an agricultural area.
will be done within the concept of a dynamic DEM (digital elevation model). Within this concept, the currently available height information (DEM) for a certain area is updated with the cumulative subsidence (or uplift) over a certain period of
time. The predicted global land subsidence effects will be in-cluded in flood hazard and storm surge assessments within a global flood risk model.
Acknowledgements. The authors thank their colleagues Marijn Kuijper (Deltares Research Institute), Hessel Winsemius (Deltares Research Institute), Inge de Graaf (Utrecht University) and Marc Bierkens (Utrecht University, Deltares Research Institute) for data, support and discussion. This paper is a part of the World Resources Institute project Flood Risk and Intervention Assessment for Global Cities funded by the Netherlands Ministry of Infrastructure and En-vironment and the Netherlands Ministry of Foreign Affairs.
References
Abidin, H. Z., Andreas, H., Djaja, R., Darmawan, D., and Gamal, M.: Land subsidence characteristics of Jakarta between 1997 and 2005, as estimated using GPS surveys, GPS Solut., 12, 23–32, 2008.
Bakr, M.: Influence of Groundwater Management on Land Subsi-dence in Deltas A Case Study of Jakarta (Indonesia), Water Re-sour. Manag., 29, 1541–1555, doi:10.1007/s11269-014-0893-7, 2015.
Church, J. A., Clark, P. U., Cazenave, A., Gregory, J. M., Jevrejeva, S., Levermann, A., Merrifield, M. A., Milne, G. A., Nerem, R. S., Nunn, P. D., Payne, A. J., Pfeffer, W. T., Stammer, D., and Un-nikrishnan, A. S.: Sea Level Change, in: Climate Change 2013: The Physical Science Basis. Contribution of Working Group I to the Fifth Assessment Report of the Intergovernmental Panel on Climate Change, edited by: Stocker, T. F., Qin, D., Plattner, G.-K., Tignor, M., Allen, S. G.-K., Boschung, J., Nauels, A., Xia, Y., Bex, V., and Midgley, P. M., Cambridge University Press, Cam-bridge, United Kingdom and New York, NY, USA, 2013. De Graaf, I. E. M., van Beek, L. P. H., Wada, Y., and Bierkens, M.
F. P.: Dynamic attribution of global water demand to surface wa-ter and groundwawa-ter resources: Effects of abstractions and return flows on river discharges, Adv. Water Resour., 64, 21–33, 2014. Dürr, H. H., Meybeck, M., and Dürr, S. H.: Lithologic
Erban, L. E., Gorelick, S. M., and Zebker, H. A.: Groundwater ex-traction, land subsidence, and sea-level rise in the Mekong Delta, Vietnam, Environ. Res. Lett., 9, 084010, doi:10.1088/1748-9326/9/8/084010, 2014.
Galloway, D. L. and Burbey, T. J.: Review: Regional land subsi-dence accompanying groundwater extraction, Hydrogeol. J., 19, 1459–1486, 2011.
Ingebritsen, S. E. and Jones, D. R.: Santa Clara Valley, California – A case of arrested subsidence, in: Land Subsidence in the United States by Galloway, D., Jones, D. R., and Ingebritsen, S. E., U.S. Geological Survey Circular 1182, 177 pp., 15–22, 1999. Leake, S. A. and Galloway, D. L.: MODFLOW ground-water model
– User guide to the Subsidence and Aquifer-System Compaction Package (SUB-WT) for water-table aquifers, U.S. Geological Survey, Techniques and Methods, 6-A23, 42 pp., 2007. McDonald, M. G. and Harbaugh, A. W.: A modular
three-dimensional finite-difference ground-water flow model: Tech-niques of Water-Resources Investigations of the United States Geological Survey, Book 6, Chapter A1, 586 pp., 1988. McDonald, R. I., Weber, K., Padowski, J., Flörke, M., Schneider,
C., Green, P. A., Gleeson, T., Eckman, S., Lehner, B., Balk, D., Boucher, T., Grill, G., and Montgomery, M.: Water on an urban planet: Urbanization and the reach of urban water infrastructure, Global Environ. Chang., 27, 96–105, 2014.
Siebert, S., Burke, J., Faures, J. M., Frenken, K., Hoogeveen, J., Döll, P., and Portmann, F. T.: Groundwater use for irrigation – a global inventory, Hydrol. Earth Syst. Sci., 14, 1863–1880, doi:10.5194/hess-14-1863-2010, 2010.
Sutanudjaja, E. H., van Beek, L. P. H., de Jong, S. M., van Geer, F. C., and Bierkens, M. F. P.: Large-scale groundwater model-ing usmodel-ing global datasets: a test case for the Rhine-Meuse basin, Hydrol. Earth Syst. Sci., 15, 2913–2935, doi:10.5194/hess-15-2913-2011, 2011.
Sutanudjaja, E. H., van Beek, L. P. H., de Jong, S. M., van Geer, F. C., and Bierkens, M. F. P.: Calibrating a large-extent high-resolution coupled groundwater-land surface model using soil moisture and discharge data, Water Resour. Res., 50, 687–705, 2014.
Sutanudjaja, E. H., van Beek, L. P. H., Bosmans, J. H. C., Drost, N., de Graaf, I. E. M., de Jong, K., Peßenteiner, S., Straatsma, M. W., Wada, Y., Wanders, N., Wisser, D., and Bierkens, M. F. P.: PCR-GLOBWB 2.0: a 5 arc-minute global hydrological and water resources model, Geosci. Model Dev. Discuss., in prepara-tion, 2015.
Van Beek, L. P. H.: Forcing PCR-GLOBWB with CRU data, [online] available at: http://vanbeek.geo.uu.nl/suppinfo/ vanbeek2008.pdf (last access: 2 June 2015), 2008.
Van Beek, L. P. H. and Bierkens, M. F. P.: The Global Hydrologi-cal Model PCR-GLOBWB: Conceptualization, Parameterization and Verification, [online] available at: http://vanbeek.geo.uu.nl/ suppinfo/vanbeekbierkens2009.pdf (last access: 2 June 2015), 2009.
Van Beek, L. P. H., Wada, Y., and Bierkens, M. F. P.: Global monthly water stress: 1. Water balance and water availability, Water Re-sour. Res., 47, W07517, doi:10.1029/2010WR009791, 2011. Wada, Y., Wisser, D., and Bierkens, M. F. P.: Global modeling