https://dx.doi.org/10.24001/ijels.2.5.20 ISSN: 2456-7620
Consequences of Borrowing Money from Lending
Institutions in Relation to Job Performance
Michelle M. Zaragoza
1, Rose A. Arceño
21Altavista Elementary School, Matalom, Leyte
2Palompon Institute of Technology, Palompon, Leyte, Philippines
Abstract— There are identified positive consequences in borrowing money. The teachers were able to support their education as well as their family members’ needs. They maintained their total well-being without being affected by financial problems. Borrowing money solves the day-to-day problems of teachers. As manifested by the teachers, their lifestyle improved in such a way that they surpassed the daily difficulties, not minding the negative consequences like decreased net pay, generated more debt, experienced difficulty in coping with monthly loan payments, and financial instability. Furthermore, it was found out that there is a significant relationship between teacher’s profile and the reasons of borrowing money, a significant relationship between the profile of teachers and the consequences of borrowing money; and a significant relationship between the consequences of borrowing money from lending institutions to the public elementary school teachers’ job performance. The main contribution of the study is to improve the financial literacy by integrating the proposed guidelines in financial decisions. Among these items are set up a budget, getting the budget back on track, get everyone in the family involved, cutting household bills and mortgage, be flexible, paying off loans and credit cards, and set a savings goal.
Keywords— Consequences of Borrowing Money, DepEd Teachers, Job Performance, Lending Institutions, Philippines.
I. INTRODUCTION
The Commission on Higher Education (CHED) is encouraging incoming freshmen college students to enroll in the priority courses which they have identified. One of these “priority courses” is Teacher Education (Bacani, 2014). Though this is one of the degree programs considered to be too much occupied already, CHED executive Julito Vitrolio said in an interview last May 26, 2014, that this is one of the courses that the country needs to spur economic development (Bacani, 2014).
As it is a fact that the country needs many educators, issues regarding their salary have been a major concern these days.
Despite the fact that they are looked upon and heralded as molders of the youth, it seems that they are still overworked but underpaid (Arcangel, 2014).
It has been stated in the quarterly report of the Philippine National Statistical Coordination Board that the Consumer Spending of the Philippines has reached an all-time high of Php 1,278,169 for the first quarter of 2015 (PNSCB, 2015) depicting the consumption pattern of Filipinos these days. And among those Filipino citizens include numerous public elementary school teachers who are struggling to make ends meet with the little amount of salary they receive monthly. Being placed in such a situation, public school teachers fall as easy prey to loan sharks who charge as high as 10 percent (Inigo, 2014) or to lending institutions.
Public school teachers are nevertheless also borrowers of money. This is the only way they consider to survive their day-to-day living. It is a way to support their families, to support financial needs of micro-entrepreneurs and to ease life. Micro-entrepreneurs including teachers, public elementary school teachers specifically, are the most patronizing party in money borrowings because they are the ones who are in need of financial capital due to inadequate remunerations from the government.
As stated in House Bill 2142, House of Representatives, Fifteenth Congress, First Regular Session: Public school teachers’ salaries are currently unable to “ensure a reasonable standard of life for themselves and their families.” According to the Alliance of Concerned Teachers, the living wage in the National Capital Region, estimated at P957 per day or more than P28,710 per month, is in sharp contrast with the P18,000 monthly salary of a Teacher I. In order to cope with this “living salary gap,” teachers resort to borrowing and are heavily indebted to government financial institutions such as the Government Service Insurance System (GSIS), private lending institutions, or loan sharks.
https://dx.doi.org/10.24001/ijels.2.5.20 ISSN: 2456-7620
family. Everybody borrows material things and money to the most.
Lending media emerged as either persons or institutions. Lending institutions are legal agents of money borrowings that require minimal interests of the money afforded upon its return or payments. On 22 May 2007, Republic Act No. 9474, also known as the “Lending Company Regulation Act of 2007,” was approved. The law is consistent with the declared policy of the State to regulate the establishment of lending companies and to place their operation in a sound, efficient and stable condition to derive the optimum advantages from them as an additional source of credit; to prevent and mitigate, as far as practicable, practices prejudicial to public interest; and to lay down the minimum requirements and standards under which they may be established and do business.
The so-called “5-6” (five-six) is a kind of lending entity in the neighborhood. The 5-6 is illegal as it demands usurious interest not required by law. These lenders do not require potential borrowers to come up with a collateral or a heap of documentary requirements Five-six lenders often throw the concept of credit limit out of the window, meaning, you can borrow as much as you can. There are no formal agreements in this type of loan, which makes the process a lot quicker than bank loans. This loan sharks only exist to take advantage of cash-strapped people who are in desperate need of financial aid. Unlike banks and other legitimate financial institutions, these loan sharks do not adhere to the rules since they are not accredited financial institutions (eCompareMo, October 8, 2014).
In relation to this subject matter, this research has been formulated so as to know the consequences of borrowing money from lending institutions in relation to job performance.
The researchers believed that this study would serve as a lesson to teachers. This would make them aware of their financial illiteracy and eventually would lead to a better financial management. The future researchers working on similar or allied studies of this nature can refer to this study especially on the theory and results of the evaluation. This study would give them an idea on how to handle financial matters responsibly. They could have ready information and data which they could use as a springboard for their research. The researcher felt that this study was timely and relevant to conduct since the teachers are obviously involved in money lending-related issues.
1.1 Theoretical/Conceptual Framework of the Study The theories adopted in this study were the Theory of Human Motivation and the Theory of Planned Behavior.
The Theory of Human Motivation by Abraham Maslow is a motivational theory in psychology comprising a five-tier model of human needs, often depicted as hierarchical levels within a pyramid. Maslow wanted to understand what motivates people. He believed that people possess a set of motivation systems unrelated to rewards or unconscious desires.
Maslow (1943) stated that people are motivated to achieve certain needs and that some needs take precedence over others. Our most basic need is for physical survival, and this will be the first thing that motivates our behavior. Once that level is fulfilled the next level up is what motivates us, and so on.
This five-stage model can be divided into deficiency needs and growth needs. The first four levels are often referred to as deficiency needs (D-needs) and the top level is known as growth or being needs (B-needs). The deficiency needs are said to motivate people when they are unmet. Also, the need to fulfill such needs will become stronger the longer the duration they are denied. For example, the longer a person goes without food the more hungry they will become. One must satisfy lower level deficit needs before progressing on to meet higher level growth needs. When a deficit need has been satisfied, it will go away. Our activities become habitually directed towards meeting the next set of needs that we have yet to satisfy. These then become our salient needs. However, growth needs continue to be felt and may even become stronger once they have been engaged. Once these growth needs have been reasonably satisfied, one may be able to reach the highest level called self-actualization. Every person is capable and has the desire to move up the hierarchy toward a level of self-actualization. Unfortunately, progress is often disrupted by a failure to meet lower level needs. Life experiences, including divorce and loss of a job, may cause an individual to fluctuate between levels of the hierarchy. Therefore, not everyone will move through the hierarchy in a uni-directional manner but may move back and forth between the different types of needs.
https://dx.doi.org/10.24001/ijels.2.5.20 ISSN: 2456-7620
his/her life experiences and the opinions of his/her culture. This need theory is often taught in classes concerning management or organizational behavior. The second theory which is the theory of planned behavior emphasizes that human behaviors are governed not only by personal attitudes but also by social pressures and a sense of control. The theory of planned behavior assumes that rational considerations govern the choices and behaviors of individuals (Ajzen, 1985; Ajzen, 1991; Ajzen & Fishbein, 2005).
These intentions partly, but not entirely, reflect the personal attitudes of individuals, which is the extent to which they perceive this act as desirable or favorable.
In addition, the degree to which significant individuals, such as relatives, friends, or colleagues, condone this act, called subjective norms, also affects intentions (Ajzen, 1985, 1991; Ajzen & Fishbein, 2005). The perceived importance or relevance of these relatives, friends, or colleagues affects the extent to which their approval will shape intentions. Furthermore, these weightings might vary across contexts. For example, the beliefs of relatives are likely to shape the intentions to engage in behaviors that relate to family life. In contrast, the beliefs of managers might be more likely to shape intention, the intentions to engage in behaviors that relate to work life.
Finally, according to the theory of planned behavior, which represented a refinement to the theory of reasoned action, the extent to which individuals feel they can engage in these behaviors, called perceived behavioral control also impinges on their intentions and behaviors (Ajzen, 1991). The
perceived behavioral control comprises two main facets. First, perceived behavioral control depends on the degree to which individuals conceptualize themselves as sufficiently knowledgeable, skillful, disciplined, and able to perform some act, called internal control (Kraft, Rise, Sutton, & Roysamb, 2005), which overlaps with the concept of self- efficacy. Second, perceived behavioral control depends on the extent to which individuals feel that other factors, such as the cooperation of colleagues, resources, or time constraints, could inhibit or facilitate the behavior, called external control (Kraft, Rise, Sutton, & Roysamb, 2005).
Furthermore, intentions to perform some act do not always culminate in this behavior. Perceived behavioral control is partly, but not absolutely, related to actual behavioral control (Armitage & Conner, 2001), which in turn affects the extent to which intentions are associated with the corresponding behaviors. Perceived and actual behavioral control can sometimes diverge, such as when individuals are oblivious to factors that obstruct or facilitate the intended behavior. The above theory conforms to the borrowing behavior of the teachers. They need to control this act especially when the need for money is not urgent so that control will be applied for them to become financially literate.
In connection with the aforementioned theories, the schematic diagram is shown to conceptualize the explanation.
https://dx.doi.org/10.24001/ijels.2.5.20 ISSN: 2456-7620
1.2 Statement of the Problem
The main purpose of this study was to determine the consequences of borrowing money from lending institutions in relation to the job performance of teachers.
Specifically, it sought answers to the following questions: 1. What is the demographic profile of the respondents on the following:
1.1 position, 1.2 age, 1.3 sex, 1.4 civil status,
1.5 number of family members working, 1.6 residential type,
1.7 monthly income, 1.8 length of service, 1.9 number of current loans, 1.10 frequency of borrowing, and 1.11 performance rating?
2. What are the common reasons and consequences of borrowing money from lending institutions?
3. Is there a significant relationship between the profile and common reasons of respondents in borrowing money?
4. Is there a significant relationship between the profile and the consequences of borrowing money?
5. Is there a significant relationship between the consequences of borrowing money from lending institutions to the public elementary school teachers’ job performance?
6. What guidelines can be proposed to improve the teachers’ financial management?
1.3 Null Hypotheses
Ho1: There is no significant relationship between the profile and common reasons of respondents in borrowing money. Ho2: There is no significant relationship between the profile and the consequences of borrowing money.
Ho3: There is no significant relationship between the consequences of borrowing money from lending institutions to the public elementary school teachers’ job performance.
II. METHODOLOGY
The descriptive method was used to determine the consequences of borrowing money from lending institutions in relation to their academic performance as teachers. The instruments used to obtain the data include questionnaires, interviews, and observation.
The study was conducted in Matalom North District, Division of Leyte. Matalom North is one of the two districts
of Matalom, Leyte founded way back 1925. It is composed of 12 public elementary schools. It has 30 barangays (the local term for the villages) of the town.
The sampling is universal. The 101 respondents were given the questionnaires which were in a checklist format for them to choose the answers by checking their responses on the given choices.
The questionnaire consisted of four parts. Every question was answerable by putting a check mark in the box provided in the listed choices after every item.
Range of Weighted Mean Values
Qualitative Description
1 – 1.80 NA - Not Applicable
1.81 – 2.60 SD - Strongly Disagree
2.61 – 3.40 SD - Strongly Disagree
3.41 – 4.20 A - Agree
4.21 – 5.00 SA - Strongly Agree
The researcher used the Likert’s rating scale to measure the degree of their agreement or disagreement on the given aspects.
The researcher gathered the data through the use of the questionnaires to the identified respondents. The interview instrument was used to confirm the respondent’s answer from the questionnaire. Both research instruments were treated with strict confidentiality to safeguard the background information of the respondents by using codes. After the data were obtained from the respondents, they were tallied, computed and tabulated. The researcher used frequency and percentage for problem 1. For problem 2; rank based on the weighted mean values were used.
Moreover, Pearson R was utilized for problems 3, 4, and 5.
III. RESULTS AND DISCUSSION 3.1 Demographic Profile of Teachers
The first research question looks into the demographic profile of teachers in terms of position, age, sex, civil status, number of family members, residential type, monthly income, length of service, number of current loans in lending institutions, frequency of borrowing money from lending institutions and performance rating.
https://dx.doi.org/10.24001/ijels.2.5.20 ISSN: 2456-7620
Table.1: Position of the Respondents
Position Frequency Percent
Teacher 1 21 20.8
Teacher 2 13 12.9
Teacher 3 57 56.4
Head Teacher 1 1.0
Master Teacher 1 7 6.9
Master Teacher 2 1 1.0
Principal 1 1 1.0
Total 101 100.0
It is shown that 57 out of 101 teachers were Teacher 3 which is 56.4 % of the total population. Teacher 1 position ranks next with 20.8% and Teacher 2 was only 12.9%. Master Teacher 1 was 6.9 % while Master Teacher 2 was only 1%. Head Teacher position was only 1% and Principal position was also 1%.
Age. Table 2 shows the data on the age profile of the teacher respondents. It illustrates that the majority of the teachers in the district belonged to the age of 46-55 years old. This further implies that most of the teachers in the district were in their middle ages and very experienced in their profession.
Table.2: Age of the Respondents
Age Frequency Percent
21 to 25 4 4.0
26 to 35 27 26.7
36 to 45 27 26.7
46 to 55 31 30.7
56 to 65 12 11.9
Total 101 100.0
Sex. Table 3 presents the sex of the teacher respondents. Results revealed that majority of the teachers in the district were female. They comprised the big population in the district.
Table.3: Sex of the Respondents
Sex Frequency Percent
Male 13 12.9 Female 88 87.1
Total 101 100.0
Civil Status. Table 4 shows the civil status of the respondents.
Table.4: Civil Status of the Respondents
Civil Status Frequency Percent
Single 12 11.9 Married 87 86.1 Widow/Widower 2 2.0
Total 101 100.0
As gleaned from Table 4, most of the teachers were already married. It further suggests that since these teachers were already married, they already had bigger financial needs. These might include basic needs such as food, clothing, education for children, health, medicine and acquiring real properties. Thus, they required higher financial allocation.
https://dx.doi.org/10.24001/ijels.2.5.20 ISSN: 2456-7620
Table.5: Number of Family Members Working and Non-working
Family Member Total
No. of Family Members Working 185
No. of Family Members Non-working 264
Total 449
Residential Type. Table 6 presents the residential type of the respondents. Based on the Table, the majority of the teachers were occupying their own house. Constructing one’s own property like a house needs more resources.
Table.6: Residential Type of Respondents
Residential Type Frequency Percent
Owned 83 82.2 Rented 5 5.0 Others 13 12.9
Total 101 100.0
Monthly Income. Table 7 presents the monthly income of the respondents. As gleaned from the Table, it shows that the average monthly income of the respondents was 20,001 to 30,000 pesos. They said that the amount was just sufficient if budgeted wisely for a small family, however, it was not enough to cater the needs of a big family.
Table.7: Monthly Income of Respondents
Monthly Income Frequency Percent
20,000 & below 15 14.9 20,001 to 30,000 51 50.5 30,001 to 40,000 16 15.8 40,001 & above 19 18.8
Total 101 100.0
Length of Service. Table 8 shows the length of service of the teacher- respondents. This illustrates that a large number of teachers in the district had 21 years and above in their teaching experience. This explains that these teachers were already well-experienced in the field.
Table.8: Length of Service of the Respondents
Length of Service Frequency Percent
5 years & below 18 17.8 6 to 10 15 14.9 11 to 15 20 19.8 16 to 20 13 12.9 21 years & above 35 34.7
Total 101 100.0
https://dx.doi.org/10.24001/ijels.2.5.20 ISSN: 2456-7620
Table.9: Number of Current Loans in Lending Institutions
Number of Current Loans in LI Frequency Percent
No Loan 5 5.0
One 28 27.7
Two 33 32.7
Three 19 18.8
Four or more 16 15.8
Total 101 100.0
The Table purports that the average number of loans of teachers in lending institutions was two. This premise is indeed true because lending institutions usually offer teachers with a higher amount of salary loans with unlimited accounts or amounts.
Frequency of Borrowing Money from Lending Institutions. Table 10 showcases how often teachers borrowed money from lending institutions. The result shows that majority of the teachers borrowed money once a year. This further conveys that teachers borrowed money for varied personal purposes.
Table.10: Frequency of Borrowing Money of Teachers from Lending Institutions
Frequency of Borrowing Money from LI Frequency Percent
No Loan 4 4.0
Once a year 55 54.5
Twice a year 26 25.7
Thrice or more per year 16 15.8
Total 101 100.0
Performance rating. Table 11 shows the performance rating of the teacher-respondents. Based on the Performance Appraisal System for Teachers (PAST), the average performance rating of the Matalom North District Teachers was 8.28. This further testifies that majority of the teachers in the district gained a very satisfactory rating at the end of the school year.
Table.11: Performance Rating of the Respondents
Performance Rating Frequency Percent
Very Satisfactory 96 95.0
Satisfactory 5 5.0
Total 101 100.0
3.2 Reasons and Consequences of Borrowing Money from Lending Institutions
This part presents the reasons and consequences of borrowing money from lending institutions.
Reasons for Borrowing Money from Lending Institutions. Table 12 displays the teachers’ reasons for borrowing money from lending institutions with 17 listed reasons. The overall mean was 3.27 which means the teachers “disagree” in the cases cited.
Table.12: Reasons for Borrowing Money from Lending Institutions
Reasons for borrowing money from Mean Rank Interpretation Lending institutions
1. Health 4.28 1 strongly agree
2. Education 4.24 2 strongly agree
3. Basic needs 3.79 4 agree
https://dx.doi.org/10.24001/ijels.2.5.20 ISSN: 2456-7620
6. Basic needs for others 3.02 10 disagree 7. Leisure/recreation 2.72 15 disagree
8. Travel 2.73 14 disagree
9. Fiesta celebration 2.94 11 disagree
10. Wedding 2.89 12 disagree
11. Baptism 2.68 16 disagree
12. Lifestyle: gadgets 2.89 12 disagree 13. Lifestyle: appliances 3.14 8 disagree 14. Lifestyle: vehicles 3.66 6 agree
15. Financial illiteracy 2.12 17 strongly disagree 16. Capital for business 3.13 9 disagree
17. Payment for debts 3.69 5 agree
Overall Mean 3.27 disagree
It is clearly shown in Table 12 that health was the number one reason for borrowing money with a weighted mean of 4.28. They strongly agreed with this reason. This was followed by education with a weighted mean of 4.24. The “agree” interpretation was the basic needs for food, shelter, vehicles, and payment for debts with weighted mean values ranging from 3.64 to 4.07. Other reasons were not favored by the respondents which mean that they were not so important.
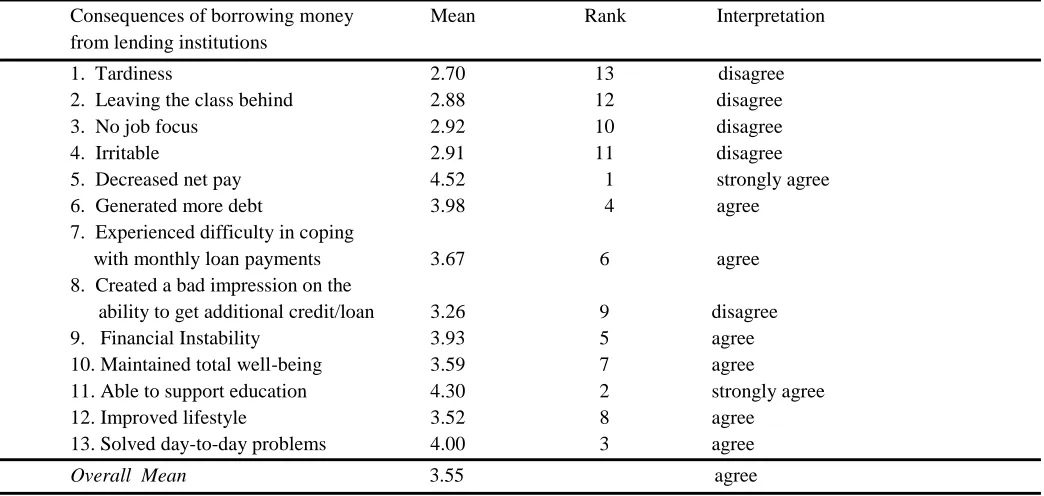
Consequences of Borrowing Money from Lending institutions. Table 13 shows the consequences of borrowing money from lending institutions. The overall mean was 3.55 which meant that the teachers “agreed” with the given statements.
Table.13: Consequences of Borrowing Money from Lending Institutions
Consequences of borrowing money Mean Rank Interpretation from lending institutions
1. Tardiness 2.70 13 disagree
2. Leaving the class behind 2.88 12 disagree
3. No job focus 2.92 10 disagree
4. Irritable 2.91 11 disagree
5. Decreased net pay 4.52 1 strongly agree
6. Generated more debt 3.98 4 agree
7. Experienced difficulty in coping
with monthly loan payments 3.67 6 agree 8. Created a bad impression on the
ability to get additional credit/loan 3.26 9 disagree
9. Financial Instability 3.93 5 agree
10. Maintained total well-being 3.59 7 agree
11. Able to support education 4.30 2 strongly agree
12. Improved lifestyle 3.52 8 agree
13. Solved day-to-day problems 4.00 3 agree
Overall Mean 3.55 agree
According to the results, the two highest consequences were decreased net pay (4.52) and able to support education (4.30) which were strongly agreed by the respondents. This means that their loans benefited positively since the family members finished education.
https://dx.doi.org/10.24001/ijels.2.5.20 ISSN: 2456-7620
No job focus (2.92), irritable (2.91), leaving the class behind (2.88) and tardiness (2.70) were also opposed by the teachers. They can transact during Saturdays to these lending establishments to borrow money. Also, lending institutions now have great offers like visiting the teachers at school and bringing them the money they need.
3.3 Relationship Between the Profile and Common Reasons of Respondents in Borrowing Money
The third research question looks into the relationship between the profile and common reasons for borrowing money. Table.14: Correlation Results on the Profile and Common Reasons of Respondents in Borrowing Money
Profile of Teachers Reasons of
Borrowing
Money Position Age Sex
Civil
Status
No. of family
Members Working
Residential
Type
Monthly
Income
Length of Service
No. of
Current
Loans In LI
Frequency of borrowing
1. Health .119 -.016 -.083 .057 -.104 .101 .002 .062 .167 .231
2. Education .193 .177 -.146 .066 .022 -.034 .164 .213 .061 .324
3. Basic needs -.120 -.197 -.052 -.116 -.227 -.069 -.170 -.145 .097 .360
4. Basic needs
for food -.095 -.201 .011 -.074 -.204 .028 -.110 -.108 .135 .341
5. Basic needs
for shelter -.079 -.103 -.067 -.069 -.264 -.128 -.098 -.094 .152 .163
6. Other Basic
needs .079 .014 .036 .086 -.195 .049 -.038 .092 .228 .360
7. Leisure/
recreation .055 .036 -.053 -.086 -.141 -.130 -.025 -.008 .065 .083
8. Travel .075 -.007 -.145 -.142 -.171 -.110 -.041 .011 .091 .155
9. Fiesta
celebration .081 .089 -.181 -.047 -.228 -.108 .015 .034 .100 .186
10. Wedding .003 -.078 -.212 .078 -.164 -.011 .033 -.054 .131 .094
11. Baptism -.004 -.046 -.004 .084 -.131 -.001 .015 -.027 .189 .200
12. Lifestyle:
gadgets .022 -.008 -.111 -.033 -.175 -.110 -.054 .025 .167 .080
13. Lifestyle:
appliances .062 -.069 -.208 -.070 -.206 -.020 -.045 -.035 .104 .018
14. Lifestyle:
vehicle .030 -.069 -.227 -.060 -.223 -.011 .039 -.079 .227 .160
15. Financial
illiteracy -.037 -.004 .049 .095 -.058 -.055 -.142 .016 -.147 -.045
16. Capital for business
.128 -.022 .019 .085 -.129 -.080 .136 .073 .166 .174
17. Payments
for debts -.045 -.162 -.031 .085 -.262 .026 .011 -.070 .331 .396
It can be gleaned from Table 14 that health was one of the dominant causes why teachers borrowed money from lending institutions. This resulted to a significant correlation with a value of 0.231. This value was higher than the critical value of 0.196, thus, the relationship was significant at 0.05 level.
Age and number of family members working were significantly related with basic needs with correlation values of -0.197 and -.227, respectively.
When considering the reasons for basic needs the correlation value of 0.360 shows a highly significant result especially when 0.01 level was referred.
Furthermore, age, number of family members working were significantly related to basic needs for food with correlation values of -0.201 and -0.204, respectively.
Moreover, when the question on how often teachers borrowed money from lending institutions were paired to basic needs for food, it shows a significant relationship with reference to 0.341 p-value.
https://dx.doi.org/10.24001/ijels.2.5.20 ISSN: 2456-7620
The number of family members working was significantly related to basic needs for shelter with a correlation value of -0.264.
Other basic needs were significantly related with a number of a current loan in the lending institution with 0.228 correlation value and were highly related with the item on how often teachers borrowed money from the lending institutions with 0.360 correlation value.
Fiesta celebration was significantly related with the number of family members working with a correlation value of -0.228. The result showed that married individuals were prone to celebrating fiesta, maybe to improve camaraderie and foster their religious beliefs.
Wedding was significantly correlated with sex with a correlation value of -0.212. This is pretty obvious that men and women treasure wedding importantly.
Baptism was significantly related to the frequency of borrowing money from lending institutions with a correlation value of 0.200.
The acquisition of appliance was related to sex and number of family members working with correlation values of -0.208 and -0.206, respectively.
The purchase of vehicle was significantly related to sex, number of family members working, and number of current loans in lending institutions with correlation values of -0.227, -0.223, and 0.227 respectively.
Payment for debt was significantly related to the number of family members working, number of current loans in lending institutions, and how often teachers borrowed money from lending institutions with correlation values of
-0.262, 0.331, and 0.396, respectively. The result is palpable enough showing generally that teachers borrow money to compensate their monetary obligations.
Leisure/recreation, gadgets, financial illiteracy, and capital for business were not significantly related to the profile of teachers with correlation values of less than ±0.196. The overall results revealed the decision to reject the null hypothesis that the teachers’ profile and the reasons of borrowing money from lending institutions had no significant relationship.
3.4 Relationship between the Profile and the Consequences of Borrowing Money
The fourth research question looks into the relationship between the profile and the consequences of borrowing money.
Table 15 portrays that tardiness and monthly income were significantly related with a value of 0.224. This value is higher than the critical value of 0.196, thus, the relationship is significant at 0.05 level. This implies that monthly income greatly affects tardiness of the teachers.
Table.15: Correlation Results Between the Profile and the Consequences of Borrowing Money
Legend: Significant Relationship ± .196 critical value .05 (two-tail); High Significant Relationship ± .255 critical value .01 (two-tail)
Consequences of Borrowing Money From Lending Institutions
Profile of Teachers
Position Age Sex Civil Status
No. of Family Members Working
Resi-dential Type
Monthly Income
Length of Service
No. of Current Loans in LI
Frequency
of
borrowing
1.Tardiness .115 -.079 .068 -.067 .091 .037 .224 .060 .127 .167
2. Leaving the class behind .146 .067 -.052 -.038 .135 -.009 .151 .187 .126 .232
3. No job focus -.111 -.164 -.111 -.027 -.031 .043 .091 -.102 .066 .081
4. Irritable -.147 -.140 -.191 -.169 -.074 -.050 .019 -.100 .122 .183
5. Decreased net pay -.023 .023 -.155 .193 -.213 -.034 .060 .002 .204 .074
6. Generated more debt .064 .037 -.009 .126 -.056 .034 .197 .076 .129 .090
7. Experienced difficulty in coping with monthly loan payments
.012 -.027 -.079 .089 -.007 -.030 .156 .050 .220 .286
8. Created a bad impression on the ability to get additional credit/loan
-.041 -.078 .095 -.016 -.068 .117
-.001 .016 .140 .307
9. Financial instability -.003 -.095 -.036 .162 -.119 .054 .052 -.025 .189 .197
10. Maintained total well-
being .187 .136 -.051 .072 .030 -.028 .220 .105 .027 .098
11. Able to support education .048 .179 -.006 .164 .017 -.089 .193 .162 .041 .258
12. Improved lifestyle -.007 .052 -.044 .044 .040 -.100 .112 -.023 -.164 -.177
https://dx.doi.org/10.24001/ijels.2.5.20 ISSN: 2456-7620
Leaving the class behind and frequency of borrowing money from lending institutions were significantly related with a correlation value of 0.232.
Decreased net pay was significantly related to the number of family members working, and a number of the current loan in lending institutions with correlation values of -0.213, and 0.204, respectively. This is apparently true since the more loan the teacher will have the lower the net pay will be. The reason that it generated more debt was substantially linked to monthly income with a 0.197 correlation value. This is because the lower the income of the family, the more chances of getting into financial agreements.
The respondent teachers said that they experienced difficulty in coping with monthly loan payments which was expressly associated with the number of current loans in lending institutions with a correlation value of 0.220 and was high compared with the frequency of borrowing money from lending institutions with a correlation value of 0.286. This value is much higher than the critical value of 0.255, thus, the relationship is highly significant at 0.01 level.
Furthermore, the item on created a bad impression on the ability to get additional credit/loan was significantly high compared to the number of family members with a correlation value of 0.206 and was highly linked to the frequency of borrowing money from lending institutions with 0.307 correlation value, which was substantially high compared to the critical value of 0.255, thus, the relationship is highly significant at 0.01 level.
Financial instability and the frequency of borrowing money from lending institutions were significantly related with a correlation value of 0.197. Likewise, the item on able to maintain total well-being and monthly income had also a significant relationship with 0.220 correlation value. Education and the frequency of borrowing from lending institutions were considerably related with 0.258 correlation value. The outcome indicates that the more frequent the teacher applies for a loan, the greater the possibility of completing an education.
Solved day-to-day problems and residential type was significantly related with a correlation value of -0.219. No job focus, irritable, and improved lifestyle were not significantly related to the profile of teachers with computed correlation values of less than ±0.196.
The results mean that the null hypothesis is rejected. This is due to the situation that significant relationship existed between the profile of teachers and the consequences of borrowing money.
3.5 Relationship between the Consequences of Borrowing Money from Lending Institutions to the Public
Elementary School Teachers’ Job Performance
The fifth research question looked into the relationship between the consequences of borrowing money from lending institutions to the public elementary school teachers’ job performance.
The data were shown in Table 16.
Table.16: Correlation Results Between the Consequences of Borrowing Money and Teachers’ Job Performance r – values Between Consequences of Borrowing Money and Teachers’ Job Performance (N = 101)
1. Tardiness .127
2. Leaving the class behind .229
3. No job focus .122
4. Irritable .083
5. Decreased net pay .230
6. Generated more debt .228
7. Experienced difficulty in coping with monthly loan payments .126
8. Created a bad impression on the ability to get additional credit/loan .049
9. Financial Instability .149
10. Maintained total well-being .207
11. Able to support education .217
12. Improved lifestyle .066
13. Solved day-to-day problems .148
Legend:
Significant Relationship ± .196 critical value .05 (two-tail) High Significant Relationship ± ..255 critical value .01 (two-tail)
In Table 16, the performance rating is significantly related with leaving the class behind, decreased net pay, generated
https://dx.doi.org/10.24001/ijels.2.5.20 ISSN: 2456-7620
0.207, and 0.217, respectively. These values are higher than the critical value of 0.196, thus, the relationship is significant at 0.05 level.
Performance rating in relation to tardiness was not significantly related because as perceived by the teachers, they did not utilize class hours for a loan application. They used their Saturdays for this matter.
This implies that the consequences of borrowing money from lending institutions affect the teachers’ job performance on five highlighted items in the table.
In summary, borrowing money from lending institutions somehow disturbed the teacher-respondents, thus, the guidelines to improve the financial management is proposed.
3.6 Proposed Guidelines to Improve the Teachers’ Financial Management
The last research question dealt with the guidelines necessary to improve the teachers’ financial management. The objective of which was to remind teachers on the necessities and importance of proper money spending. The researcher believes that these guidelines will help the teachers to become a wise consumer. Here are some suggestions:
1. Set up a budget.
The first step to taking control of your finances is doing a budget. It will take a little effort, but it is a great way to get a quick snapshot of the money coming in and going out.
2. Get your budget back on track.
If you are spending more than the income coming in, you need to work out where you can cut back.
3. Get everyone involved.
Get everyone in your family involved with keeping to a budget. Sit down together and make a plan that you can all stick to. Work out how much on spending money that is available and agrees between you and each one have.
4. Cut your household bills and your mortgage. For many of us, household bills make up a large chunk of our spending. Delayed gratification works also to maintain a budget.
5. Be flexible.
Life is unpredictable so try to review your budget and your spending.
6. Pay off loans and credit cards.
If you have loans or owe money on credit cards, it usually makes sense to pay off the debt that charges the highest rate of interest first.
It is important to make sure you do not break the terms of your agreements. So even if you are focusing on paying down another debt, you must pay at least the minimum on any
credit cards and your monthly required payments on any loan agreements.
7. Set a savings goal.
Some people find it hard to get motivated about saving, but it is often much easier if you set a goal.
IV. CONCLUSION AND RECOMMENDATIONS The existence of lending institutions helped solved the economic problems of teachers in some aspects. Although too much loan reduces financial freedom and stability, the respondents can make their budget back on tract by cost-cutting daily expenses and change their lifestyle.
It is recommended that:
1. The government should take into consideration the welfare of teachers. There should be an increase in salary for the teachers to be well-compensated. 2. Teachers should be encouraged to set priorities on
needs and wants.
3. Teachers should minimize loan applications and control expenditures as well.
4. Teachers should attend financial management training and seminars.
5. The proposed guidelines to improve the financial literacy should be taken into consideration.
6. Research studies with bigger scope related to this are recommended to validate the findings of this research.
REFERENCES
[1] Ajzen, I. (1985). From Intentions to Actions.: A Theory of Planned Behavior.
[2] Ajzen, I. (1991). The Theory of Planned Behavior: Organizational Behavior and Human Decisions Processes, 50, 170-211.
[3] Ajzen, I. (2002). Construction of a theory of planned
behavior questionnaire: Conceptual and
methodological considerations. Retrieved from http://people.umass.edu/aizen/pdf/tpb.measurement.pdf [4] Ajzen, I. (2008). The theory of planned behavior:
Frequently asked questions.
Retrieved May 5, 2012, from University of Massachusetts, Icek Ajzen Faculty Website: http://www.people.umass.edu/aizen/faq.html
[5] Arcangel, X. (2014). Bill seeks to increase public school teachers’ salary from P18k to P36k. Retrieved
July 13, 2015, from
https://dx.doi.org/10.24001/ijels.2.5.20 ISSN: 2456-7620
[6] Armitage, C. J., & Conner, M. (2001). Efficacy of the theory of planned behavior: a meta-analytic review. British Journal of Social Psychology, 40, 471-499. [7] Bacani, L. (2014). CHED lists in-demand, priority
college courses until 2018. Philstar.com. Retrieved July
13, 2015 from
http://www.philstar.com/campus/2014/05/26/1307196/ ched-lists-demand-priority-college-courses-until-2018 [8] DeMerceau, J. (2015). Advantages & Disadvantages of
Bank Loans. Houston
[9] Chronicles. Retrieved June 2015, from http://smallbusiness.chron.com/advantages-amp-disadvantages-bank-loans-47377.html
[10]eCompare Mo, Retrieved January 8, 2017, from https://www.ecomparemo.com/info
[11]Fishbein, M. (2005). The influence of attitudes on behavior. In D. Albarracín, B. T. Johnson, & M. P. Zanna (Eds.), The handbook of attitudes (pp. 173-221). [12]Kraft, Rise, Sutton, & Roysamb, ( 2005).
Meta-Analysis of the Reasoned Action Approach (RAA) to Understanding Health Behaviors Focusing on Comparing the Pairs of RAA
[13]Maslow, A. H. (1943). A Theory of Human Motivation. Psychological Review, 50(4), 370-96. Subcomponents and Differences Between Health Protection and
Health-risk Behaviors. Retrieved from
https://link.springer.com/article/10.1007/s12160-016-9798-4.