APPLICATION OF MACROSCOPIC MODELLING IN ASSESSING
NOISE LEVEL IN URBAN AREAS
Luka Novačko1, Marjana Petrović2, Danijela Barić3
1, 2, 3 University of Zagreb, Faculty of Transport and Traffic Sciences, Vukelićeva 4, 10000 – Zagreb, Croatia
Received 23 December 2013; accepted 25 February 2014
Abstract:Noise, as one of negative effects of increased motorisation in the world, is increasingly becoming an important parameter in determining the location and in the reconstruction of the traffic facilities. In the European Union the directives related to the permissible noise emission of motor vehicles have been adopted already in 1970s. Also, states have stipulated the permissible noise levels according to land allocation, and the protection measures are implemented more intensively. The paper describes the methodology of evaluating the noise level by implementing the macro-simulation software tool PTV Visum on the example of demonstration corridor of the European project Civitas ELAN in the city of Zagreb. The paper describes the basic objectives of this project and the implemented measures in the city of Zagreb. By implementing the software tools the noise level has been estimated by using German and Nordic guidelines whose calculation methodology is described in the paper. Keywords: noise level, Civitas ELAN, PTV Visum, Nord2000 method, RLS90 method.
1 Corresponding author: luka.novacko@fpz.hr
1. Introduction
The ambient noise represents a harmful and undesired sound which is usually generated by human activities, and the noise emitted by different transport means within the traffic flow is especially harmful. The spatial distribution of traffic noise in a city is related to the distributions of traffic volume, urban density and urban form (Salomons and Pont, 2012). The sources of noise in the cities are mostly caused by motor vehicles, as well as by vehicles of public urban transport. The loudness of traffic noise is increased by heavier traffic volume, higher speeds, greater numbers of heavy vehicles, defective muff lers or other faulty equipment on vehicles as well as any condition that causes
heavy laboring of motor vehicle engines (Shukla, 2011). The consequences of the stay in the area of impermissible noise level in the cities are reflected mostly in the reduced quality of living (night noise), reduced concentration, but also in serious health problems. A systematic review conducted by Laszlo et al. (2012) showed that the most commonly studied outcomes regarding noise exposure are annoyance and sleep disturbance followed by other reactions such as well-being, activity disturbance and use of living environment.
– type of vehicle, – speed,
– traffic flow, – grade level.
It has been estimated that at least 25% of the EU population experience a reduced quality of life due to environmental noise-induced annoyance and that between 5% and 15% of the population suffer serious noise-induced sleep disturbance. It is further estimated that in the EU environmental noise costs between EUR 13 and 38 billion per annum due to medical costs, lost workdays, reduction in house prices and reduced land use potential (Handbook, 2008).
The European Commission addressed noise in the environment as one of the main environmental problems in Europe (Directive 2002/49/EC,2002). Therefore, the European Commission brought already in 1970 Directive 70/157/EEC which introduces limits on sound levels of road vehicles, and specifies procedures for measuring sound levels of exhaust systems and silencers. The mentioned Directive changed several times since 1970, and Table 1 shows the change in the levels of permissible noise for single types of motor vehicles. It is possible to observe a falling trend in the permissible noise level during the last four decades.
According to last changes of the Directive 70/157/EEC the limit values range from
74 dB(A) (passenger vehicles) to 80 dB(A) (goods vehicles). The Directive applies to any motor vehicle intended for use on the road, having at least four wheels and a maximum design speed exceeding 25 km/h.
Table 1
Permissible Noise Levels for Single Vehicle Categories According to Directive 70/157/EEC and Amendments
Motor vehicle category 1970 Permissible noise level (dB)1984 1992
Vehicles intended for the carriage of passengers and comprising not more than 9 seats including the driver’s
seat 82 77 74
Vehicles intended for the carriage of passengers, comprising more than 9 seats including the driver’s seat, and having a permissible maximum weight not exceeding 3,5 tonnes
84
78 (not exceeding
2 tonnes) 79 (not exceeding 3,5
tonnes)
76 (not exceeding
2 tonnes) 77 (not exceeding 3,5
tonnes)
Vehicles intended for the carriage of goods and having a permissible maximum weight not exceeding 3,5 metric
tons 84
78 (not exceeding
2 tonnes) 79 (not exceeding 3,5
tonnes)
76 (not exceeding
2 tonnes) 77 (not exceeding 3,5
tonnes)
Vehicles intended for the carriage of passengers, comprising more than 9 seats including the driver’s seat, and having a permissible maximum weight exceeding 3,5 metric tons
89
80 (engine power
< 150 kW) 83 (engine power
> 150 kW)
78 (engine power
< 150 kW) 80 (engine power
> 150 kW)
Vehicles intended for the carriage of goods and having a
permissible maximum weight exceeding 3,5 metric tons 89
81 (engine power
< 75 kW) 83 (75 kW < engine power < 150 kW)
84 (engine power
> 150 kW)
77 (engine power
< 75 kW) 78
(75 kW < engine power < 150 kW)
80 (engine power
> 150 kW) Vehicles intended for the carriage of passengers,
comprising more than 9 seats including the driver’s seat, and having an engine power equal to or exceeding 200 HP DIN
91 -
-Vehicles intended for the carriage of goods and having an engine power equal to or exceeding 200 HP DIN and a permissible maximum weight exceeding 12 metric tons
91 -
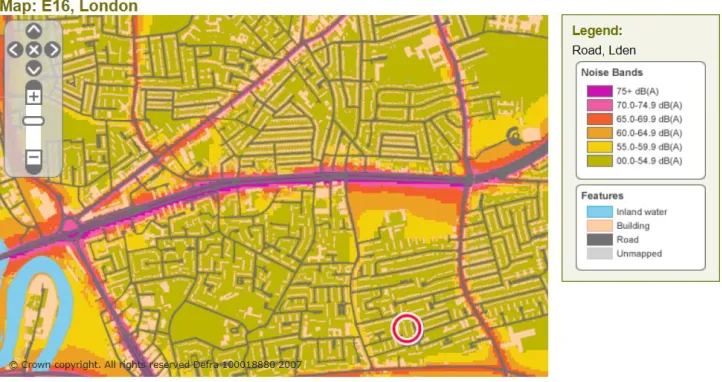
Fig. 1.
Strategic Noise Mapping in London Source: http://www.defra.gov.uk/
During 2008 the city of Zagreb joined as participant the European project Civitas ELAN (Civitas Zagreb, 2014). On the selected demonstration corridor of the Savska Road, among other evaluation parameters for the assessment of the efficiency of implemented measures it was necessary to determine the noise level by using simulation tools. This paper shows the basic characteristics of this European project and the methodology of estimating noise level on the selected demonstration corridor by using the macro-simulation software tool PTV Visum.
2. CIVITAS Initiative
The European Commission is working to improve the quality of life of the citizens and to strengthen the economy by promoting sustainable urban mobility and increased
CIVITAS PLUS (2008-2012) started within the 7th Framework Research Programme and 25 cities in 5 demonstration projects were taking part including the CIVITAS ELAN with the cities of Ljubljana, Gent, Zagreb, Porto and Brno (Fig. 2). In each city a CIVITAS-ELAN corridor has been defined which usually includes a major arterial road linking the city centre and the agglomeration, including the neighbouring areas. Measures implemented in Zagreb are: Energy recovery system for trams, Clean public fleet vehicles, Clean public transport strategies (CNG, biofuel & emission control), Intermodal high-quality mobility corridor, Promotion of electronic PT tariff system, Comprehensive mobility dialogue and marketing Study, Mobility management for large institutions, Improving cycling conditions, Comprehensive safety and security strategies, Safety & security for seniors, Security improvement in public transport, Freight delivery restrictions, Public transport priority and traveller information (Civitas ELAN - Description of Work, 2008).
The main objectives of the project in the city of Zagreb were: to alleviate traffic congestion, to improve quality, accessibility and attractiveness of public transport, to switch to cleaner modes of public transport, to lower environmental impact of city fleet, to include existing railway into the city public transport system, to improve cycling conditions and to introduce alternative modes of transport and mobility.
This paper is focused on measure 3.2 – Study of congestion charging and dialogue on pricing, particularly on the aspect of noise emission within the demonstration corridor. Since the estimate of the noise level had to be determined by using the simulation tools and since the level depends, among other parameters, on the traffic flow, it was necessary to make a traffic model of the corridor. Therefore, a part of this research refers also to measure 8.2 - Public transport priority and traveller information in which the simulation model of the Savska Road was made with the priorities for the vehicles of the public urban transport at three intersections.
Fig. 2.
3. Implementation of the Macroscopic
Modelling in Determining the Noise Level
on the Roads
Since on the corridor of the Savska Road it was not possible to perform noise measurements on all intersections and since in the city of Zagreb there is no systemic noise measurement, in the description of the Civitas measure the determination of the noise level has been defined by using the simulation software tools. The model was calibrated by using the data on noise measurements in the Frankopanska Street and Slavonska Avenue in 2008.
Noise emission on the observed Civitas ELAN corridor in the Savska Road was analyzed by implementing the simulation tool PTV Visum. PTV Visum is the leading world software tools for macroscopic modelling of the transport demand and it is today used in the world by over 1,000 organizations (PTV Visum Overview, 2004). Apart from transport demand modelling on the traffic network, among other things, with its additional modules it allows also the analysis of external traffic effects: emissions of harmful gases and noise level.
Before developing the model of the Savska Road in PTV Visum, a detailed traffic count on all intersections of the corridors was done in 2009 and 2012. Based on the collected data a micro-simulation model was developed using the tool PTV Vissim and vehicle trip origins and destinations on the corridor were determined. The obtained origin-destination trip matrix (OD matrix) presented the input parameter for the development of the macroscopic model in the PTV Visum program. After developing the traffic network and the input of the trip origin-destination matrix, an equilibrium
assignment of trips on the traffic network has been performed, and as result the traffic load of the traffic links on the Savska Road has been obtained. Since the traffic count was performed in the afternoon peak hour the noise level was analysed only for this one hour on a working day.
The module for the calculation of noise level in PTV Visum is based on the number of vehicles passing through the links of the traffic network, on the share of heavy vehicles in the traffic flow structure, longitudinal gradient and type of carriageway structure of the road.
PTV Visum offers two procedures of noise emission calculation (PTV Vision, 2010):
1. Noise-Emis-Rls90, 2. Noise-Emis-Nordic.
The first procedure Noise-Emis-Rls90 is based on the guidelines RLS-90 (Richtlinien für den Lärmschutz an Strassen, 1990) of the German Federal Ministry of Traffic, and the other procedure Noise-Emis-Nordic on the model of the Nordic Council of Ministers.
According to procedure Noise-Emis-Rls90 (Eq. (1)), the average noise level Lm is
calculated in the following way (RLS-90, 1990):
(1)
where:
M – relevant hourly traffic volume (car/h);
p – relevant heav y vehicle share in percentages of total traffic.
active link of the traffic network Lm,E (Eq.
(2)) is obtained by adding the correction factors according to RLS-90 (1990):
(2)
where:
Dv – speed correction for permissible maximum speeds other than 100 km/h;
DstrO – correction factor for different road surfaces;
DStg – correction factor for inclinations and gradients.
The latest version of the Nordic method for calculating the noise level was published in 2000 in cooperation with the Danish, Swedish, Icelandic, Norwegian and Finnish experts. The input data of the model are similar in the previous model: traffic load, traffic flow speed and its structure and type of carriageway structure (Kragh, 2006). The method itself is based on the collected data within the period from 1999 to 2000 on 21 measuring points under different conditions (Jonasson, 2006). Regarding the complexity of the method and a large number of correction parameters along with the model itself also a free software tool has been provided which adapts the general values by using correction factors to the actual situation. The basic formulae for calculating the noise generated by motor vehicles (Eq. (3), (4)) are (Jonasson, 2006):
(3)
where:
Lwr – noise generated by pneumatics
while moving along different carriageway structures;
ar , br – table-defined coefficients depending on the vehicle category;
V – vehicle speed [km/h];
Vref – referent speed, Vref = 70 km/h.
(4) where:
Lwp – noise generated by motor vehicle propulsion system (propulsion noise);
ap , bp – table-defined coefficients depending on vehicle category.
Measuring noise on selected locations in the city of Zagreb was performed in 2008. On Civitas corridor the daily noise was measured only in the Frankopanska Street and it amounted to 70.00 dB, and on the Slavonska Avenue where it amounted to 68.10 dB. The mentioned data were used in order to determine the application of adequate method for the calculation of noise. Compared to the data obtained by simulation tools, it has been observed that the results obtained by the application of the Nordic method feature a better match with the measured data.
before implementing the measures from the CIVITAS ELAN project, whereas traffic count in 2012 was used in order to be able to compare the noise level after having implemented the measures of
giving priority to vehicles of public urban transport, introducing new tram vehicles, by construction of cycling paths, etc. In Fig. 3 the results of noise emission prediction in the corridor using PTV Visum are shown.
Fig. 3.
Making of the Traffic Model of the Savska Road in PTV Visum and Noise Emission Calculation per Links
3.1. Calculation of Noise Emission
According to Noise-Emis-Rls90 Method
After making the traffic model of the Savska Road and trip assignment to the links on the
traffic network by using the Noise-Emis-Rls90 method, the estimates of noise level in 2009 and 2012 were obtained, and presented in Table 2.
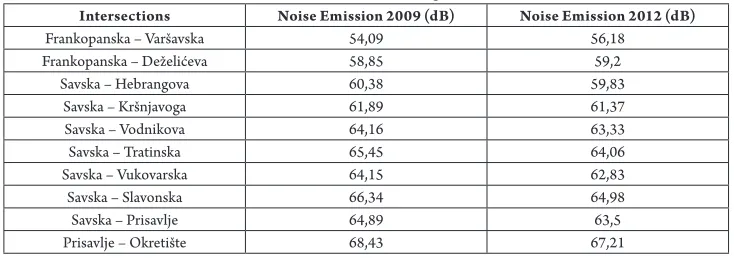
Table 2
Noise Emissions on Savska Road in 2009 and 2012 According to Noise-Emis-Rls90 Method
Intersections Noise Emission 2009 (dB) Noise Emission 2012 (dB)
Frankopanska – Varšavska 54,09 56,18
Frankopanska – Deželićeva 58,85 59,2
Savska – Hebrangova 60,38 59,83
Savska – Kršnjavoga 61,89 61,37
Savska – Vodnikova 64,16 63,33
Savska – Tratinska 65,45 64,06
Savska – Vukovarska 64,15 62,83
Savska – Slavonska 66,34 64,98
Savska – Prisavlje 64,89 63,5
3.2. Calculation of Noise Emission
According to Noise-Emis-Nordic Method
The calculation of noise emission according
to the Nordic method is presented in Table 3. Comparing the obtained results with the actually measured data shows that the Nordic method yields better results.
Table 3
Noise Emissions on Savska Road in 2009 and 2012 According to Noise-Emis-Nordic Method
Intersections Noise Emission 2009 (dB) Noise Emission 2012 (dB)
Frankopanska – Varšavska 61,32 63,4
Frankopanska – Deželićeva 66,08 66,43
Savska – Hebrangova 67,6 67,06
Savska – Kršnjavoga 69,11 68,6
Savska – Vodnikova 71,39 70,56
Savska – Tratinska 72,68 71,28
Savska – Vukovarska 71,38 70,06
Savska – Slavonska 73,57 72,21
Savska – Prisavlje 72,11 70,72
Prisavlje – Okretište 73,55 72,33
By comparing with the Regulation on permissible noise level in the zones of combined allocation with prevalently commercial facilities in Croatia one can observe exceeding of the permissible daily noise of 65 dB on sections of the Savska Road.
By analysing the results of noise calculation before and after implementing the Civitas measures, the emission of noise has been reduced by 1.51% according to RLS method,
i.e. 1.68% according to the Nordic method (Fig. 4).
4. Conclusion
Increased level of motorisation in the cities leads to the increase in the noise level which results in reduced quality of living accompanied by frequent health problems of the citizens. Recently, a number of measures have been undertaken in order to reduce the noise level at its sources or to attenuate its emission into the environment. Macro-simulation software tools allow long-term assessment of noise level in a certain area within time horizons up to 20 or 30 years based on the estimated traffic load on the roads. In this way it is possible to intervene in advance and to prevent negative action of noise. The model itself needs to be calibrated according to the available data on the actually measured noise levels in the analysed area. The estimation of the noise level by implementing the macro-simulation
software tools may be used also during the analysis of costs and benefits in evaluation and selection of the variant solutions.
The paper has presented the application of the macro-simulation tool PTV Visum for the assessment of noise level on the demonstration corridor of the European project Civitas ELAN in the city of Zagreb. By comparing the German and Nordic method for the assessment of noise in the city of Zagreb, the data obtained by the Nordic method have proven to be more accurate. Therefore, this method is proposed for further use during the design of new traffic facilities where there are no existing data on the noise level. In this way it is possible already during the design of a certain facility to implement the protection against the undesired noise which may occur due to the increased traffic load in the times to come. Fig. 4.
References
Civitas ELAN. 2008. Description of Work Annex I, Seventh Framework Programme, Mobilising citizens for vital cities.
Civitas Zagreb. 2014. Available from Internet: <http:// www.civitaszagreb.hr/naslovna/>.
Directive 2002/49/EC of the European Parliament and of the Council relating to the assessment and management of environmental noise. 2002. Bruxelles.
Directive 70/157/EEC of the Council of the European Communities on the approximation of the laws of the Member States relating to the permissible sound level and the exhaust system of motor vehicles. 1970. Bruxelles.
Directive 84/424/EEC of the Council of the European Communities amending Directive 70/157/EEC. 1984. Bruxelles.
Directive 92/97/EEC of the Council of the European Communities amending Directive 70/157/EEC. 1992. Bruxelles.
Handbook on the Implementation of EC Environmental Legislation, Section - Noise Legislation. 2008. Regional Environmental Center Umweltbundesamt GmbH: 1029-1062.
Jonasson, H. 2006. Acoustic Source Modelling of Nordic Road Vehicles. SP Rapport 2006:12. Borås.
Kragh, J. 2006. User’s Guide Nord2000 Road. Delta. Hørsholm.
Laszlo, H.E.; McRobie, E.S.; Stansfeld, S.A.; Hansell, A.L. 2012. Annoyance and other reaction measures to changes in noise exposure – a review, Science of the Total Environment. DOI: http://dx.doi.org/10.1016/j. scitotenv.2012.06.112, 435-436: 551-562.
Murphy, E.; King, E.A. 2010. Strategic environmental noise mapping: Methodological issues concerning the implementation of the EU Environmental Noise Directive and their policy implications, Environment International. DOI: http://dx.doi.org/10.1016/j. envint.2009.11.006, 36(3): 290-298.
PTV Vision: Visum 11.5 - Basics. PTV AG. 2010. Karlsruhe.
PTV Visum Overview. 2004. PTV America.
Richtlinien für den Lärmschutz an Straβen - Ausgabe 1990 - RLS -90. Bundesministerium für Verkehr. 1990. Bonn.
Salomons, E.M.; Pont, M.B. 2012. Urban traffic noise and the relation to urban density, form, and traffic elasticity, Landscape and Urban Planning. DOI: http:// dx.doi.org/10.1016/j.landurbplan.2012.06.017, 108(1): 2-16.