PROCESS ANALYSIS IN CONTAINER SHIPPING NETWORK
STRUCTURE FORM CHANGE
Chen Chao1, Yan Wei2
1, 2 Transportation Management College, Dalian Maritime University, Dalian 116026, China
Received 14 September 2011; accepted 02 November 2011
Abstract:Being aimed at the influence of ship-size and cargo-demand changes on container shipping networks, to reveal the evolution process of container shipping networks structure form, this paper respectively designed the operation models for two major container shipping networks structure forms: Multi-port-calling network and Hub-and-spoke network, to maximizing the investment efficiency. Based on the above models, a comprehensively integrated operation model of container shipping networks is built and the evolution process of container shipping networks structure form with changing of both ship-size and cargo demands is analyzed. Finally, through a case study, results show that the comprehensive integrated operation model is very effective in the analysis of evolution process of container shipping networks structure forms.
Keywords:comprehensive integrated operation model (CIO model), container shipping networks structure form, investment efficiency, Multi-Port-Calling network, Hub-and-Spoke network.
1 Corresponding author: [email protected]
1. Introduction
Ship large-sizing has become a leading approach to enlarging transport capacity and lowering transport cost. However, when cargo-demand growths between the ports cannot be synchronized with the ship-size growth, in order to guarantee the ships fully loaded, operators generally face the following choices: whether adding the number of calling ports and keeping the network structure unchanged, or reducing the number of calling ports and making the network structure change. The former makes for increasing the voyage revenue at the expense of prolong the voyage time, but the latter makes for improving voyage operation efficiency at the expense of decreasing the voyage revenue. Therefore, how to make the choice optimal
has become a primary problem of container shipping network optimization scheme and design. The analysis in the evolution process of container shipping network structure form is an effective method of dealing with this problem to promote the investment profit rate and make the network structure form more optimal.
of the minimization of O–D traffic travel length (in time) weighted by traffic volume. Shintani et al. (2007) formulate a two-stage model to solve the container shipping network design problem and develop a genetic algorithm-based heuristic for it. Hsu and Hsieha (2007) construct a shipping cost model to analysis the optimal decision between shipping directly or through a hub. Imai et al. (2009) discuss the container shipping network design problem considering empty container repositioning by constructed shipping operations models in both Multi-Port-Calling and Hub-and-Spoke networks. Chao and Chen (2010) explore the container shipping network designing under changing demand and freight rates by formulate a dynamic shipping operation model.
Chao and Ya (2010) have studied the transformation between the Multi-port-calling structure and Hub-and-spoke structure with ship-size increasing under condition of fixed cargo-demands. Thus, researches, which consider the ship-size and cargo-demand as influencing factors at the same time to study the evolution process of optimal route structure forms, are relatively less, and how to build a comprehensive integrated model which can compare the route operation effects under different route structures is a key issue in the analysis problem of evolution processes of container shipping route structure form.
Aiming at the influence of ship-size and cargo-demand change, this paper will study the evolution processes between the Multi-Port-Calling network and Hub-and-Spoke network mutually. First, the two major route structure forms’ shipping operation models are established respectively, and then a route comprehensive integrated model is built with objective of maximizing the investment profit rate. After that, we use those models to analyze the evolution process of optimal
route structure form between Multi-Port-Calling network and Hub-and-Spoke network. Finally, we prove the effectiveness of the proposed approach and model through a case experiment.
2. Problem Description
region. Therefore, ship-size and cargo-demand directly determine the optimal selection of route structure forms and the optimization of other specific elements in routes.
3. Model Formulations
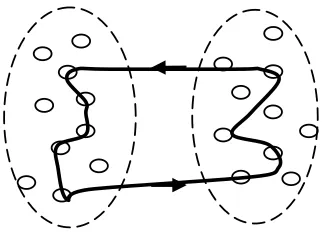
Considering characteristics of the two networks, we assume that the number of candidate ports is enough, cargo-demand from each port is same, freight rate between port pairs is same too, there is no cargo flows among ports in the same region of area, and waiting time in every port is same and fixed. If the ship-size and the cargo-demand are chosen as variables, the investment profit models of Multi-Port-Calling network and Hub-and-Spoke network could be formulated respectively as following sections.
3.1. Multi-Port-Calling Networks
If the trade area is divided into two regions which are denoted by A, B respectively, let
i=1,2,3…,n be the ports in region A and
j=1,2,3…,m be the ports in region B; P
investment profit rate; CAP ship-size; Xijthe quantity of loaded containers from port i to port j; Yjithe quantity of loaded containers from port j to port i; Dija cargo-demand from port i in A to port j in B;Djib cargo-demand from port j in B to port i in A; CFO and
CDOdenote the average daily fuel oil (FO) consumption and the average daily diesel oil (DO) consumption respectively; PFOand
PDO average prices of FO and DO; T denotes the closed voyage time, Tm and Tsdenote the sailing time of ships and waiting time at ports respectively; Pia and Pibdenote the charge rate at port i in A andthecharge rate at port
j in B; Ni and Mj are binary variables. Ni=1 if port i is called and 0 otherwise; Mj=1 if port
j is called and 0 otherwise; α and β are the coefficient of capital cost; θ is the coefficient of waiting time, in this paper θ =1.5 which means 1 day for a ship sailing from one port to the next in the same region, and 0.5 day for cargo handling at each port. With above sets, Multi-Port-Calling investment profit rate model can be formulated as follows:
Fig. 1.
Two Types of Networks
Objective:
(1)
S.t.
(2)
(3)
(4)
(5)
(6)
(7)
3.2. Hub-and-Spoke Networks
Compared with the route operation in Multi-Port-Calling network, only hub ports are called in Hub-and-Spoke network. So, in this
paper, the number of calling ports equals to 2, as θ =1.5, thus Ts=3, and Tm, CF are fixed. Other constraints are the same with Multi-port-calling networks’. Thus, the model is constructed as follows:
Objective:
(8)
St.
(9)
(10)
(11)
Besides the difference in network structure forms, the significant distinction between Hub-and-Spoke network and Multi-Port-Calling network is reflected in the operation profit pattern.
Where: rasub and rbsub denote the feeder segment freight rates in region A and region B respectively. According to the above constraints, we can figure out that the specific position of objective curve for Hub-and-Spoke networks is directly influenced by differently pricing the main segment and feeder segment freight. To guarantee that the transformation between two different networks occurs at the point of the maximum value of Multi-Port-Calling investment profit curve, the model constructed should include following constraints.
When CAP = CAP0 |(∂P1 / ∂CAP = 0),
P2 = P1
Then, an integrated model will be developed in the following section, in which the profit rate curve could be insured to increase monotonically, even if the networks are transformed.
3.3. A Comprehensive Integrated
Operation Model
According to the analysis above, a binary variable λ is introduced to combine the two network operation models into a comprehensive integrated model (CIO model). Let CL signifies capital cost; CF flue cost; CP port charge cost, the CIO model can be constructed as follows:
Objective:
(12)
S.t.
(13)
(14)
(15)
(16)
(17)
4. A Case Study
This section presents a sample case to demonstrate the application of the proposed formulation. The case experiment focuses on container shipping network design in the trade area of Northeast Asia and west coast of North America.
Set Northeast Asia as region A, candidate ports are as follows: Guangzhou, Tianjin,
Shanghai, Ningbo, Qingdao, Huanghua, Dalian, Guangzhou, Yantai, Rizhao, Lianyungang, Busan, Kobe, Nagoya and Yokohama.
Set west coast of North America as region B, candidate ports are as follows: Long Beach, Los Angeles, Seattle, Auckland, San Diego, Tacoma, Portland, Berkeley, Netherlands, Hong Kong, San Francisco, San Jose, Ensenada, Mazatlan and Manzanillo.
(19)
(20)
(21)
(22)
(23)
Other parameters are set as follows: Freight rates: Multi-Port-Calling route, 1,800 USD/ TEU; Hub-and-Spoke route, 1,300 USD/TEU. Average port charge rates, 5×CAP USD per ship.
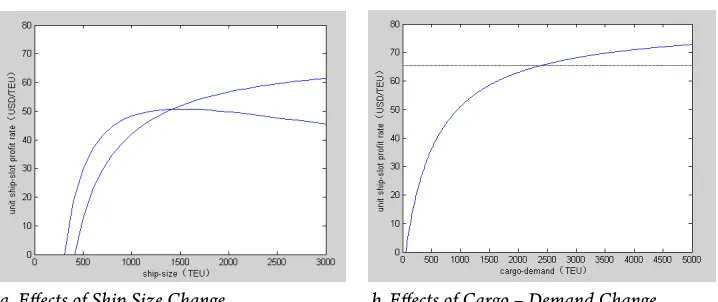
Then, we use the Matlab 7.0 to solve the model of the case experiment, figures and results are obtained as follows: When the ship-size increases from 0 to 3,000 TEU with 500 TEU of cargo-demand from each calling port, the objective value curve is shown as Fig. 2a.
The results demonstrate that when the ship-size capacity exceeds 1,480 TEU, the optimal structure form changes from Multi-Port-Calling networks to Hub-and-Spoke networks, and the objective value at the transforming point is 50.7 USD.
When the cargo-demand increases from 0 to 5,000 TEU with 8,000 TEU capacity of the ship-size, the objective value curve is shown as Fig. 2b. The results show that when the cargo-demand exceeds 2,490 TEU, the optimal route structure form changes from Hub-and-Spoke networks to Multi-Port-Calling networks, and the objective value at the transforming point is 64.7 USD.
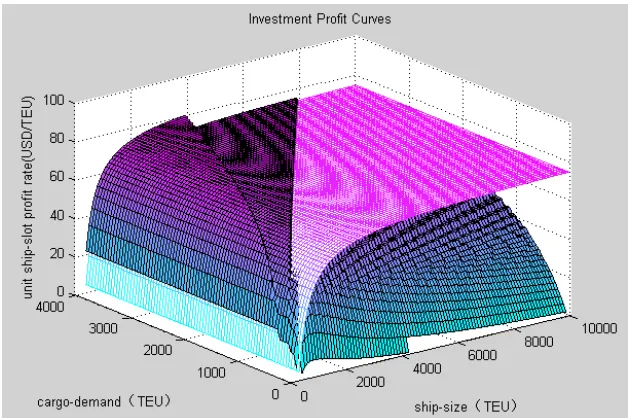
When the cargo-demand and ship-size change simultaneously, the objective value curve is shown as Fig. 3. When the ship-size is small, we can figure out that the optimal structure form is Hub-and-Spoke networks, in fact it is the Point-to-Point route. With the ship-size growth, optimal route structure form firstly transforms to Multi-Port-Calling networks. As the ship-size is growing further, the optimal structure form then changes to Hub-and-Spoke networks.
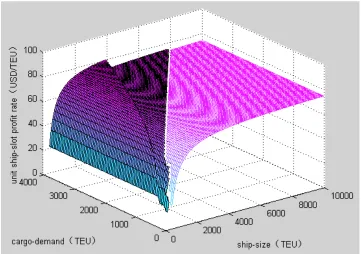
The intersection curve of two surfaces is shown as Fig. 4. The curve demonstrates the relationship of cargo-demand and ship-size at the transforming points. Obviously, the results prove that the more the cargo-demand, the larger the ship-size at the transforming points.
Applying the CIO model to solve this case, we can obtain the results that are shown in Fig. 5. When the variables vary in the left part of the intersection curve, the Multi-Port-Calling networks is selected as an optimal structure form for the container shipping networks design, otherwise, the Hub-and-Spoke networks.
a. Effects of Ship Size Change b. Effects of Cargo – Demand Change
Fig. 2.
Fig. 3.
Ship-Size and Cargo-DemandChanges
Fig. 4.
Fig. 5.
Comprehensive Integrated Model Results
5. Conclusion
This study addresses the evolution process of container shipping network structure forms when the ship-size and cargo-demand change at the same time. Through integrating Multi-Port-Calling networks and Hub-and-Spoke networks, the paper builds a comprehensive integrated model with the objective of maximizing investment profit rate. This
References
Bendall, H. B.; Stent, A. F. 2001. A scheduling model for a high speed containership service: A hub-and-spoke short-sea application. International Journal of Maritime Economics
3: 262-277.
Chao, C.; Chen, Z. Q. 2010. Designing Container Shipping Network under Changing Demand and Freight Rates,
Transport 25(1): 46-57.
Chao, C.; Ya, S. 2010. The choice of the line structure mode, Journal of DaLian Maritime University 36 (4).
Hsu, C. I.; Hsieha Y. P. 2007. Routing, ship size, and sailing frequency decision-making for a maritime hub-and-spoke container network, Mathematical and Computer Modelling 45: 899-916.
Imai, A.; Nishimura, E.; Papadimitriou, S.; Liu, M. 2006. The economic viability of container mega-ships.
Transportation Research Part E 42: 21-41.
Imai, A.; Shintani, K.; Papadimitriou, S. 2009, Multi-port vs. Hub-and-Spoke Multi-port calls by containerships,
Transportation Research Part E 45: 740-757.
Shintani, K.; Imai, A.; Nishimura E.; Papadimitriou, S. 2007. The container shipping network design problem with empty container repositioning, Transportation research
Part E 43: 39-59.
PROCESNA ANALIZA U PROMENI
S T R U K T U R E K O N T E J N E R S K E
TRANSPORTNE MREŽE U VODNOM
TRANSPORTU
Chen Chao, Yan WeiSažetak:S obzirom na sve veći uticaj veličine broda i veličine zahteva za prevozom robe na mreže kontejnerskog transporta, a imajući u vidu razvoj njihove strukture, u ovom radu su prikazani operativni modeli dve osnovne strukture kontejnerskih transportnih mreža (Multi-port-calling mreža i Hub-and-spoke mreža) kojima se omogućava maksimiziranje efikasnosti investicija. Na osnovu pomenutih modela, razvijen je sveobuhvatni integrisani operativni model kontejnerske transportne mreže pomoću koga je izvršena analiza razvoja strukture kontejnerske mreže u funkciji veličine broda i veličine zahteva za prevozom robe. Na kraju, kroz studiju slučaja, rezultati su pokazali da je sveobuhvatni integrisani operativni model vrlo efikasan u analizi procesa razvoja strukture kontejnerskih transportnih mreža u brodarstvu.