A Multicenter Study To Evaluate the
Performance of High-Throughput
Sequencing for Virus Detection
Arifa S. Khan,aSiemon H. S. Ng,bOlivier Vandeputte,cAisha Aljanahi,a* Avisek Deyati,dJean-Pol Cassart,eRobert L. Charlebois,bLanyn P. Taliaferroa* Division of Viral Products, Office of Vaccines Research and Review, Center for Biologics Evaluation and Research, U.S. Food and Drug Administration, Silver Spring, Maryland, USAa; Analytical Research and Development North America, Sanofi Pasteur, Toronto, Ontario, Canadab; Analytical Research and Development, GSK Vaccines, Rixensart, Belgiumc; Vaccine Discovery and Development, GSK Vaccines, Rixensart, Belgiumd; Central Quality Control, GSK Vaccines, Wavre, Belgiume
ABSTRACT The capability of high-throughput sequencing (HTS) for detection of known and unknown viruses makes it a powerful tool for broad microbial investiga-tions, such as evaluation of novel cell substrates that may be used for the develop-ment of new biological products. However, like any new assay, regulatory applica-tions of HTS need method standardization. Therefore, our three laboratories initiated a study to evaluate performance of HTS for potential detection of viral adventitious agents by spiking model viruses in different cellular matrices to mimic putative ma-terials for manufacturing of biologics. Four model viruses were selected based upon different physical and biochemical properties and commercial availability: human re-spiratory syncytial virus (RSV), Epstein-Barr virus (EBV), feline leukemia virus (FeLV), and human reovirus (REO). Additionally, porcine circovirus (PCV) was tested by one laboratory. Independent samples were prepared for HTS by spiking intact viruses or extracted viral nucleic acids, singly or mixed, into different HeLa cell matrices (resus-pended whole cells, cell lysate, or total cellular RNA). Data were obtained using dif-ferent sequencing platforms (Roche 454, Illumina HiSeq1500 or HiSeq2500). Bioinfor-matic analyses were performed independently by each laboratory using available tools, pipelines, and databases. The results showed that comparable virus detection was obtained in the three laboratories regardless of sample processing, library prep-aration, sequencing platform, and bioinformatic analysis: between 0.1 and 3 viral ge-nome copies per cell were detected for all of the model viruses used. This study highlights the potential for using HTS for sensitive detection of adventitious viruses in complex biological samples containing cellular background.
IMPORTANCE Recent high-throughput sequencing (HTS) investigations have resulted in unexpected discoveries of known and novel viruses in a variety of sample types, in-cluding research materials, clinical materials, and biological products. Therefore, HTS can be a powerful tool for supplementing current methods for demonstrating the absence of adventitious or unwanted viruses in biological products, particularly when using a new cell line. However, HTS is a complex technology with different platforms, which needs standardization for evaluation of biologics. This collaborative study was undertaken to investigate detection of different virus types using two dif-ferent HTS platforms. The results of the independently performed studies demon-strated a similar sensitivity of virus detection, regardless of the different sample preparation and processing procedures and bioinformatic analyses done in the three laboratories. Comparable HTS detection of different virus types supports future de-velopment of reference virus materials for standardization and validation of different HTS platforms.
Received10 July 2017Accepted23 August 2017 Published13 September 2017 CitationKhan AS, Ng SHS, Vandeputte O, Aljanahi A, Deyati A, Cassart J-P, Charlebois RL, Taliaferro LP. 2017. A multicenter study to evaluate the performance of high-throughput sequencing for virus detection. mSphere 2: e00307-17.https://doi.org/10.1128/mSphere
.00307-17.
EditorKatherine McMahon, University of Wisconsin—Madison
This is a work of the U.S. Government and is not subject to copyright protection in the United States. Foreign copyrights may apply. Address correspondence to Arifa S. Khan, [email protected].
*Present address: Aisha Aljanhi, Georgetown University, Washington, DC, USA; Lanyn P. Taliaferro, National Institutes of Health, Bethesda, Maryland, USA.
A.S.K., S.H.S.N., and O.V. contributed equally to this work.
Host-Microbe Biology
crossm
on September 8, 2020 by guest
http://msphere.asm.org/
KEYWORDS 454 Roche, Illumina, adventitious viruses, high-throughput sequencing, spiking study, virus detection
S
everal advanced nucleic acid-based technologies have recently emerged withcapabilities for broad virus detection (1). High-throughput sequencing (HTS), also called next-generation sequencing or massively parallel sequencing, is recognized as a powerful new technology for the detection and identification of known and unknown microbes. This unbiased sequencing technique therefore has potential applications for characterization and safety evaluation of adventitious agents in biologics. This may be of particular interest for investigations of novel cell substrates that may have increased safety concerns regarding the presence of unknown viruses (2–5) and other biological materials (6, 7). Furthermore, although the currently recommended tests for adventi-tious agent detection are extensively applied at various stages in manufacturing (7), there are still rare cases of unexpected virus detection. Several advanced nucleic acid-based technologies have demonstrated detection of unexpected, known viruses, as well as novel viruses in clinical, environmental, and biological samples. Panmicrobial microarray and HTS analysis of commercial lots of vaccines found porcine circovirus type 1 (PCV1) present in a rotavirus vaccine (8). The use of a degenerate PCR assay and HTS resulted in the discovery of a novel rhabdovirus in the insect Sf9 cell line (9), which is used for several baculovirus-expressed products. Liquid chromatography coupled to mass spectrometry (LC/MS) was used to identify vesivirus 2117 in Chinese hamster ovary (CHO) cell-bioreactor production runs, which was confirmed by reverse transcription-PCR (RT-transcription-PCR) (10). Such findings highlight a critical gap in the current testing strategies, which although quite extensive and rigorous, have some limitations for adventitious agent detection. HTS could complement the gaps in the currently recommended
testing for enhancing product safety. For example, in the case ofin vitroadventitious
assays, virus detection relies on replication and exhibition of biological properties, such as cytopathic effect, hemadsorption, and hemagglutination, and in the case of PCR assays, the availability of accurate genomic sequence data is essential for the design of primer pairs. HTS can provide information regarding the nucleic acid sequence content in a sample, including those from viral adventitious agents, independent of availability of virus sequences or the visual effects due to virus replication.
It is recognized that the application of HTS for virus detection in biologics needs standardization and controls for implementation of the methodology. This is particu-larly challenging for HTS, since the technology is complex. There are a number of upstream handling and processing steps prior to the sequencing. There are different sequencing platforms and bioinformatic pipelines. There is a lack of readily available reference viruses for performance evaluation and method standardization. This unmet need was recognized through various conferences and discussions by industry scien-tists, regulatory authorities, as well as technology service providers, leading to the formation of the Advanced Virus Detection Technologies Interest Group (AVDTIG) (11). A major focus of this group is to coordinate efforts to identify and address critical gaps for using HTS for applications in biologics. Three laboratories, participating in the AVDTIG, led an initiative to conduct a virus spiking study with the aim to evaluate the sensitivity of virus detection using different model viruses. This study used the same virus stocks but was independently performed in all other aspects. Such a study design was aimed to demonstrate the maximum impact of differences on HTS results, based upon sample preparation and processing, library construction, sequencing platforms, and bioinformatic analysis. This paper describes the technical details and bioinformatics performed by the three laboratories and compares the HTS results based upon spiking different genome copy numbers per cell in different background matrices. The impor-tant finding of this collaborative study was that similar sensitivities of virus detection were obtained when the same virus stocks were used regardless of independent experimental design and subsequent processing steps, demonstrating the robustness of the HTS methodology and the different technology platforms used in this study.
on September 8, 2020 by guest
http://msphere.asm.org/
RESULTS
Overview of HTS study designs and methodologies. The general plan of the
studies conducted by the three laboratories is shown in Table S1 in the supplemental material. It is noted that the starting cell and virus materials were obtained from a common source, but different sample types were prepared independently to reflect the complexities of potential biological materials (for example, viral nucleic acid in a background of cellular nucleic acids and viral particles along with whole cells or in cell lysate). The different treatment conditions used for upstream sample processing and library preparations and for downstream bioinformatics are indicated for each of the three laboratories, since they comprise some of the critical steps that could influence the quantity and quality of HTS data.
HTS results of lab A.HTS results and analysis of the three different sample types
studied by lab A are discussed below. Spiking of viral genomes in the background of total cell RNA was done to achieve approximately one viral genome copy per cell equivalent (corresponding to a medium spike level in studies by lab B and lab C). For viral particles spiked individually or as mixed virus in cell lysate, spiking was done based upon total particle counts, except for porcine circovirus type 1 (PCV1), and the calculated genome copy equivalent for all ranged from 0.71 to 1.26 (see Materials and Methods). To evaluate detection of particle-associated viral genomes in samples con-taining virus particles spiked in cell lysate, the background cellular nucleic acid content was reduced by treatment with nucleases (DNase and RNase) prior to extraction (indicated in Table S1). Bioinformatic analysis was done using the relevant spiked virus genome as the reference for mapping or using human papillomavirus type 18 (HPV18), which is known to be integrated in the HeLa cell genome. The inclusion of HPV18 analysis provided an internal control for evaluation of nucleic acid recovery during sample processing and bioinformatic analysis.
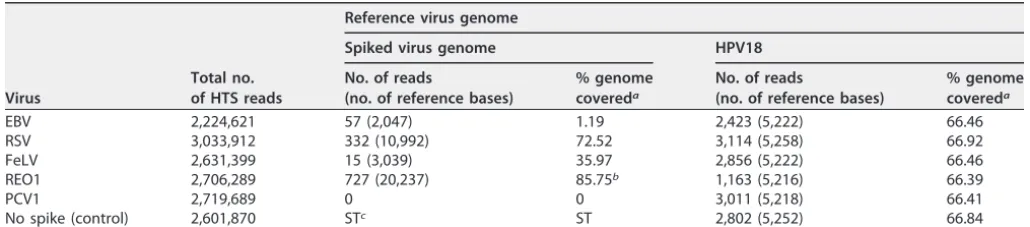
(i) Viral genomes spiked individually into HeLa cell RNA.The results shown in
Table 1 indicate that all of the viruses, except PCV1, were detected with different numbers of reads and percentages of genome coverage.
The absence of PCV1 detection may be due to its small, circular genome, which may
not have been captured by poly(A)⫹selection, a step that was used for selection of all
of the RNA preparations, except reovirus 1 (REO1). Since the REO1 viral genome lacks a poly(A) tail, a ribosomal depletion step was done to reduce the rRNA content in this sample, prior to the cDNA synthesis step. It was noted that HPV18 RNA, which is constitutively expressed in HeLa cells, was detected similarly in all of the samples including PCV1, with similar number of reads albeit lower for the rRNA-depleted sample but with the same coverage (66 to 67%) for all. The results suggest that rRNA depletion
may reduce recovery of poly(A)⫹RNAs, but additional studies are needed for
confir-mation. The results for HPV18 with the unspiked control HeLa cell RNA (Table 1) were
similar to those for other samples that were poly(A)⫹selected. Furthermore, the control
sample was analyzed to determine the number of potential nonspecific reads
contrib-TABLE 1 Lab A spiking study: analysis of individual viral genomes spiked in HeLa cell RNA
Virus
Total no. of HTS reads
Reference virus genome
Spiked virus genome HPV18
No. of reads
(no. of reference bases)
% genome covereda
No. of reads
(no. of reference bases)
% genome covereda
EBV 2,224,621 57 (2,047) 1.19 2,423 (5,222) 66.46
RSV 3,033,912 332 (10,992) 72.52 3,114 (5,258) 66.92
FeLV 2,631,399 15 (3,039) 35.97 2,856 (5,222) 66.46
REO1 2,706,289 727 (20,237) 85.75b 1,163 (5,216) 66.39
PCV1 2,719,689 0 0 3,011 (5,218) 66.41
No spike (control) 2,601,870 STc ST 2,802 (5,252) 66.84
aCalculated based upon the total number of reference bases covered by the mapped reads. bThe total reference genome was calculated based upon combining all 10 REO1 genes. cST, see text. Results for the individual viruses are reported in the text.
on September 8, 2020 by guest
http://msphere.asm.org/
uted by the HeLa cell background by mapping against each of the individual viruses used for spiking: there were only 35 reads detected for Epstein-Barr virus (EBV) (0% genome coverage), 1 for PCV (1% genome coverage), and 2 for REO1 (0% genome coverage). These values are the values for the ST (see text) entries in Table 1.
(ii) Viral particles spiked individually into HeLa cell lysate.To sequence particle-associated viral genomes, the samples were treated with nuclease (DNase and RNase) to remove HeLa cell nucleic acids, prior to viral nucleic acid extraction. The results shown in Table 2 indicated that all of the spiked viruses were detected.
Furthermore, compared with the RNA spiking study in Table 1, there was a greater number of reads and percent genome coverage, except for REO1, which may reflect inefficiency of viral extraction for REO1 or sensitivity to nuclease treatment. Interest-ingly, PCV1 was detected with 100% virus genome coverage, indicating robustness of the extraction method, since PCV1 is a highly resistant virus. Additionally, the effec-tiveness of the nuclease treatment was seen by the significant reduction in the total read number for HPV18 and also in the decreased percent genome coverage (com-pared with about 66% in Table 1).
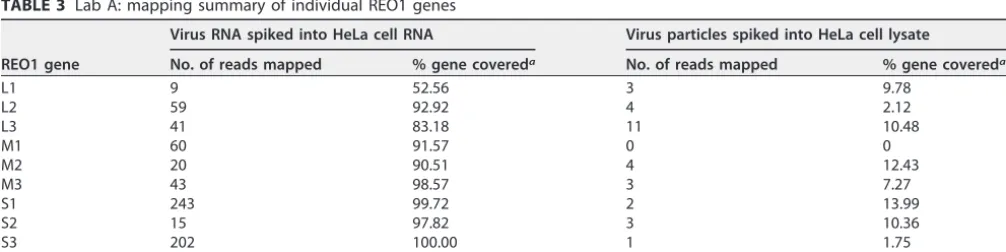
(iii) Analysis of REO1 genes. Since the REO1 genome is segmented, reads were
mapped with each individual gene. The results of the spiking studies with REO1 virus genome spiked in HeLa cell RNA and REO1 virus particles spiked in HeLa cell lysate are shown in Table 3. In case of viral RNA spiking, sufficient reads were mapped for all 10 genes with about 53 to 100% gene coverage. The difference in the gene coverage was not due to difference in length (see Table S2) and is therefore most likely sequence based. However, in the case of spiking viral particles, fewer reads were mapped and none in the case of the M1 gene, resulting in an overall 0 to 15% gene coverage. This highlights the importance of mapping to all genes of a segmented virus genome for detection using HTS.
(iv) A mix of the five viruses spiked into HeLa cell lysate. The sample was
processed and extracted similar to samples spiked with the individual viruses. The
TABLE 2 Lab A spiking study: analysis of individual viruses spiked in HeLa cell lysate
Virus
Total no. of HTS reads
Reference virus genome
Spiked virus HPV18
No. of reads
(no. of reference bases)
% genome covereda
No. of reads
(no. of reference bases)
% genome covereda EBV 1,920,259 3,502 (107,223) 62.24 57 (1,770) 22.53
RSV 1,605,408 1,920 (14,870) 98.10 35 (1,851) 23.56
FeLV 2,217,454 172 (5,467) 64.71 250 (1,509) 19.21
REO1 1,961,767 23 (1,530) 6.48b 48 (833) 10.60
PCV1 1,956,346 195 (1,759) 100.06 43 (855) 10.88
aCalculated based upon the total number of reference bases covered by the mapped reads. bThe total reference genome was calculated based upon combining all 10 REO1 genes.
TABLE 3 Lab A: mapping summary of individual REO1 genes
REO1 gene
Virus RNA spiked into HeLa cell RNA Virus particles spiked into HeLa cell lysate
No. of reads mapped % gene covereda No. of reads mapped % gene covereda
L1 9 52.56 3 9.78
L2 59 92.92 4 2.12
L3 41 83.18 11 10.48
M1 60 91.57 0 0
M2 20 90.51 4 12.43
M3 43 98.57 3 7.27
S1 243 99.72 2 13.99
S2 15 97.82 3 10.36
S3 202 100.00 1 1.75
S4 38 88.71 3 14.63
aCalculated based upon the total number of reference bases covered by the mapped reads.
on September 8, 2020 by guest
http://msphere.asm.org/
results of the mixed-virus spiking study are shown in Table 4. Overall, the values were similar to those obtained with the individual viruses, albeit slightly lower.
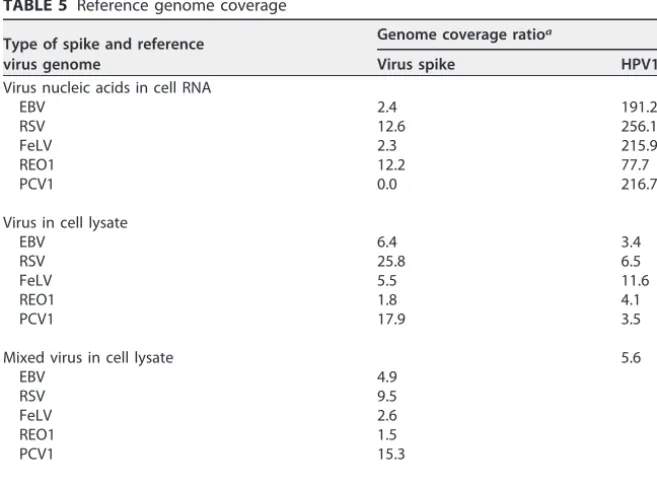
(v) Evaluation of nuclease treatment on HTS virus detection. The different
sample types used in the study allowed for evaluation of viral genomes spiked in cell transcriptome and detection of particle-associated viral genomes extracted after nu-clease treatment. It was noticed that the reduction of cellular background due to nuclease treatment resulted in significant increase in the depth of the mapped reads and percent genome coverage that can enhance virus detection. The results of EBV and feline leukemia virus (FeLV) are shown in Fig. S1 and S2, respectively. The influence of the presence of high cellular background nucleic acid in virus detection was evident based upon the genome coverage ratio, which was determined as a ratio of the total number of mapped bases of the reads and the number of bases covered in the reference genome. The results are shown in Table 5. In general, more coverage or depth in the number of reads was seen in the virus spiked in cell lysate samples, where there was reduction of cellular background due to nuclease treatment; however, there was less coverage in the case of REO1, which may be due to sample processing not optimized for extraction and/or library preparation of double-stranded RNA or sensi-tivity to the nuclease treatment step.
TABLE 4 Lab A spiking study: analysis of mixed virus spiked in HeLa cell lysate
Virus
Total no. of HTS reads
Relevant reference virus genome
No. of reads
(no. of reference bases) % genome covereda
EBV 2,050,654 3,224 (87,974) 51.06
RSV 816 (12,087) 79.74
FeLV 38 (2,585) 30.60
REO1 20 (1,785) 7.56b
PCV1 202 (1,600) 91.01
HPV18 60 (722) 9.19
aCalculated based upon the total number of reference bases covered by the mapped reads. bThe total reference genome was calculated based upon combining all 10 REO1 genes.
TABLE 5 Reference genome coverage
Type of spike and reference virus genome
Genome coverage ratioa
Virus spike HPV18
Virus nucleic acids in cell RNA
EBV 2.4 191.2
RSV 12.6 256.1
FeLV 2.3 215.9
REO1 12.2 77.7
PCV1 0.0 216.7
Virus in cell lysate
EBV 6.4 3.4
RSV 25.8 6.5
FeLV 5.5 11.6
REO1 1.8 4.1
PCV1 17.9 3.5
Mixed virus in cell lysate 5.6
EBV 4.9
RSV 9.5
FeLV 2.6
REO1 1.5
PCV1 15.3
Control (no spike) 233.8
aDetermined as a ratio of the total number of mapped bases of the reads and the number of bases covered
in the reference genome.
on September 8, 2020 by guest
http://msphere.asm.org/
(vi) Summary. The overall results of lab A HTS studies indicated that sample preparation and processing steps influenced virus detection. In general, a higher number of viral reads was obtained (except for REO1 discussed above) in the samples with nuclease treatment than the untreated samples. In particular, PCV1 could not be
detected in poly(A)⫹selected RNAs while rRNA depletion, instead of poly(A)⫹selection,
may have enhanced REO1 detection, and reduction of background nucleic acids by nuclease treatment enhanced particle-associated virus detection.
HTS results of lab B. Two sample matrices were explored by lab B to compare
between viruses spiked onto whole cells and viruses spiked into cell lysates, with all four viruses spiked together. In general, all viruses were detected at 100 copies per cell. The majority of the viruses were detectable at 3 genome copies per cell. The coverage of the detected viruses ranged from 2.9% to greater than 90% and was generally proportional to the number of reads.
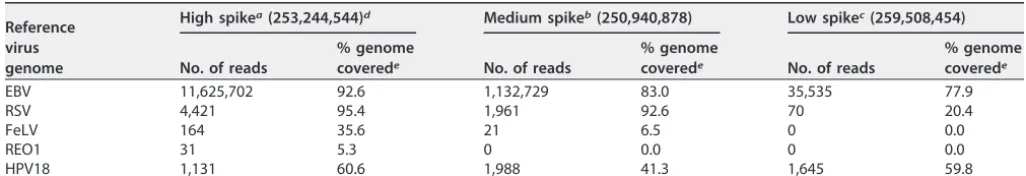
(i) Viruses spiked into cell lysate.In the sample where four viruses (EBV, respira-tory syncytial virus [RSV], FeLV, and REO1) were spiked into cell lysate, all viruses were detected at 100 copies per cell. However, three of the four viruses were detected at 3 copies per cells (no reads were detected from REO1) and two of the four viruses (EBV and RSV) were detected at 0.1 copies per cell. The results are shown in Table 6. EBV was the most readily detected with the highest number of reads compared with the other viruses spiked into the cell lysate matrix. Even at 0.1 copies per cell, 35,535 reads were detected for EBV, and 77.9% of its genome could be mapped. Similar to EBV, RSV was detected at 0.1 viral genome copies per cell in this matrix; however, with 70 reads, only 20.4% of the RSV genome was covered. In contrast, more reads were mapped at 100 and 3 viral genome copies per cell, and the genome coverage for RSV was greater than 90%, suggesting that the entire RSV genome is present in the sample and could potentially be recovered with more reads. Within the same cell lysate matrix, FeLV was not detected at 0.1 viral genome copies per cell but only at 3 viral genome copies per cell with a limited number of reads that resulted in genome coverage of only 6.5%. REO1 is a nonenveloped double-stranded RNA (dsRNA) virus and was detected only at 100 viral genome copies per cell. Even at such a high level of spike, only 31 reads were obtained. With such a low number of reads, the REO1 virus showed the poorest genome coverage (5.3%) when read mapping was performed.
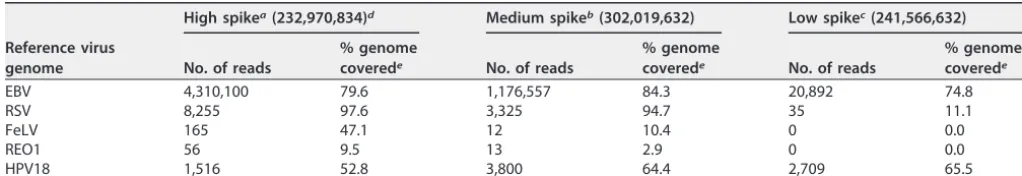
(ii) Viruses spiked into whole cells.In the sample where four viruses (EBV, RSV,
FeLV, and REO1) were spiked directly into cells, all viruses were detected at three copies per cell. The results are shown in Table 7. Similar to the mixed virus spiked into a cell lysate, only EBV and RSV were detected at 0.1 copies per cell. EBV was the most readily detected with the highest number of reads for viruses spiked into cells and was detected at 0.1 copies per cell. RSV was also detected at 0.1 viral genome copies per cell in this matrix but with a lower number of reads. Similar to the results obtained when spiking into the cell lysate, FeLV and REO1 were not detected at 0.1 viral genome copies per cell but only at 3 viral genome copies per cell.
TABLE 6 Lab B spiking study: analysis of mixed virus spiked into cell lysate
Reference virus genome
High spikea(253,244,544)d Medium spikeb(250,940,878) Low spikec(259,508,454)
No. of reads
% genome
coverede No. of reads
% genome
coverede No. of reads
% genome coverede
EBV 11,625,702 92.6 1,132,729 83.0 35,535 77.9
RSV 4,421 95.4 1,961 92.6 70 20.4
FeLV 164 35.6 21 6.5 0 0.0
REO1 31 5.3 0 0.0 0 0.0
HPV18 1,131 60.6 1,988 41.3 1,645 59.8
aHigh spike, 100 copies per cell. bMedium spike, 3 copies per cell. cLow spike, 0.1 copy per cell.
dThe total number of reads is shown in parentheses. ePercentage of viral genome covered by the mapped reads.
on September 8, 2020 by guest
http://msphere.asm.org/
Lab B also detected the presence of HPV18 sequence in every spiked sample, which served as a cellular control, since HPV18 is integrated within the HeLa cell line. The number of HPV18 reads remained relatively stable and ranged from 1,131 to 3,800 reads and is a good confirmation that each matrix contained approximately the same number of HeLa cells (1 million cells).
(iii) Effect of freeze-thawing.Lab B also compared background matrix effect due
to freeze-thawing of the cellular matrix. The three freeze-thawing cycles of the cells prior to the viral spikes creates a cell lysate where most cells within the sample are already lysed prior to sample preparation. This represents a background matrix that contains the largest amount of host nucleic acid. Surprisingly, there was very little change in the detection sensitivity for all viruses except for REO1, which was detected at three copies per cell in the matrix where the cells were not lysed. This suggests that the impact of the number of freeze-thaw cycles a sample might have undergone prior to processing is relatively minor and that most nucleic acids are released by the sample preparation steps.
(iv) Summary.The results obtained with lab B’s pipeline indicated that the
sensi-tivity of detection for the viruses was at or near three virus copies per cell, with the large double-stranded (ds) DNA EBV showing the best sensitivity and the dsRNA REO1 showing the poorest sensitivity. The poor detection of REO1 was most probably due to the lack of optimization of the extraction pipeline for dsRNA, which might be less efficient for converting dsRNA into dsDNA.
HTS results of lab C.Lab C generated one type of sample, i.e., viruses spiked into whole cells, but extracted DNA and RNA separately to generate two sample types for testing in the HTS workflow. All viruses were detected at all three spiking levels tested. Depending on the level of the spike, the coverage ranged from 33.6% to 100% for EBV and 6.3% to 100% for the RNA viruses, while the number of reads ranged from 730 to almost 1.2 million reads for EBV and 400,000 to almost 4.5 million for the RNA viruses (Tables 8 and 9, respectively). A good correlation between the number of reads and the concentration of the spikes was also observed. More details are given for each indi-vidual virus in the following paragraphs according to the nucleic acid preparation method.
(i) DNA. As expected, a large number of reads were mapped to EBV’s genome
resulting in coverage of 100 and 99.6% for the high and medium spike level, respec-tively (Table 8). The percentage of genome covered was lower (33.6%) for the low concentration spike as a consequence of the lower number of reads mapping to EBV’s genome (730 reads).
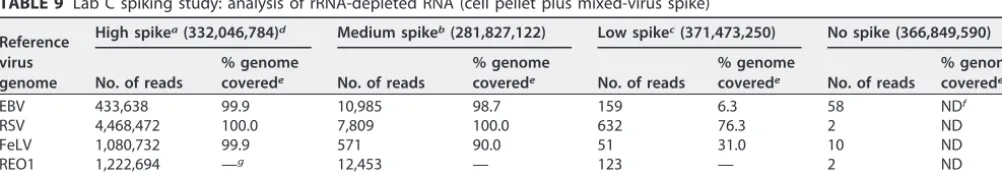
(ii) RNA.The sample was further processed to reduce cellular sequences by rRNA
depletion and then converted into double-stranded cDNA. As described in the follow-ing sections, the three RNA viruses behaved differently in lab C’s workflow. RSV was better detected regardless of its concentration, while FeLV and REO1 showed discrep-ancies and a significant drop in the number of reads mapping to their genomes at
TABLE 7 Lab B spiking study: analysis of mixed virus spiked into whole cells
Reference virus genome
High spikea(232,970,834)d Medium spikeb(302,019,632) Low spikec(241,566,632)
No. of reads
% genome
coverede No. of reads
% genome
coverede No. of reads
% genome coverede
EBV 4,310,100 79.6 1,176,557 84.3 20,892 74.8
RSV 8,255 97.6 3,325 94.7 35 11.1
FeLV 165 47.1 12 10.4 0 0.0
REO1 56 9.5 13 2.9 0 0.0
HPV18 1,516 52.8 3,800 64.4 2,709 65.5
aHigh spike, 100 copies per cell. bMedium spike, 3 copies per cell. cLow spike, 0.1 copy per cell.
dThe total number of reads is shown in parentheses. ePercentage of viral genome covered by the mapped reads.
on September 8, 2020 by guest
http://msphere.asm.org/
lower spike concentrations. RSV was detected at 0.1 viral genome copies per cell with 632 reads mapping to RSV’s genome, resulting in a coverage of 76.3% (Table 9). This suggests that the sensitivity of detection for EBV and RSV might be equivalent using lab
B and lab C pipelines (i.e., extrapolated to be 0.005 copies per cell with ⬃30 to 35
reads). At higher spike concentrations, 100% of the genome was covered due to the larger number of reads mapping to RSV’s genome (almost 4.5 million for the 100 viral genome copies and 7,800 for the 3 viral genome copies per cell). As shown in Table 9, FeLV was detected at all genome copy concentrations, with a coverage ranging from 31% for the low spike concentration to 99% for the high spike concentration, with the medium spike concentration characterized by 90% of the genome covered. The num-ber of reads mapping to the FeLV genome was lower than that obtained for RSV, and as a consequence, the sensitivity of detection for FeLV using lab C’s pipeline is likely not more than 0.1 viral genome copies per cell.
EBV was also detected in the cDNA samples, indicating that genomic DNA was coextracted with total RNA (Table 9). Although the total number of reads mapping to EBV’s genome was lower in the cDNA samples (approximately threefold) compared with the DNA sample (Table 8), the percent genome covered was 6.3% for the low spike concentration sample and more than 98% for the medium and high spike concentra-tion samples.
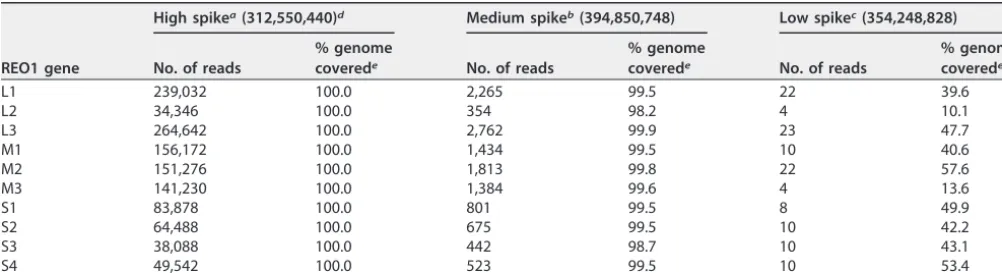
REO1 has a segmented genome composed of 10 segments ranging in size from 1.1 to 3.9 kbp. All segments were detected at all concentrations, and the percentage gene coverage ranged from 10 to 50 at the low concentration, depending on the segment, to more than 98 for the medium concentration and 100 for the high concentration (Table 10).
TABLE 8 Lab C spiking study: analysis of DNA (cell pellet plus mixed-virus spike)
Reference virus genome
High spikea
(312,550,440)d
Medium spikeb
(394,850,748)
Low spikec
(354,248,828)
No spike (220,064,594)
No. of reads
% genome
coverede No. of reads
% genome
coverede No. of reads
% genome
coverede No. of reads
% genome coverede
EBV 1,195,993 100.0 23,931 99.6 730 33.6 0 0
RSV 0 0.0 2 1.3 0 0.0 0 0
FeLV 2 2.2 0 0.0 0 0.0 0 0
REO1 2 NDf 0 0.0 4 ND 0 0
HPV18 1,762 66.7 2,765 64.4 2,709 65.5 1,527 66.7
aHigh spike, 100 copies per cell. bMedium spike, 3 copies per cell. cLow spike, 0.1 copy per cell.
dThe total read number is shown in parentheses. ePercentage of viral genome covered by the mapped reads. fND, not determined because reads map to different segments.
TABLE 9 Lab C spiking study: analysis of rRNA-depleted RNA (cell pellet plus mixed-virus spike)
Reference virus genome
High spikea(332,046,784)d Medium spikeb(281,827,122) Low spikec(371,473,250) No spike (366,849,590)
No. of reads
% genome
coverede No. of reads
% genome
coverede No. of reads
% genome
coverede No. of reads
% genome coverede
EBV 433,638 99.9 10,985 98.7 159 6.3 58 NDf
RSV 4,468,472 100.0 7,809 100.0 632 76.3 2 ND
FeLV 1,080,732 99.9 571 90.0 51 31.0 10 ND
REO1 1,222,694 —g 12,453 — 123 — 2 ND
HPV18 842,420 66.7 173,739 66.7 381,291 66.7 341,199 66.7
aHigh spike, 100 copies per cell. bMedium spike, 3 copies per cell. cLow spike, 0.1 copy per cell.
dThe total read number is shown in parentheses. ePercentage of viral genome covered by the mapped reads. fND, not determined.
g—, see Table 10 for percent genome coverage of each REO1 segment.
on September 8, 2020 by guest
http://msphere.asm.org/
There was no correlation between the size or GC content and the number of reads or percent gene covered (data not shown). The sensitivity of detection for REO1 using lab C’s pipeline is likely not lower than 0.1 viral genome copies per cell based upon the results of the individual genes. The total number of reads mapping to the REO1 genome is higher than that observed for FeLV, suggesting that the sensitivity of detection of REO1 might be better than for FeLV.
The identities of the four viruses were confirmed by sequencing their genomes in an independent sequencing run (data not shown). Nonspiked HeLa cells were also se-quenced. As shown in Tables 8 and 9, no reads mapped to the genomes of the viruses in the genomic DNA (gDNA) from nonspiked cells, while a few reads were detected in the cDNA sample. Few reads also mapped to RNA viruses in the gDNA from spiked samples, suggesting some carryover of replication DNA intermediates of the spiked viruses and/or limited cross-contamination between samples.
(iii) Evaluation of DNA and RNA workflows.It was noted that there were
discrep-ancies in the number of reads mapping to HPV18 in the cDNA workflow for the different samples (between 2.5- and 4-fold after correction to take into account the different numbers of total reads generated in each run), while this number was similar in the gDNA workflow (maximum difference is less than 1.2-fold). Additionally, while millions of reads mapping to the genomes of RNA viruses were identified for the high spike concentration sample, lower than expected numbers are observed for the two other samples, suggesting that the efficiency of the reverse transcription step has an impact on the output. For instance, there is a greater number of reads generated for RSV (between 4-fold and more than 10-fold) than for FeLV (that has a genome that is only half the size of RSV’s genome). The same difference is observed with REO1, which has a double-stranded genome almost three times larger than FeLV. While more than one million reads mapped to FeLV and REO genomes in the high spike concentration sample, 20 times more reads were mapped to the REO1 genome than to the FeLV genome in the medium spike concentration sample. Similar discrepancies were ob-served when samples were assayed by quantitative PCR (qPCR) (data not shown). In addition, a critical step in using HTS for RNA analysis is to reduce the proportion of rRNA, which composes more than 90% of total RNA. Adding an rRNA depletion step drastically decreases the number of reads mapping to rRNA and consequently increases the proportion of reads mapping to mRNA and viral genomic RNA, as evidenced by the difference in the number of reads mapping to RNA viruses between lab B and lab C’s workflows.
(iv) Summary.Taken together, the results obtained with lab C’s pipeline indicates
that all viruses can be detected at all concentrations and that differences in the topology of the RNA viruses has less impact on the HTS output than lab B’s pipeline.
TABLE 10 Lab C spiking study: analysis of REO1 genes in rRNA-depleted samples (cell pellet plus mixed-virus spike)
REO1 gene
High spikea(312,550,440)d Medium spikeb(394,850,748) Low spikec(354,248,828)
No. of reads
% genome
coverede No. of reads
% genome
coverede No. of reads
% genome coverede
L1 239,032 100.0 2,265 99.5 22 39.6
L2 34,346 100.0 354 98.2 4 10.1
L3 264,642 100.0 2,762 99.9 23 47.7
M1 156,172 100.0 1,434 99.5 10 40.6
M2 151,276 100.0 1,813 99.8 22 57.6
M3 141,230 100.0 1,384 99.6 4 13.6
S1 83,878 100.0 801 99.5 8 49.9
S2 64,488 100.0 675 99.5 10 42.2
S3 38,088 100.0 442 98.7 10 43.1
S4 49,542 100.0 523 99.5 10 53.4
aHigh spike, 100 copies per cell. bMedium spike, 3 copies per cell. cLow spike, 0.1 copy per cell.
dThe total read number is shown in parentheses. ePercentage of viral genome covered by the mapped reads.
on September 8, 2020 by guest
http://msphere.asm.org/
Lab C’s results also demonstrate that DNA viruses will likely be easier to detect than RNA viruses and that RNA extraction and/or reverse transcription protocols should be improved to increase the sensitivity of the HTS pipelines.
DISCUSSION
The safety of vaccines and other biological products is a critical goal for industry and regulatory agencies. To achieve this, extensive and sometimes redundant testing is
performed using variousin vitroandin vivoassays (7). The assays currently used for
demonstrating product safety have been generally effective in mitigating the risk of adventitious virus introduction during manufacturing, thereby enhancing confidence in their use for human health. However, some recent incidences of virus detection in biological materials have highlighted the limitations of the assays and the need for considering new virus detection technologies (12). With the recent emergence of advanced broad virus detection technologies (1), such as high-throughput sequencing platforms, there is a new generation of powerful tools for the detection and charac-terization of nucleic acids, with higher throughput and no need for prior sequence knowledge. Although HTS is recognized as a powerful tool for detection of known and novel viruses that can potentially enhance safety of biologics, regulatory applications of the technology need method standardization to evaluate the performance of these technologies for detection of adventitious agents.
The aim of the present study was to evaluate independent high-throughput work-flows, including sample and library preparation, sequencing methodologies, and bioin-formatic pipelines for their capacity to detect four or five viruses belonging to different virus families with distinct structural features, including nucleic acid composition and topology, as well as capsid/envelope conformation. Such selection criteria are similar to those used in other virus spiking studies performed to evaluate clearance by the manufacturing process for product safety (13). Although the three participating groups used different extraction techniques and sequencing platforms, the sensitivities of virus detection were very similar between the three participating groups (summarized in Table S3 in the supplemental material).
Unexpectedly, all three pipelines were able to detect all tested viruses in complex cellular matrices but with some differences in the sensitivity of detection, which highlighted the importance of improving several stages of sample preparation and processing. The results from all three labs showed similar trends for the viruses detected. EBV was readily detected by all three labs. EBV is a relatively large (172-kb), enveloped, double-stranded DNA virus that belongs to the herpesvirus family. With its large genome size, it was not surprising that EBV showed potential for sensitivity better than 0.1 copies per cell. In fact, using lab C’s pipeline, the sensitivity of EBV detection can be extrapolated as low as 0.005 copies per cell (with about 30 to 35 reads). The greater sensitivity for the EBV genome may also reflect the absence of the need for reverse transcription and cDNA synthesis processes, which are needed for RNA viral genomes.
For RSV and FeLV, all three labs’ pipelines resulted in a higher number of reads detected for RSV than for FeLV. This was unexpected, as the number of genomes spiked in was identical for RSV and FeLV, and both viruses are enveloped and contain a single-stranded RNA genome of relatively similar size (about 9 kbp for FeLV and 15 kbp for RSV). This result potentially indicates that factors aside from genome size and genomic structure could also influence the sensitivity of detection by HTS. Perhaps the difference might be sequence dependent and due to secondary RNA structures result-ing in inefficient reverse transcription and cDNA synthesis.
REO1 was detected in the RNA analysis from both lab A and lab C with limits
between ⬃1 and 0.1 copies per cell. However, for lab B, whose pipeline was not
optimized for specific viruses (see discussion below), REO1 was detected only at three copies per cell in the cell substrate background. It should be noted that for double-stranded RNA viruses, the RNA denaturation temperatures recommended in some of the cDNA synthesis kits may not be sufficiently high to denature the double-strand RNA
on September 8, 2020 by guest
http://msphere.asm.org/
and allow primer and enzyme binding, thus affecting virus detection. The results from lab A and lab C suggest that the enrichment of RNA (by either nuclease digestion of host DNA or rRNA depletion) enhances the sensitivity of detecting dsRNA viruses such as REO1.
PCV1 was included in testing by lab A. Although it was not detected in the nucleic acid spiked sample, the virus was detected with almost full genome coverage in the virus spiked samples, single or mixed, at one copy per cell.
Sensitivity of HTS without enrichment steps.Lab B’s sample preparation method
was a nonspecialized pipeline that can capture both DNA and RNA viruses. This was designed to preserve the broadest specificity but at the expense of higher sensitivity of specialized sample preparation methods. Enrichment steps can be an issue when some viruses are not polyadenylated or if they share similarity with rRNA sequences. To keep sample manipulation to a minimum, lab B extracted both DNA and RNA molecules together as one fraction with no further nuclease digestion or ribosomal depletion. In addition, no nuclease treatment was employed to remove any host nucleic acid, and only a short, low-speed centrifugation was used to treat the sample. Thus, lab B’s sample preparation, compared to sample preparation methods used in labs A and C, represents an extraction technique that potentially contains a higher level of host nucleic acids impacting the viral sequence recovery.
The viruses used for this spiking study have an almost 1-to-1 ratio of genome equivalence to viral particles, indicating that there are very few nonencapsidated viral genomes. In less-purified samples, there might be 10 to 100 viral sequences per viral particle, leading to a bias in the detection where the majority of the detected viral sequences resulted from naked nucleic acids and not the actual viral particles. As there are very few naked nucleic acids, lab B’s extraction technique starts with a number of viral genomes that is similar to those used by labs A and C. In combination with the higher level of background nucleic acids, lab B’s sample preparation can be considered the baseline sensitivity achievable by HTS for viral adventitious agent detection.
As demonstrated by lab A and lab C, additional steps for viral extraction by separating the DNA and RNA fraction and the implementation of rRNA depletion and nuclease treatment can potentially enhance the signal-to-background ratio.
Cell lysate versus cell substrate background matrix.As lab B’s sample
prepara-tion method can be considered a baseline for HTS sensitivity for viral detecprepara-tion, it was used to evaluate how different background matrices might influence the sensitivity of viral detection by HTS. Surprisingly, the sensitivity of the cell lysate matrix, mimicking a crude viral harvest, and that of a cell substrate background, mimicking a cell bank sample, were very similar. While the number of reads differs, most viruses were detected at similar levels with the exception of REO1. For REO1, no reads were detected at the medium spike level (three copies per cell) in the cell lysate matrix, whereas 13 reads were observed in the cell substrate background. It should be noted that only 31 REO1 reads were observed for the high spike level (100 copies per cell) in the cell lysate matrix. Given the 30-fold dilution between the high and medium spike, not observing any reads in the medium spike could be a statistical artifact (three expected not being much different from zero observed).
Integrated HPV18 sequence in HeLa cells as an internal reference.The HeLa cell
line, a cervical carcinoma cell line, contains multiple partial copies of HPV18 DNA that have been integrated into the genome (14, 15). HPV18 viral sequence was detected by all three labs and acted as internal reference both within and between labs. For DNA sequencing runs, the number of reads and genome coverage for HPV18 were consis-tent within each laboratory. This served as a good indicator that each sample started with a similar number of HeLa cells in the matrix. For data between labs, lab B and lab C both used the Illumina sequencing platform, and their data showed high agreement in the number of HeLa cell reads, confirming the consistency of the material used between the labs. Lab A used the Roche 454 technology; extrapolating their results based on the total number of reads showed that lab A’s HeLa cell data are also similar
on September 8, 2020 by guest
http://msphere.asm.org/
to those of lab B and lab C. All three labs showed similar genome coverage values ranging from 40% to 70% for the recovered HPV18 signal.
For future multicenter spiking studies, the use of an integrated viral sequence should be considered, as it would represent an additional checkpoint and potentially allow for standardization between laboratories. Inclusion of such sequence could also be used to monitor and assess sample processes (e.g., nuclease treatment to remove host DNA) as well as the expected (and predictable) identification by the bioinformatic analysis.
Ribosomal depletion.When working with cell substrates, cellular rRNA will
consti-tute the vast majority of the reads generated in an HTS run. Highly abundant rRNA can be removed from total RNA by enriching for polyadenylated [poly(A)] RNA transcripts (option tested by lab A), by depleting rRNA through hybridization capture (option tested by lab C), or by enzymatic degradation by duplex-specific nuclease (DSN) of abundant sequences that reanneal quickly (16). The use of DSN was not evaluated because the efficiency of this method has already been reported to be low (17). Since not all viral transcripts have a poly(A) tail, depleting rRNA through enrichment for poly(A) RNA might result in missing some adventitious RNA viruses and was therefore not considered by lab C. Selective hybridization capture of rRNA was shown to be inefficient in capturing the viruses used for spiking in this study (data not shown) and was therefore used to deplete rRNA. This study shows that workflows in which depletion of rRNA is included will allow detection of RNA viruses with a higher sensitivity than workflows in which total RNA is used.
HTS comparison with other virus detection methods. A major challenge in
implementing HTS for the detection of adventitious agents in biologics is to understand how HTS technologies perform compared with other methods currently in use. This is
difficult since the general virus detection assays, such asin vitro(infection of specific cell
lines) andin vivo(infection of host animals) models are compendial tests that have not
been characterized for sensitivity of virus detection. However, recently, studies were
undertaken to obtain data for comparing virus detection in thein vitroand in vivo
assays (18). Other broad virus detection assays have also been evaluated for virus detection such as microarrays and broad-range PCR-electrospray ionization mass spec-trometry (PCR/ESI-MS) (19). To date, qPCR stands as a gold standard technique for sensitive detection of known adventitious viruses mainly because of its specificity and sensitivity, and the use of PCR-based assays can be seen as a preferred alternative to current methods that have shown their limitations, that need improvements, or that need to be replaced in light of the 3R policy aiming at replacing, refining, or reducing the use of animal models (5, 18, 20). Nevertheless, the need for specificity is also the main drawback of qPCR. Indeed, new virus strains and genomic variants are continually identified (21, 22), reflecting the need to continually mine sequence databases to update qPCR assays targeting adventitious agents and precluding the use of universal primer/probe designs. While the genetic sequence of the target has to be known to develop a qPCR assay, HTS workflows detect and identify any DNA molecule regardless of its intrinsic sequence (23, 24).
Due to their throughput, HTS technologies also easily allow detection of multiple targets in multiple samples at the same time, while qPCR requires developing multiple assays that should not self-interfere if they are to be multiplexed or that result in as many runs as assays. In this study, five viruses with contrasting genome topologies described in Table S4 (including double/single stranded, RNA/DNA, segmented/linear/ circular, and sizes from 1.1 kb for small segments of REO1 to 170 kb for EBV) could be readily detected, singly or mixed, and the percentage of genome covered could be determined, while several virus-specific qPCR assays would have been necessary to detect and confirm the viruses individually. This has also been evidenced in another collaborative study led by the National Institute for Biological Standards and Control (NIBSC) in which a pool of 25 viruses was analyzed using different HTS workflows, which for some of them, detected all 25 viruses, while as many qPCR assays were needed to
on September 8, 2020 by guest
http://msphere.asm.org/
achieve less information on the virus pool since some of the qPCR assays were not successful (25, 26).
Even if HTS detection/identification capacity outperforms qPCR, few studies have addressed how HTS performs in terms of sensitivity compared with other molecular techniques and qPCR in particular. The sensitivity of an analytical method is commonly characterized by the concentration, known as the limit of detection (LOD), that can be detected with a high (most often 95%) probability. Theoretically, the lowest LOD of PCR has been determined as three copies per reaction (27). This holds true if the qPCR assay has an efficiency of 100% (i.e., each PCR cycle produces exactly two copies of the DNA template) and targets a single-copy gene, in addition to the assumption of a Poisson distribution and a 95% chance of pipetting at least one copy in the PCR (27). Never-theless, qPCR assays most often have lower efficiencies (because of poor primer/probe design and reagent shortage as the reaction progresses over time) and the lowest LOD is rarely met (28, 29). Moreover, the overlooked topology of the DNA template also has an impact on the efficiency of the qPCR, and the same target in different topological environments can result in divergent qPCR outputs (30, 31). Since HTS workflows rely on fragmented DNA molecules as the template and a limited number of amplification cycles, these constraints likely have less impact on the HTS outcome.
Several reports indicate that HTS can be a method combining sensitivity with the ability to identify known and unknown viruses. For instance, Greninger and coworkers (32) showed that HTS could detect influenza A virus H1N1 titer near the detection limit of a specific RT-PCR assay under conditions where a DNase treatment was included
prior to extraction of nasopharyngeal swab samples containing between 105to 109
viral particles per ml. In their evaluation of the performance of HTS in detecting viruses, using MRC-5 cells spiked with various concentrations of viruses near the LOD of validated RT-qPCR, Cheval and coworkers (33) showed that the sensitivity of HTS is near those of qPCR-based assays. In their work, Cheval and coworkers also compared the earlier 454 Roche sequencing technology with Illumina’s genome analyzer II (GAII) and
showed that, although fewer than 107reads were generated by the GAII, producing
more reads increased the sensitivity of the HTS workflow. Additionally, Wylie et al. (34) showed by comparing the viromes of febrile and afebrile children that HTS can possibly reach a sensitivity comparable with that of qPCR (especially for mastadenoviruses, roseoloviruses, and enteroviruses), but that depending on the virus family (polyoma-viruses and boca(polyoma-viruses), optimization of the HTS workflow was required. Of note, this study generated small numbers of reads (between fewer than 3 million reads and 50 million reads, while nowadays more than 300 million reads can be obtained routinely) and suggested that there was a correlation between the number of reads generated and the probability of finding reads mapping to the targeted viruses (34). In another study, Prachayangprecha and colleagues (35) compared the outputs of a sequence-independent HTS approach and routinely used diagnostic RT-qPCR assays for the presence of respiratory viruses in nasopharyngeal aspirates from Thai children with respiratory disease. Prachayangprecha and colleagues concluded that HTS was at least as sensitive as diagnostic RT-qPCR for the detection of rhinovirus and human metap-neumovirus but that HTS was less sensitive toward bocavirus and enterovirus. This study was conducted using a 454-GS Junior instrument, which generated between more than 400 and fewer than 35,000 reads, depending on the sample, stressing once again the potential of HTS even when few reads are available. A clear asset of HTS is the capacity of this technology to detect truncated forms of viruses, which might occur during cell passages. Timm and colleagues demonstrated the added value of HTS in quantifying those defective particles in a population of vesicular stomatitis virus (a prototypical nonsegmented negative-sense RNA virus) that was cultured for three passages on BHK cells (36), highlighting the power of HTS in detecting genome variants that might escape qPCR-based assays. It was also suggested in this study that HTS can be more sensitive than other complementary techniques (i.e., RT-qPCR, transmission electron microscopy [TEM], and biological activity assay). Fischer and colleagues showed that in influenza virus-positive respiratory samples, there was a high correlation
on September 8, 2020 by guest
http://msphere.asm.org/
between HTS results (generated on a MiSeq or HiSeq 2000 instrument, with a maximum
number of reads of 3.5 or 45 million, respectively) and quantification cycles (Cq)
obtained with RT-qPCR, both reaching similar sensitivity but with HTS providing information about additional viral pathogens and bacterial species associated with superinfections in influenza patients (37). Finally, using a pool of 25 viruses prepared by the NIBSC, Li and coworkers (25) demonstrated that all viruses that were detected by
qPCR (i.e., withCqof⬍37) were detected by HTS and that four out of the six viruses that
were not detected by qPCR were identified by HTS. This was further corroborated in the collaborative study led by the NIBSC with the same virus pool, where some HTS workflows were able to detect and identify all the viruses present in the sample, even those that were not detected by qPCR (26). It is important to note that the virus pool was prepared on the basis of titers that were determined by qPCR before dilution and pooling of the 25 viruses (26), indicating that the absence of qPCR signal was not due to a problem of specificity but rather to a problem of sensitivity. Here, we did not specifically determine the limit of detection of HTS with regard to the detection of adventitious viruses. Although we showed that some HTS workflows are able to detect at least 1 virus genome (and likely less) in the equivalent of 10 host cell genomes, a specific experimental design needs to be set up to clarify what is the true performance of HTS, including considerations about enrichment strategies (38, 39) and impact of the metabolism of infected cells, in order to validate the use of HTS for adventitious agent testing of biologics and guide further investigations.
The advantages of HTS for unexpected or novel virus detection make this technol-ogy a promising tool for supplementing or perhaps even replacing some of the conventional virus detection assays. There are examples of discovering virus and other microbial agents in a variety of samples, including clinical, environmental, and biolog-ical samples. The most impactful was the discovery of PCV1 in a licensed rotavirus vaccine (40). This also highlighted the limitations of the currently used virus detection assays since PCV1 was not a novel virus and brought HTS into consideration by industry and regulatory agencies for further investigations of its applications in biologics. Additionally, a novel rhabdovirus was discovered in the Sf9 cell line that was not detected by extensive testing using conventional assays, although it was expressed at a high level (9). In the present study, we have shown similar levels of detection with two HTS technologies using four different virus types in different matrices representing different types of samples relevant to biologics (summarized in Table S3). The results using the same starting virus stocks in independently designed and conducted exper-iments support the idea that development of well-characterized reference virus mate-rials can facilitate standardization of HTS for applications in biologics.
MATERIALS AND METHODS
Viruses. Viruses with different physical and biochemical properties were selected to represent different types of virus families that could be a potential safety concern in biologics (see Table S4 in the supplemental material). Concentrated virus stocks were obtained from Advanced Biotechnologies Inc. (ABI) along with their certificate of analysis (COA). These virus stocks included the following: Epstein-Barr virus (EBV) type 1 (B95-8 strain) purified from induced B95-8 cell culture supernatant (catalogue number 10-115-000, lot number B0116); feline leukemia virus (FeLV) (Thielen strain) purified from culture supernatant of infected FL-74 cells (catalogue number 10-250-000, lot number 4G0016); human respi-ratory syncytial virus (RSV) subtype A (A2 strain) propagated in HEp-2 cells and purified from culture supernatant when cells showed cytopathic effect (catalogue number 10-247-000, lot number 6J0006-PV). A custom virus stock of human reovirus type 1 (REO1) (Lang strain) was prepared at ABI from infected LLC-MK2 cells from culture supernatant and cells showing cytopathic effect. These virus stocks were reported to be free of bacteria, yeasts, fungi, and mycoplasma. Porcine circovirus type 1 (PCV1) stock was prepared by one participating laboratory by several rounds of freeze-thawing of PK-15 cells plus supernatant (American Type Culture Collection [ATCC], Manassas, VA; catalogue number CCL-33), followed by low-speed clarification and filtration.
Virus characterization for HTS analysis included particle count and genome copy number. Informa-tion was included in the COA provided by ABI or obtained through commercial testing services. Additionally, in some cases, the infectious titer was available for virus stocks from ABI (Table S5).
Virus genome copy number was determined by Norgen Biotek Corp. (Ontario, Canada). Virus stock mixed with lysis buffer was sent to Norgen for RNA or DNA extraction and reverse transcription-quantitative PCR (RT-qPCR) using SYBR green I. For accurate determination of encapsidated virus
on September 8, 2020 by guest
http://msphere.asm.org/
genomes in the PCV1 virus stock, virus was treated with DNase I (catalogue number 89835; Pierce, Milwaukee, WI) at 37°C for 1 h, followed by heat inactivation at 65°C for 10 min prior to ultracentrifu-gation (Optima RL ultracentrifuge, TLA 45 rotor; Beckman, Palo Alto, CA) at 45,000 rpm for 3 h at 4°C. The pellet was resuspended and sent to Norgen for virus nucleic acid extraction (19) and genome copy number determination.
Cells.The HeLa cell line was purchased from ATCC (catalogue number CCL-2) by each laboratory for independent preparation of cellular background matrices for virus spiking. The cells were grown and propagated under conditions described by the ATCC. The reagents used were obtained from a common source; Eagle’s minimum essential medium (EMEM) was obtained from ATCC (catalogue number 30-2003, lot number 60143948), and TrypLE Select (no phenol red trypsin) was obtained from Invitrogen (Life Technologies; catalogue number 12563-011, lot number 1372288). Fetal bovine serum (FBS) used by lab A was obtained from HyClone (defined, irradiated; catalogue number SH30070.03IR, lot number AXH44990) and heat inactivated (56°C, 30 min) prior to use; complete medium was prepared without filtration, using sterile handling precautions. FBS (catalogue number 1500; Seradigm, Radnor, PA) (lot number 174A10) was used by lab B for growing cells through four passages, with cells washed twice at each passage with Dulbecco’s phosphate-buffered saline (DPBS) (catalogue number 14190; Gibco/ Thermo Fisher Scientific) (lot numbers 1393824 and 1509700). FBS used by lab C was obtained from HyClone (lot number AYD62677). The cells were passaged twice a week for 10 passages. At each passage, the cells were washed with Dulbecco’s phosphate-buffered saline (Lonza lot numbers 3MB107 and 3MB207).
(i) Lab A.A HeLa cell bank was prepared for the spiking study. Total RNA was prepared from cell pellets stored at⫺80°C using the Qiagen RNeasy Midiprep kit (catalogue number 75142). RNA was eluted in ultrapure, DNase/RNase-free distilled water (dH2O), quantified using a NanoDrop spectrophotometer,
and analyzed on a 1.2% formaldehyde agarose gel, which showed intact 18S and 28S rRNAs. Aliquots were made containing 75g of RNA in a total volume of 80l and stored until use. Cell lysate was prepared by six freeze-thaw cycles of cells that were stored in conditioned medium at 1⫻106cells per
ml per tube.
(ii) Lab B.A suspension of HeLa cells was prepared for spiking with viruses. The cells were washed once in EMEM (ATCC lot number 61222862) and resuspended in medium (without serum) at a final concentration of 5⫻106per ml. The cell suspensions underwent no freeze-thawing to obtain cell lysate,
prior to spiking with model viruses. For the latter, the samples underwent three freeze and thaw cycles, 3 min each, in a dry ice/ethanol bath, followed by 3 min in a 37°C water bath. Cell aliquots (200l containing 1⫻106cells) were spiked with virus dilutions prepared in EMEM to achieve a final dilution
of 0.1, 3, or 100 genome copies per cell in a total volume of 400l. All samples were stored at⫺60°C or lower prior to total nucleic acid extraction.
(iii) Lab C.After growth, HeLa cells were collected in EMEM with FBS (10%) and centrifuged for 10 min, and the resulting pellet was resuspended in phosphate-buffered saline (PBS) before counting using trypan blue exclusion. The cell concentration was adjusted to 2 ⫻ 106 cells per ml before
centrifugation at 300⫻gto remove the PBS and storage of the cell pellet (2⫻106cells) at⫺80°C.
Preparation of spiked samples.The preparation of spiked samples was done individually by each laboratory.
(i) Lab A.For HTS studies, single-virus and mixed-virus spiked samples were prepared. Two types of single-virus spiked samples were created. (i) Extracted viral nucleic acid (7.5⫻106genome copies) was
added directly into HeLa cell RNA (7.5⫻106cell equivalents; 75g) so that the final sample contained
1 viral genome copy per cell equivalent. All samples were brought to a volume of 100 l with RNase/DNase-free dH2O. (ii) Samples were prepared by adding intact viral particles into clarified cell
lysate (1⫻ 106cell equivalents in 1 ml) to mimic an infection of one virus genome copy per cell.
Therefore, the number of virus particles used for spiking was 1⫻106, except in the case of FeLV, where
half the number of particles were used since retroviruses contain two genome copies per virion. PCV1 was also included in the study to evaluate detection of a virus with high resistance to inactivation (13). The number of particles used for spiking was based upon the total particle count determined by transmission electron microscopy (TEM) except in the case of PCV1 where genome copy equivalent was used based upon one genome copy per particle, since TEM results could not be obtained, as the virus tends to form aggregates. Based upon the ratio of total particles and genome copy numbers (Table S5), the calculated genome copy numbers used for spiking were 1.0 for RSV, 0.78 for EBV, 1.26 for FeLV, 0.71 for REO, and 1.0 for PCV1.
Mixed-virus spiked sample was prepared containing all five viruses by adding 1⫻106virus particles
of EBV, RSV, REO, and PCV1 (genome copy equivalent), and 0.5⫻106virus particles of FeLV in 1⫻106cell
equivalents of HeLa cell lysate so that a final one viral genome copy per cell was obtained.
(ii) Lab B.Mixed-virus spiked samples were prepared by adding the appropriate number of viral genomes (based on genome copy number) at 0.1, 3, and 100 genome copies of each virus per cell. All four viruses (EBV, RSV, REO, and FeLV) were added together to create one sample at each spike level, and the volume was brought to 0.4 ml with cell culture medium prior to nucleic acid extraction. In addition, lab B also explored the effect of freeze-thawing the test sample on the performance of HTS: one sample was created by spiking the viruses directly into a cell lysate, which was generated by freeze-thawing three times, and a second sample was generated by freeze-thawing cells that were spiked with virus prior to preparation of the lysate.
(iii) Lab C.Mixed-virus spiked samples were prepared by mixing HeLa cell pellets (2⫻106cells) with
four viruses (EBV, RSV, REO and FeLV). All of the viruses were added together at the same concentration,