1535-9778/06/$08.00⫹0 doi:10.1128/EC.5.4.650–657.2006
Copyright © 2006, American Society for Microbiology. All Rights Reserved.
Low Genetic Variation and No Detectable Population Structure in
Aspergillus fumigatus
Compared to Closely Related
Neosartorya
Species†
Carla Rydholm,
1* George Szakacs,
2and Franc¸ois Lutzoni
1Department of Biology, Duke University, Durham, North Carolina 27708,1and Technical University of Budapest, Budapest, Hungary2
Received 11 August 2005/Accepted 7 February 2006
Aspergillus fumigatusis an anamorphic euascomycete mold with a ubiquitous presence worldwide. Despite
intensive work to understand its success as a pathogen infecting immunosuppressed patients, the population dynamics and recent evolutionary history of A. fumigatus remain understudied. We examined patterns of genetic variation at three intergenic loci for 70 natural isolates from Europe, North America, South America, Asia, Africa, and Australia. The same loci were used to analyze within-population genetic variation for 33 isolates obtained from five geographic locations. Neither data set detected evidence of population differenti-ation or found any associdifferenti-ation between the genetic and geographic distances among these isolates. No evidence for genetic differentiation within the twoA. fumigatusmating types was detected. The genetic diversity ofA.
fumigatus, contrasted with that of its close teleomorphic relatives,Neosartorya fischeriandNeosartorya spinosa,
is remarkably low.
Population genetic studies of fungal species have held ap-plied and theoretical interest since the first mycological appli-cation of molecular markers by Spieth in 1975 (51) and are now established as a vital component to accurate and complete understanding of a species’ biology. With such data, global population structure, intraspecific genetic differentiation, and genetic diversity may be estimated. We applied a population genetic approach to study patterns of genetic variation in the cosmopolitan haploid moldAspergillus fumigatus. The primary focus was to gauge patterns of genotypic diversity and differ-entiation at global and local scales.
A. fumigatus is a euascomycete (Pezizomycotina) species of the orderEurotiales for which no sexual reproduction struc-tures have yet been observed. It is abundant in soil rich with organic materials and upon decaying vegetation undergoing aerobic decomposition (54). It is a cosmopolitan species but is more commonly reported from the air column in the central latitudes of the Northern Hemisphere (23). Most research on
A. fumigatushas focused on the molecular basis for its success as a common airborne fungus isolated clinically (2). Genotyp-ing efforts (for a review, see reference 56) characterizGenotyp-ing pathogenic strains have found clinical isolates to be generally indistinguishable from strains obtained from the hospital and external environment. The majority of these data sets were isozyme and arbitrary PCR product profiles. When evaluated for evidence of an exclusively clonal reproductive mode, the majority of analyses detected patterns consistent with historical recombination (37, 41, 56).
For our population genetic survey ofA. fumigatus, we sam-pled at two spatial scales. A global sampling of strains was made from across the breadth of the species’ geographic range. A second set ofA. fumigatusstrains was isolated from soil at
three North American and two European sites. The latter sampling was done to address the intraspecific distribution of genetic variation for environmental isolates ofA. fumigatus. The genetic markers used for both data sets were three nuclear intergenic regions. The intergenic regions were used instead of coding regions to maximize polymorphic sites within a locus; in coding regions, variation is usually limited to third-base posi-tions.
Our evaluations of the population genetic parameter values estimated forA. fumigatusare made with consideration given to an interspecific comparison with its close relatives Neosar-torya fischeri and Neosartorya spinosa. These species have a different generic name owing to the mycological tradition of confining species for which a sexual state is known (teleo-morphs) to separate taxonomic groups from the species with-out a known sexual state (anamorphs; also referred to as mi-tosporic fungi). Recent phylogenetic work on the form genus
Aspergillusthat included most anamorphicAspergillusspecies and the associated taxa with known sexual states infers thatA. fumigatus,N. fischeri, andN. spinosaare part of theAspergillus
subgenusFumigatisubgroupFumigati(38). The subgroup has a total of 24 species (58). Phylogenetic studies find the two speciesA. fumigatusandN. fischerito be sister taxa with good branch support (15, 58). These two taxa are a potential exam-ple of the species pair concept predicted for fungi (5, 6, 14, 24). The species pair hypothesis suggests that strictly or predomi-nantly asexual species emerge from sexual lineages that have adapted to selective forces in a given environment (27, 31). Knowledge of the evolutionary history associated with both lineages may inform our understanding of the emergence ofA. fumigatusas a species.
TheA. fumigatusmultilocus sequence data obtained for this study were also analyzed within the context of mating compat-ibility groups. Regulatory regions, termed mating-type loci, control sexual compatibility between individuals and their ini-tiation into the sexual cycle. Characterization of mating-type loci has proved crucial to understanding mating, pathogenicity,
* Corresponding author. Mailing address: Biology Department, Duke University, Box 90338, Durham, NC 27708. Phone: (919) 660-7382. Fax: (919) 660-7285. E-mail: [email protected].
† Supplemental material for this article may be found at http://ec .asm.org/.
650
on September 8, 2020 by guest
http://ec.asm.org/
and global population dynamics of common fungi (1, 7, 26, 29, 33, 43). Two versions of the mating-type locus exist (referred to in Aspergillusas MAT1-1 and MAT1-2) in most ascomycete fungi (55, 61). They have little or no sequence similarity (16), and both are required for a successful mating. Fungi can be either homothallic, where both mating types are present within an individual, or heterothallic, where only one mating type is present in an individual. These loci have recently been char-acterized forA. fumigatus(37, 39, 57). Each strain carries only a single mating-type locus, either MAT1-1 or MAT1-2, and thus appears to have a heterothallic mating system architec-ture. A broad survey of environmental and clinically isolated strains finds no significant difference in abundance of the two mating types and provides evidence of their co-occurrence within individual patients and environmental samples (37). The evolutionary history of strains of the two mating types could differ if sexual recombination is infrequent and/or if the fitness of the two types is different.
In this study we report an analysis of intraspecific DNA sequence variation in a global sample of 70 strains ofA. fu-migatus using three intergenic regions. These data are com-pared to values obtained from the same loci for six strains ofN. fischeriand five strains ofN. spinosa, homothallic species also belonging to the genusAspergillus, subgenusFumigati, section
Fumigati. In culture collections, isolations for both species have been recorded from soil, spoiled food, and skin of human patients from the Northern and Southern Hemispheres, as well as both sides of the Pacific and Atlantic Oceans. Of the two, onlyN. fischeriis reported as a species causing invasive infec-tion, with a long history of such records (54). Our purpose here was to relate the genetic diversity present inA. fumigatusto its close and sexually reproducing relatives as a context to inter-pret the estimates obtained. Loci were also analyzed for devi-ations from neutrality. The relative divergence times of the speciesA. fumigatus and N. fischeri were estimated. Further data for the three intergenic loci were collected for 33 A. fumigatusstrains isolated from five different geographic sites in North America and Europe. From this site-specific sampling, isolation by distance and distribution of genetic variation within the species were evaluated. The global and local surveys of A. fumigatus were pooled by mating types. Their genetic diversity and their mutation frequency spectra and deviation from neutrality were separately analyzed to evaluate genetic differentiation within the species correlated with mating com-patibility group. With these data and comparisons we sought to better define the population genetic patterns and evolutionary history ofA. fumigatus.
MATERIALS AND METHODS
Strains.Seventy strains ofA. fumigatusisolated from the environment were utilized in the global survey of this study (see Table S1 in the supplemental material). These strains were received from the mycological collections of the Technical University of Budapest, Martha Christensen at the University of Wyoming, or Maren Klich at the USDA Agriculture Research Service or were isolated for this study by C. Rydholm or G. Szakacs from soil samples. C. Rydholm also isolated strains used in the site-specific survey of multiple isolates from each of five locations from soil samples (see Table S1 in the supplemental material). Soil was collected from Finland, Germany, the territory of Nunavut in the Canadian Arctic, Northwestern Ontario, and North Carolina. Nine soil samples were collected from 10-by-10-m plots, with samples being taken 5 m apart in a grid formation. From each soil sample one single spore isolation was attempted. A total of 33 isolates were obtained for the site-specific sampling. Soil
was initially spread in serial dilution on MEA medium with antibiotics (12 g/liter malt extract, 20 g/liter agar, 90g/ml tetracycline) and incubated for 2 to 4 days at 37°C. Isolates were then streaked on MEA medium with Triton X-100 (12 g/liter malt extract, 20 g/liter agar, 1 ml/liter Triton X-100), incubated for 2 days, and transferred to another Triton X-100 plate; this was repeated four times.
Neosartorya fischeriandN. spinosastrains were obtained from the Centraalbureau voor Schimmelcultures (CBS) and Agricultural Research Service Culture Collection (NRRL) (see Table S1 in the supplemental material). One isolate from each of four
AspergillussubgenusFumigatispecies (N. aureola,N. pseudofischeri,N. spathulata, andN. stramenia) were used as outgroup taxa.
DNA isolation and sequencing.Genomic DNA was prepared from mycelium grown in liquid malt medium (12 g/liter). Lyophilized fragments were transferred with forceps to 1.5-ml tubes containing 500l of 1% sodium dodecyl sulfate extraction buffer. Mycelium was ground with a polypropylene micropestle and incubated at room temperature. DNA was purified with phenol-chloroform (1:1, vol/vol) as described by Raeder and Broda (42). Next, 300l of chloroform-isoamyl alcohol (24:1, vol/vol) was added, and the solution was emulsified and centrifuged for 15 min. The DNA was precipitated from the aqueous phase by the addition of an equal volume of cold isopropanol. The pellet was washed with 70% ethanol, and the DNA was resuspended in 50l water.
To infer the phylogenetic affinities of strains, the internal transcribed spacer region (ITS) and a portion of the-tubulin gene were amplified via PCR from genomic DNA. Oligonucleotide primers used to amplify ITS were ITS1 and ITS4 (60). Conditions used for PCR of ITS were according to Vilgalys and Hester (59). The primers used to amplify the-tubulin region were benA1 and benA2 (15). The PCR protocol used to amplify the-tubulin region was that of Geiser et al. (15).
Three nuclear intergenic loci were developed with the help of Fred Dietrich and Jason Stajich (Molecular Genetics and Microbiology Department, Duke University). A BLASTX search was done with the assembled contigs from the
Aspergillus fumigatusgenome project and the protein database ofSaccharomyces cerevisiae. From this search, genes that were closer than 1,000 bp apart inA. fumigatusbut not found together inS. cerevisiaewere targeted for primer design. The loci used in this study are the intergenic regions between the following gene pairs (as annotated inS. cerevisiae):inter1(found betweensec61andecm40on chromosome 5),inter2(found betweenyll034Canderb1on chromosome 1), and
inter3(found betweenglc3andatp2on chromosome 5). The three loci are unlinked. Primers used forinter1were secFa 5⬘GCGGTATGGTATCCTC CTTG 3⬘and ecmRb 5⬘CGATTTCAGCCACGAGTACG 3⬘. Primers used for
inter2were yllF 5⬘CTAATCCCTTGGAGCGTGTG 3⬘and erbRa 5⬘CGCTT GAGCCACATAACCTG 3⬘. Primers used forinter3were glcFa 5⬘GCTTCGG TCGTAATCTCAAGG 3⬘and atpRa 5⬘GCAGTTTCAAGGCCATCATC 3⬘. Amplification reactions were prepared for a 25-l final volume containing 1.25 l of 10 mM primer, 2.5 mg/ml bovine serum albumin (B9001S; New England Biolabs), 2.5l PCR buffer 10⫻with MgCl2, 2.5l deoxynucleoside triphos-phates, 0.125lTaqpolymerase, 13.875l sterile distilled water, and 1l of template genomic DNA. PCR was performed on Peltier Thermal Cycler PTC-200 (MJ Research) under the following conditions: one cycle of 1 min at 95°C linked to 25 cycles of 45 s at 95°C, 40 s at 52°C, and 2 min at 72°C, followed by 15 cycles of 45 s at 95°C, 40 s at 52°C, and 2 min at 72°C, with additional extension time of 5 s per cycle. Samples were held for a final 10 min at 72°C to complete primer extensions, after which the samples were kept at 4°C until electrophoresis was performed on a 1% agarose gel prepared with Tris-acetate-EDTA and stained with SyBr Green. Following PCR, the QIAGEN clean-up kit was used.
Sequencing reactions were performed in a 10-l final reaction volume as follows: 2l of Big Dye (Big Dye Terminator cycle sequencing kit, ABI PRISM; Perkin-Elmer, Applied Biosystems), 2l of Big Dye buffer, 1l of 10 mM primer, 3l of distilled water, and 2l of purified PCR product. Sequencing primers were the same as those used for PCR, and sequencing was performed on Peltier Thermal Cycler PTC-200 (MJ Research).
Inference of phylogenetic affinities and divergence.Two data sets were used to infer the evolutionary relationships between strains of the speciesA. fumigatus,
N. fischeri, and N. spinosa. Sequence fragments of ITS and -tubulin were assembled in Sequencher 3.0 (Gene Code Corporation, 1995), and sequences were aligned in MacClade 4.01 (25). Bayesian Metropolis coupled Markov chain Monte Carlo (B-MCMCMC) analysis was done with MrBayes 3.0b4 (18). Mod-els of evolution were selected with Modeltest 3.06 (40). No topological conflicts were detected for these data when a reciprocal 95% posterior probability crite-rion was used (22), and therefore a Bayesian analysis of the combined data set of ITS and-tubulin was performed. Posterior probabilities of 95% or higher were considered significant. The analysis used a random tree, four separate chains that each ran for 5 million generations, and trees sampled every 100th generation.
on September 8, 2020 by guest
http://ec.asm.org/
Likelihood scores and model parameters were evaluated to determine that the run had reached stationarity. The length of the burnin interval was 1 million generations.
The program r8s 1.7 (46) was used to estimate relative divergence times from the most recent common ancestor of the two speciesA. fumigatusandN. fischeri
and from the most recent common ancestor of each species. This approach uses a penalized likelihood method and the truncated Newton algorithm to enable independence from the molecular clock while estimating divergence times, meaning that different branches may have different rates of evolution (45). A maximum-likelihood tree was constructed with PAUP* (52), based oninter1
sequences for a clone-corrected 528-bp data set of 21 unique haplotypes ofA. fumigatus,N. fischeri,N. spinosa, andA. clavatus. The locusinter1was chosen over the combined data set due to its higher genetic variation within species. The best evolutionary model for these data was estimated by MODELTEST (40) to be HKY (17). The single tree obtained was used to estimate relative divergence points. The outgroupA. clavatuswas pruned prior to relative time point estima-tion. The optimal smoothing parameter was set to 1, permitting rate variaestima-tion. Five random starting values were given. The variance of values obtained was evaluated with a bootstrap script written by David Hearn (personal communi-cation), as recommended in the program manual. A total of 993 bootstrap replicates were used to estimate standard deviation values. Two standard devi-ations are used to indicate variance for the time points estimated.
Haplotype networks and summary statistics: globalA. fumigatus,N.fischeri, andN. spinosadata sets.Sequences were aligned by hand with MacClade 4.01, and haplotype networks were constructed based on the detected polymorphic sites. The haplotype networks were constructed by hand based on the polymor-phic sites shared and confirmed using maximum parsimony as implemented in PAUP* (52). The lengths of the three intergenic regions were 514 bp forinter1, 615 bp forinter2, and 950 bp forinter3, from 70 strains ofA. fumigatusisolated from locations across the globe. The same loci were sequenced from six strains ofN. fischeriand five strains ofN. spinosaisolated from diverse locations (see Table S1 in the supplemental material). Bootstrap support values were estimated for the haplotype networks of the speciesN. fischeriandN. spinosaby using 1,000 replicates with two random-addition sequences per replicate.
DnaSP, version 3.53, software (44) was used to estimate the population genetic parameters of nucleotide diversity and effective population size (32) and to perform neutrality tests based on the frequency distributions of segregating sites (12, 13, 53). Neutrality tests based on haplotype number (K) and haplotype diversity (H) were conducted by comparing observed values ofKandHto their 95% confidence intervals under strict neutrality (8). For each locus and each species, nucleotide diversity was estimated for each intergenic locus sequenced (t). Approximate 95% confidence intervals were obtained fort using Monte Carlo simulations based on the coalescent process, as implemented in DnaSP, version 3.53. These simulations assumed a neutral, infinite-sites model, with a large and constant population size and no recombination. All simulations were conducted by fixing the number of segregating sites to that observed in the sample. Simulating the evolution of 10,000 independent replicate populations generated the empirical distribution of the statistic. This distribution was used to determine approximate confidence intervals.
To conduct a nonparametric test for the hypothesis that the anamorphic species (A. fumigatus) harbors less genetic variation overall than either of the teleomorphic species (N. fischeriandN. spinosa), the Mann-Whitney U test was performed with Statview, version 5, software (SAS Institute) on the basis of nucleotide diversity estimates for each species and locus.
Analyses of population structure.The software package Arlequin V2.00 (47) was used to estimate population parameters for each of the data sets of multiple strains isolated from five sites. Population substructure was examined withFST, which does not explicitly take into account a mutational mechanism, as well as
RST(50), which does. Correlation between genetic and geographic distances was examined by using a Mantel test with 10,000 permutations, also with Arlequin V2.00.
Nucleotide sequence accession numbers.All sequences determined in this study have been deposited in the GenBank database (accession numbers DQ020660 to DQ020968 and DQ378068 to DQ378094).
RESULTS
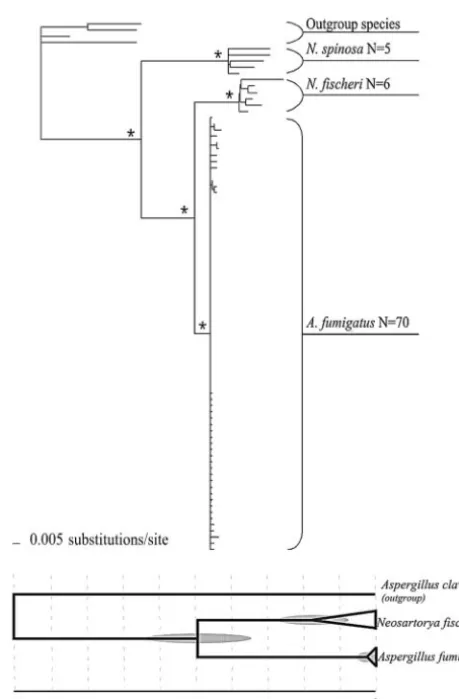
Isolates compared in a phylogenetic framework.When an-alyzed together, ITS and-tubulin sequences from isolates of
A. fumigatus, N. fischeri, and N. spinosaclustered into three monophyletic groups (Fig. 1, top) that correspond to each of
the three species. These groups were each significantly ported, but no subdivision within any species clade was sup-ported. Branch lengths indicate low genetic variation in theA. fumigatuslineage compared toN. fischeriandN. spinosa.
The relative divergence point of the most recent common ancestor for theA. fumigatusandN. fischeriisolates examined is estimated to be 49.51⫾13.66. The relative divergence point of the most recent common ancestor of theN. fischeriisolates is 17.43⫾10.12, and for theA. fumigatusisolates the estimated relative divergence point is 2.64⫾3.18. There is no overlap between the estimated divergence point and variance (2 stan-dard deviations) ofA. fumigatusand that ofN. fischeri.
FIG. 1. Phylogenetic reconstructions forA. fumigatusand Neosar-toryaspecies. (Top) Molecular phylogeny of the speciesA. fumigatus, N. fischeri, andN. spinosa. This phylogenetic reconstruction is based on a B-MCMCMC analysis of ITS and-tubulin with outgroup taxa from the genusAspergillussubgenusFumigati(N. aureola,N. pseudofischeri, N. spathulata, andN. stramenia). Branches with asterisks represent nodes supported by 95% or greater posterior probability. (Bottom) Representation of relative divergence times from the most recent common ancestor ofN. fischeriandA. fumigatusand from the most recent common ancestor of isolates sampled for each of the speciesN. fischeri and A. fumigatus. Two standard deviations for each of the estimated divergence times are indicated by shaded ovals. The relative divergence times are plotted on a 100-unit scale with, 0 being the present day and 100 being the most recent common ancestor forA. fumigatus,N. fischeri, and the outgroup taxonAspergillus clavatus.
on September 8, 2020 by guest
http://ec.asm.org/
Patterns of haplotype variation.InA. fumigatus, the inter-genic regionsinter1and inter2have one dominant haplotype, though multiple similar and, in some cases, shared (shared by two or more isolates) haplotypes were also recovered (Fig. 2). Atinter3, three haplotypes predominate, though other similar, but often unique, haplotypes were recovered. From the 70A. fumigatusindividuals analyzed, we found a total of 33/2,079 (0.016%) sites to be polymorphic (10, 5, and 18 for inter1,
inter2, andinter3, respectively), with only two states recovered at each polymorphic site. The number of nucleotide differences between any two sequences ranged from 1 to 6 substitutions
across the loci. The haplotype networks have consistency indi-ces of 1 (no homoplasy) when generated with maximum par-simony as the optimization criterion.
In comparison, the three intergenic loci from N. fischeri
isolates had proportionally more unique haplotypes. At each locus, at least four of the six strains analyzed had a novel haplotype (Fig. 2). InN. fischeri, 72/2,169 (0.034%) sites were polymorphic, with only two states recovered at each polymor-phic site. Similarly, the three intergenic loci fromN. spinosa
had proportionally more unique haplotypes thanA. fumigatus, with at least four of the five strains analyzed having a novel
FIG. 2. Haplotype networks forA. fumigatus,N. fischeri, andN. spinosaisolates. Each branch represents one mutation, and each hash mark signifies one additional mutation. Circle sizes and the numbers (N) reported beside or within the circles indicate the total number of times an allele was sampled. Circles ofA. fumigatusare shaded gray to indicate the relative proportion of individuals that are mating-type MAT1-1 and unshaded to indicate the proportion of individuals that are mating-type MAT1-2. One individual has an unknown mating type and so, for the shading of the haplotype circle it is in, the total used to determine proportions is one less than the total number of individuals. Bootstrap support values of 70% or greater for particular nodes are indicated by bolding of the internode.N. fischeriandN. spinosaisolates are labeled as follows: a, NRRL 4075; b, CBS316.89; c, CBS317.89; d, CBS525.65; e, CBS681.77; f, CBS832.88; g, CBS161.88; h, CBS448.75; i, CBS580.90; j, CBS483.65; k, CBS 586.90 (see Table S1 in the supplemental material).
on September 8, 2020 by guest
http://ec.asm.org/
haplotype (Fig. 2). InN. spinosa, 67/2,143 (0.031%) sites are polymorphic, with only two states recovered at each polymor-phic site. Branches with bootstrap support values of 70 or greater were recovered for some nodes within each genealogy forN. fischeriandN. spinosa, but these relationships were not consistent across the three loci for either species.
Nucleotide diversity. The data revealed a significant rela-tionship between predominant reproductive mode and nucleo-tide diversity (P⫽0.017, Mann-Whitney U test). Estimates of nucleotide diversity were always greater inN. fischeriandN. spinosa, the two species with known teleomorphic states, than inA. fumigatus, the anamorphic species (Table 1). The approx-imate 95% confidence intervals fort inA. fumigatusdid not overlap with those forN. fischeri orN. spinosa in any of the three loci examined (Fig. 3).
Neutrality tests. None of the neutrality tests indicated a significant deviation from the neutral model, based on the frequency distributions of segregating sites (12, 13, 53) or
hap-lotypes (8). Estimates of Tajima’sDstatistic for each sample are provided in Table 1.
Genetic differentiation.Three analyses to assess genetic dif-ferentiation in the speciesA. fumigatuswere done. The first used the 70 isolates ofA. fumigatusfrom the global population and assigned each to one of the geographic regions: North America, South America, Europe, Africa, Australasia. A sec-ond analysis used the 33 isolates ofA. fumigatusobtained from soil at five locations in Europe and North America. Isolates were grouped by site of origin. In the third analysis, all 103 isolates of A. fumigatus used in the first two analyses were grouped by mating type.
Partitioning of genetic variation within and among the 70 isolates grouped geographically was examined by using an analysis of molecular variance (AMOVA) (10), starting from a matrix of pairwise genetic distances. Using pairwise distances measured as the number of shared alleles, which corresponds to the infinite-alleles model, all pairwise FST values were
smaller than 0.08 and none were significant after the permu-tation process. The AMOVA, pooling isolates according to geographical regions, showed that 71% of the genetic variance observed was within regions and the variance component was not significant (P ⫽ 0.09). Therefore, the overall FSTvalue
(0.38) was not larger than those obtained from random per-mutations of haplotypes between populations, indicating no genetic structure.
For the 33 strains isolated from the five sites in North Amer-ica and Europe, similarity between strains was calculated asS⫽
(the number of alleles shared over all loci)/(the number of loci). Pairwise distances were then calculated as 1⫺S. Geo-graphic distances between the sites in Finland, Germany, Nu-navut, Ontario, and North Carolina were obtained from a web-based program (available at http://www.indo.com/distance/), and a 33-by-33 geographic distance matrix was constructed. As ex-pected from the lack of geographical structure and the presence of large local differentiation, no correlation was detected between the geographic and genetic distance matrices (r⫽0.06,P⫽0.290; Mantel test, 10,000 permutations).
Our results found no evidence to support a mating-type-based trend of genetic differentiation for the speciesA. fumiga-tus. Using pairwise distances measured as the number of shared alleles, which corresponds to the infinite-alleles model, anFSTof 0.21 is not significant at the 0.05 level. About 79% of
the total variance is contained within a mating-type locus.
TABLE 1. Nucleotide variation and diversity ofAspergillus fumigatus,Neosartorya fischeri, andNeosartorya spinosa, based on three intergenic loci
Locus Species No. of
strains
Length (bp)
No. of haplotypes
No. of polymorphic sites
No. of shared
substitutionsa Tajima’sDb t (10⫺3)
inter1 A. fumigatus 70 514 10 9 5 1.03 1.16
N. fischeri 6 523 6 30 4 ⫺1.28 67.32
N. spinosa 5 526 4 17 7 ⫺0.84 74.57
inter2 A. fumigatus 70 615 6 5 6 1.02 0.71
N. fischeri 6 620 4 17 11 ⫺0.40 41.61
N. spinosa 5 628 5 30 8 ⫺0.75 49.08
inter3 A. fumigatus 70 950 18 19 12 0.9 2.37
N. fischeri 6 977 5 25 17 ⫺0.5 79.25
N. spinosa 5 989 5 20 4 ⫺0.86 66.49
aTotal number of substitutions shared by at least two isolates.
bNo significant departures from the frequency distribution expected under neutrality were observed.
FIG. 3. Nucleotide diversity for three intergenic regions inA. fu-migatus,N. fischeri, andN. spinosa. Thick bars represent estimates of nucleotide diversity based on pairwise sequence comparisons. Thin bars indicate ranges of error represented by the approximate 95% confidence intervals for this estimate, determined by Monte Carlo simulation of the coalescent process.
on September 8, 2020 by guest
http://ec.asm.org/
When using the sum of squared allele-sized differences, a dis-tance measure corresponding to the stepwise mutation model, 82% of the variance is among regions, and anRSTof 0.40 is not
significant at the 0.05 level.
DISCUSSION
This study assessed genetic variation and genetic differenti-ation for the common moldA. fumigatuswith the aim to fur-ther our understanding of its population genetics and evolu-tionary history. We found genetic variation to be low in the anamorphicA. fumigatuscompared to its close teleomorphic relatives N. fischeri and N. spinosa. From our data, no geo-graphic pattern for genetic differentiation withinA. fumigatus
was observed when isolates were associated according to broad geographical regions or by geographic distance. WhenA. fu-migatus isolates were partitioned by mating type, no genetic differentiation within the mating type was found.
Genetic variation inA. fumigatus,N. fischeri, andN. spinosa. A. fumigatusis an anamorphic species, and though population genetic results consistent with historical recombination have been detected in this species, it is assumed that its predominant reproductive mode is by the asexual production of conidial spores (41, 56). Clonality is a characteristic of this species’ life history that is expected to reduce variation within populations but may increase variation among populations if migration is low. In the absence of high levels of gene flow, local selective sweeps will remove variation within populations but will not remove variation between populations. We find, however, that levels of variation on a global scale appear to be very low forA. fumigatus. A significant difference (Fig. 3) was found between the genetic diversity of unlinked loci in the anamorphic A. fumigatus species and each of the teleomorphic species, N. fischeriandN. spinosa.
The haplotype networks for each of the three loci illustrate the distribution of mutations and the number of haplotypes present within each species (Fig. 2). At each of the three loci,
A. fumigatus has fewer mutations and proportionally fewer haplotypes present than eitherN. fischeriorN. spinosa. Based on the modest samplings ofN. fischeriandN. spinosaisolates, this suggests that these species hold greater genetic variation thanA. fumigatus.
Bootstrap support values of 70% or higher were inferred for some branches in the haplotype networks of the speciesN. fischeriand N. spinosabut not for A. fumigatus(Fig. 2). The supported topological partitions for the two teleomorphic spe-cies were, however, discordant among loci and therefore are not considered candidates for cryptic species by a criterion proposed by Dettman et al. (9) wherein well-supported clades that are not contradicted by other loci are considered candi-date cryptic species. The supported topological partitions are also not consistently supported in the majority of loci, another criterion for intraspecific genetic differentiation suggestive of a cryptic species (9).
A weakness inherent to our comparison betweenA. fumiga-tusand the speciesN. fischeriandN. spinosais that the Neo-sartoryaisolates used were all from culture collections. Multi-ple mycologists isolated theNeosartoryastrains over the past century from diverse geographic locations and ecological hab-its. For many decades in the early 1900s, maintenance of
cul-tures was done with slant agar media by serial transfer. After many dozens of such transfers, the strain might not be identi-cal, genetically or morphologically, to the original strain de-posited, especially if preservation conditions influenced the mutation rate or the pressures of natural selection. The cul-tures ofNeosartoryawe used for this study range in age over the past century, whereas almost allA. fumigatusisolates were obtained within the past five years. In addition, it is possible that these isolates had an unusual morphology or growth habits that led them to be candidates for deposition at a culture collection and that, along with phenotypic diversity, the iso-lates are biased for greater genotypic diversity. Another draw-back of theNeosartoryadata set is that both species are ho-mothallic (self-compatible), meaning that A. fumigatus was being compared to sexual species that could outcross or self; the implications of this mating system would have some impact regarding their population genetics, which were not accounted for.
The estimated relative divergence point for theA. fumigatus
isolates analyzed here is determined to be more recent, with no overlap when 2 standard deviations are applied, compared to the isolates ofN. fischeri(Fig. 1, bottom). This result supports the interpretation that A. fumigatus, as it persists now, is a species with a more recent common ancestor for all extant strains than that ofN. fischeri.Having a more recent intraspe-cific diversification,A. fumigatus may have had less time to accrue mutations within the species.
Population structure ofA. fumigatus.A lack of genetic dif-ferentiation was observed forA. fumigatusin both the broad sampling of mainly environmental isolates and in the data set of multiple isolates from each of five sites in North America and Europe. AMOVA did not detect any pattern of genetic differentiation between the sites for which multiple isolates were obtained. The lack of population structure could be solely the result of rampant and effective dispersal patterns, or it could reflect (cryptic) genetic exchange of individuals sufficient to prevent population divergence.
The population genetics portrait that begins to emerge from this and previous studies is of a widespread species that exhib-its little variation, either within geographic regions or on a global scale. This result agrees with the recent findings of Pringle et al. (41) regardingA. fumigatusand the arguments made by Raper et al. (43) that fungal species with a broad geographic distribution have little potential for genetic struc-ture. Eukaryotic microbes such asC. elegans(48) and alga (49) are examples of widely distributed and free-living nonfungal species with little population structure and support the gener-alized hypothesis presented by Finlay et al. (11) regarding global dispersal patterns of microbes. Findings presented here contrast with examples of fungal species where a global pop-ulation was hypothesized but then disproved following molec-ular systematic or population genetic treatment (3, 19, 21, 30, 36).
A possible explanation to account for the low levels of vari-ation in our data and those from other studies is that A. fumigatushas only recently spread throughout the world. Gen-eral trends for its isolation from soil findA. fumigatus more readily recovered from disturbed soils, correlating with anthro-pogenic activity, than from undisturbed sites (G. Szakacs, un-published data). Another interpretation to explain the low
on September 8, 2020 by guest
http://ec.asm.org/
levels of variation worldwide is thatA. fumigatusoccurs in very low numbers in nature, but given its rapid growth rate observed in laboratory cultures, its ease of isolation from soil, and documentation of its ready isolation from the air column, this seems an unlikely explanation. Fertile A. fu-migatusconidia are commonly recovered from the air col-umn and soil of disturbed areas and may be a candidate for rampant clonal dispersal (41).
The patterns of genetic variation in A. fumigatuscan also be considered in light of models of natural selection. If recom-bination is low due to low rates of outcrossing, then both selective sweeps (20, 28) and background selection (selection against deleterious alleles that takes with it neutral polymor-phism) (4, 34, 35) can greatly reduce levels of genetic variation. However, two points argue against selective sweeps as the main cause of low polymorphism. First, selective sweeps that are associated with local adaptation will remove variation only over the local geographic area, increase population differenti-ation, and promote the presence of more widespread polymor-phisms. However,A. fumigatusreveals low levels of polymor-phism globally and no indication of population structure. Second, a recent selective sweep exerts an effect on patterns of variation at linked neutral loci very similar to that of a recent population expansion. In effect, a selective sweep may cause a severe bottleneck for linked loci. However, the frequency of shared mutations provided only scant evidence for recent pop-ulation growth, as would be expected if much of the genome was linked to regions that had recently experienced selective sweeps on a global scale.
Aspergillus fumigatus occurs in areas with widely different climates and environments. The low genetic variation and lack of population genetic differentiation on a global scale observed in this species could be due to continual gene flow across continents. Its conidia are buoyant in the air column and have some protection from UV light due to their melanin pigmen-tation. The tolerance of these mitospores to a range of tem-peratures makes them well suited for survival in the air column and soil. The data presented here are also consistent with small population effects typical of bottleneck events or a recent di-vergence of theA. fumigatuslineage.
ACKNOWLEDGMENTS
This work was supported by funds from the A. W. Mellon Founda-tion Fund to Duke University for Plant Systematics, the Catherine Keever Fund from the Duke Biology Department, and the J. S. Karling Graduate Student Research Award from the Botanical Society of America.
We thank Jason Stajich and Fred Dietrich for technical assistance. We appreciate the help of David Hearn and Vale´rie Reeb with statis-tical analyses. We acknowledge the help of Jolanta Miadlikowska, Vale´rie Reeb, Heath O’Brien, Stephanie Dietzmann, Margaret Henk, William Henk, and Kenji Hodgson in collecting soil samples. We value the thoughtful conversation and helpful comments of Thomas Mitch-ell, Joseph Heitman, Fred Dietrich, Rytas Vilgalys, John Willis, An-drea Sweigart, Marcy Uyenoyama, and the Lutzoni lab group. We are appreciative of the suggestions and critiques given by two anonymous reviewers.
REFERENCES
1.Bennett, R. S., S. H. Yun, T. Y. Lee, B. G. Turgeon, E. Arseniuk, B. M. Cunfer, and G. C. Bergstrom.2003. Identity and conservation of mating type genes in geographically diverse isolates ofPhaeosphaeria nodorum. Fungal Genet. Biol.40:25–37.
2.Brookman, J. L., and D. W. Denning.2000. Molecular genetics inAspergillus fumigatus. Curr. Opin. Microbiol.3:468–474.
3.Cairney, J. W. G.2002.Pisolithus—death of the pan-global super fungus. New Phytol.153:199–201.
4.Charlesworth, B., M. T. Morgan, and D. Charlesworth.1993. The effect of deleterious mutations on neutral molecular variation. Genetics134:1289– 1303.
5.Couch, B. C., and L. M. Kohn.2000. Clonal spread ofSclerotium cepivorum
in onion production with evidence of past recombination events. Phytopa-thology90:514–521.
6.Culberson, W. L., and C. F. Culberson.1973. Parallel evolution in the lichen-forming fungi. Science180:196–198.
7.Day, P. R., S. L. Anagnostakis, and J. E. Pulhalla.1971. Pathogenicity resulting from mutation at theblocus ofUstilago maydis. Proc. Natl. Acad. Sci. USA68:533–535.
8.Depaulis, F., and M. Veuille.1998. Neutrality tests based on the distribution of haplotypes under an infinite-sites model. Mol. Biol. Evol.15:1788–1790. 9.Dettman, J. R., D. J. Jacobson, and J. W. Taylor.2003. A multi-locus genealogical approach to phylogenetic species recognition in the model eukaryoteNeurospora. Evolution57:22703–22720.
10.Excoffier, L., P. E. Smouse, and J. M. Quatro.1992. Analysis of molecular variance inferred from metric distances among DNA haplotypes: application to human mitochondrial DNA restriction data. Genetics131:479–491. 11.Finlay, B. J.2002. Global dispersal of free-living microbial eukaryotic
spe-cies. Science296:1061–1063.
12.Fu, Y. X.1997. Statistical tests of neutrality against population growth, hitchhiking and background selection. Genetics147:915–925.
13.Fu, Y. X., and W. H. Li.1993. Statistical tests of neutrality of mutations. Genetics133:693–709.
14.Gaudet, J., J. Julien, J. F. Lafay, and Y. Brygoo.1989. Phylogeny of some
Fusariumspecies as determined by large subunit rRNA sequence compari-son. Mol. Biol. Evol.6:227–242.
15.Geiser, D. M., J. C. Frisvad, and J. W. Taylor.1998. Evolutionary relation-ships in AspergillussectionFumigatiinferred from partial-tubulin and hydrophobin DNA sequences. Mycologia90:831–845.
16.Glass, N. L., S. J. Vollmer, C. Staben, J. Grotelueschen, and R. L. Metzenberg. 1988. DNAs of the two mating-type alleles ofNeurospora crassaare highly dissimilar. Science241:570–573.
17.Hasegawa, M.1990. Phylogeny and molecular evolution in primates. J. Mol. Evol.21:160–174.
18.Huelsenbeck, J. P., and F. Ronquist.2001. MRBAYES: Bayesian inference of phylogenetic trees. Bioinformatics17:754–755.
19.James, T. Y., D. Porter, J. L. Hamrick, and R. Vilgalys.1999. Evidence for intercontinental gene flow in the cosmopolitan mushroom,Schizophyllum commune. Evolution53:1665–1677.
20.Kaplan, N., R. R. Hudson, and C. H. Langley.1989. The “hitchhiking effect” revisited. Genetics123:887–889.
21.Kasuga, T., T. J. White, G. Koenig, J. McEwen, A. Restrepo, E. Castaneda, C. de Silva Lacaz, E. M. Heins-Vaccari, R. S. de Freitas, R. M. Zancope-Oliveira, Z. Qin, R. Negroni, D. A. Carter, Y. Mikami, M. Tamura, M. L. Taylor, G. F. Miller, N. Poonwan, and J. W. Taylor.2003. Phylogeography of the fungal pathogenHistoplasma capsulatum. Mol. Ecol.12:3383–3401. 22.Kauff, F., and F. Lutzoni.2002. Phylogeny of the Gyalectales and Ostropales
(Ascomycota, Fungi): among and within order relationships based on nu-clear ribosomal RNA small and large subunits. Mol. Phylogenet. Evol.25: 138–156.
23.Klich, M. A., L. H. Tiffany, and G. Knaphus.1992. Ecology of the aspergilli of soils and litter, p. 329–354.InJ. W. Bennett and M. A. Klich (ed.),Aspergillus: biology and industrial applications. Butterworth-Heinemann, Reading, Mass. 24.Lobuglio, K. F., J. I. Pitt, and J. W. Taylor.1993. Phylogenetic analysis of two
ribosomal DNA regions indicates multiple independent losses of a sexual
Talaromycesstate among asexualPenicilliumspecies in subgenus Biverticil-lium. Mycologia85:592–604.
25.Maddison, W., and D. Maddison.2005. MacClade: analysis of phylogeny and character evolution, version 4.01. Sinauer, Sunderland, Mass.
26.Marra, R. E., and M. G. Milgroom.2001. The mating system of the fungus
Cryphonectria parasitica: selfing and self-incompatibility. Heredity86:134– 143.
27.Maynard Smith, J.1992. Age and the unisexual lineage. Nature356:661– 662.
28.Maynard Smith, J., and J. Haigh.1974. The hitch-hiking effect of a favour-able gene. Genet. Res.23:23–35.
29.Miller, M. G., and A. D. Johnson.2002. White-opaque switching inCandida albicansis controlled by mating-type locus homeodomain proteins and al-lows efficient mating. Cell110:293–302.
30.Mueller, G. M., Q.-X. Wu, Y.-Q. Huang, S.-Y. Guo, R. Aldana-Gomez, and R. Vilgalys.2001. Assessing biogeographic relationships between North Amer-ican and Chinese macrofungi. J. Biogeogr.28:271–281.
31.Muller, H. J.1932. Some genetic aspects of sex. Am. Nat.8:118–138. 32.Nei, M.1987. Molecular evolutionary genetics.Columbia University Press,
New York, N.Y.
33.Nielsen, K., G. M. Cox, P. Wang, D. L. Toffaletti, J. R. Perfect, and J. Heitman.
on September 8, 2020 by guest
http://ec.asm.org/
2003. Sexual cycle ofCryptococcus neoformansvar.grubiiand virulence of congenicaand␣isolates. Infect. Immun.71:4831–4841.
34.Nordborg, M.1997. Structured coalescent processes on different time scales. Genetics146:1501–1514.
35.Nordborg, M., B. Charlesworth, and D. Charlesworth.1996. Increased levels of polymorphism surrounding selectively maintained sites in highly selfing species. Proc. R. Soc. Lond. B263:1033–1039.
36.O’Donnell, K., H. C. Kistler, B. K. Tacke, and H. H. Casper.2000. Gene genealogies reveal global phylogeographic structure and reproductive isola-tion among lineages ofFusarium graminearum, the fungus causing wheat scab. Proc. Natl. Acad. Sci. USA97:7905–7910.
37.Paoletti, M., C. Rydholm, E. U. Schwier, M. J. Anderson, G. Szakacs, F. Lutzoni, J. P. Debeaupuis, J. P. Latge, D. W. Denning, and P. S. Dyer.2005. Evidence for sexuality in the opportunistic fungal pathogen Aspergillus fumigatus. Curr. Biol.15:1242–1248.
38.Peterson, S. W.2000. Phylogenetic relationships inAspergillusbased on rDNA sequence analysis, p. 323–356.InR. A. Samson and J. I. Pitt (ed.), Classification ofPenicillium andAspergillus: integration of modern taxo-nomic methods. Harwood Publishers, Reading, United Kingdom. 39.Poggeler, S.2002. Genomic evidence for mating abilities in the asexual
pathogenAspergillus fumigatus. Curr. Genet.42:153–160.
40.Posada, D., and K. A. Crandall.1998. Modeltest: testing the model of DNA substitution. Bioinformatics14:817–818.
41.Pringle, A., D. M. Baker, J. L. Platt, J. P. Ware, J. P. Latge, and J. W. Taylor. 2005. Cryptic speciation in the cosmopolitan and clonal human pathogenic fungusAspergillus fumigatus. Evolution59:1886–1899.
42.Raeder, U. A., and P. Broda.1985. Rapid preparation of DNA from fila-mentous fungi. Lett. Appl. Microbiol.1:17–20.
43.Raper, J. R., G. S. Krongelb, and M. G. Baxter.1958. The number and distribution of incompatibility factors inSchizophyllum commune. Am. Nat. 92:221–232.
44.Rozas, D., and J. Rozas.1999. DnaSp version 3: an integrated program for molecular population genetics and molecular evolution analysis. Bioinfor-matics15:174–175.
45.Sanderson, M. J.2002. Estimating absolute rates of molecular evolution and divergence times: a penalized likelihood approach. Mol. Biol. Evol.19:101– 109.
46.Sanderson, M. J.2003. r8s: inferring absolute rates of evolution and diver-gence times in the absence of a molecular clock. Bioinformatics19:301–302.
47.Schneider, S., D. Roessli, and L. Excoffier.2000. Arlequin: a software for population genetics data analysis. Department of Anthropology, University of Geneva, Geneva, Switzerland.
48.Sivasundar, A., and J. Hey.2003. Population genetics ofCaenorhabditis elegans: the paradox of low polymorphism in a widespread species. Genetics 163:147–157.
49.Slapeta, J., P. Lopez-Garcia, and D. Moreira.2006. Global dispersal and ancient cryptic species: the smallest marine eukaryotes. Mol. Biol. Evol. 23:23–29.
50.Slatkin, M.1995. A measure of population subdivision based on microsat-ellite allele frequencies. Genetics139:457–462.
51.Spieth, P. T.1975. Population genetics of allozyme variation inNeurospora intermedia. Genetics80:785–805.
52.Swofford, D. L.2002. PAUP*: phylogenetic analysis using parsimony (*and other methods). Sinauer Associates, Sunderland, Mass.
53.Tajima, F.1989. Statistical method for testing the neutral mutation hypoth-esis. Genetics123:585–595.
54.Thom, C., and K. B. Raper.1945. A manual of the aspergilli. Waverly Press, Baltimore, Md.
55.Turgeon, B. G., and O. C. Yoder.2000. Proposed nomenclature for mating type genes of filamentous ascomycetes. Fungal Genet. Biol.31:1–5. 56.Varga, J., and B. Toth.2003. Genetic variability and reproductive mode of
Aspergillus fumigatus. Infect. Genet. Evol.3:3–17.
57.Varga, J.2003. Mating type gene homologues inAspergillus fumigatus. Mi-crobiology149:816–819.
58.Varga, J., Z. Vida, B. Toth, F. Debets, and Y. Horie.2000. Phylogenetic analysis of newly describedNeosartoryaspecies. Antonie Leeuwenhoek77: 235–239.
59.Vilgalys, R., and M. Hester.1990. Rapid genetic identification and mapping of enzymatically amplified ribosomal DNA from severalCryptococcus spe-cies. J. Bacteriol.172:4238–4246.
60.White, T. G., T. Bruns, S. Lee, and J. Taylor.1990. Amplification and direct sequencing of fungal ribosomal RNA genes for phylogenetics, p. 315–322.In
M. A. Innis, D. H. Gelfand, J. J. Sninsky, and T. J. White (ed.), PCR protocols: a guide to methods and applications. Academic Press, San Diego, Calif.
61.Whitehouse, H. L. K.1949. Heterothallism and sex in the fungi. Biol. Rev. Camb. Philos. Soc.24:411–447.