http://www.sciencepublishinggroup.com/j/hyd doi: 10.11648/j.hyd.20190703.12
ISSN: 2330-7609 (Print); ISSN: 2330-7617 (Online)
Estimation of Surface Water Vapour Density and Its
Variation with Other Meteorological Parameters Over
Owerri, South Eastern, Nigeria
Davidson Odafe Akpootu
1, *, Wahidat Mustapha
2, Ashiru Muhammad Rabiu
3,
Mukhtar Isah Iliyasu
4, Mohammed Bello Abubakar
4, Serah Omolola Yusuf
5,
Simeon Imaben Salifu
61
Department of Physics, Usmanu Danfodiyo University, Sokoto, Nigeria
2Nigerian Meteorological Agency (NIMET), Abuja, Nigeria 3
Sokoto Energy Research Centre, Usmanu Danfodiyo University, Sokoto, Nigeria
4
Physics Unit, Umaru Ali Shinkafi Polytechnic, Sokoto, Nigeria
5Department of Physics, Arthur Jarvis University, Calabar, Nigeria 6
Department of Physics, Kogi State College of Education Technical, Kabba, Nigeria
Email address:
*
Corresponding author
To cite this article:
Davidson Odafe Akpootu, Wahidat Mustapha, Ashiru Muhammad Rabiu, Mukhtar Isah Iliyasu, Mohammed Bello Abubakar, Serah Omolola Yusuf, Simeon Imaben Salifu. Estimation of Surface Water Vapour Density and Its Variation with Other Meteorological Parameters Over Owerri, South Eastern, Nigeria. Hydrology. Vol. 7, No. 3, 2019, pp. 46-55. doi: 10.11648/j.hyd.20190703.12
Received: August 26, 2019; Accepted: September 18, 2019; Published: October 9, 2019
Abstract:
In this paper, the monthly variation of Surface Water Vapour Density (SWVD) with meteorological parameters of monthly average daily mean temperature, relative humidity, surface pressure, cloud cover and sunshine hours during the period of sixteen years (2000 – 2015) for Owerri (Latitude 5.48°N, Longitude 7.00°E, and 91m above sea level) were investigated. The daily variation of surface water vapour density for the two distinct seasons considering two typical months in each during the period of year 2015 was examined. The results showed fluctuation in the amount of surface water vapour density in each day of the month for the period under investigation. The monthly average daily values indicated that the surface water vapour densities are greater during the raining season than in the dry season. It was observed that the maximum average value of surface water vapour density of 21.002gm-3 occurred in the month of June during the raining season and minimum value of 14.653gm-3 in the month of January during the dry season. The highest value of surface water vapour density was observed on 9th May, 2015 and the lowest on 14th January, 2015. The comparison assessment of the developed SWVD based models was carried out using statistical indices of coefficient of determination (R2), Mean Bias Error (MBE), Root Mean Square Error (RMSE), Mean Percentage Error (MPE), Nash – Sutcliffe Equation (NSE) and Index of Agreement (IA). The developed multivariate correlation regression model that relates temperature and relative humidity with R2=99.9% MBE=0.1259 RMSE=0.1462 MPE=-0.6739 NSE=99.8402% and IA=99.9611% was found more suitable for surface water vapour density estimation with good fitting and therefore can be used for estimating surface water vapour density in the location under investigation and region with similar climatic information. The results of the descriptive statistical analysis revealed that the surface water vapour density, mean temperature, relative humidity, cloud cover and sunshine hours data spread out more to the left of their mean value (negatively skewed), while the surface pressure data spread out more to the right of their mean value (positively skewed). The surface water vapour density data have positive kurtosis which indicates a relatively peaked distribution and possibility of a leptokurtic distribution while the mean temperature, relative humidity, surface pressure, cloud cover and sunshine hours data have negative kurtosis which indicates a relatively flat distribution and possibility of platykurtic distribution.1. Introduction
The connection between the surface and the atmosphere in the hydrological cycle is normally referred to as Water vapour. Virtually all the water vapour in the atmosphere originated at the surface of the earth where water evaporates from the ocean and the continents owning to the sun’s radiation and is transpired by plants and respired by animals into the atmosphere [1]. The atmosphere and the water vapour can be transported horizontally and vertically through the three-dimensional circulation of the atmosphere and may condense forming liquid water or ice crystals in clouds; when water returns to the earth’s surface in different forms of precipitation such as rain or snow the cycle is said to be completed. The cycle is closely related to the atmospheric circulation and temperature patterns [2]. Approximately two third of the natural green house effect of the earth’s atmosphere are caused by water vapour, as a result of this, may be considered the most important greenhouse gas [3].
As the Earth’s surface temperature increases, the atmosphere tends to hold more water vapour. This atmospheric water vapour, acts as a greenhouse gas thereby absorbing energy that would otherwise cause attenuation of electromagnetic radiation travelling through the atmosphere, the consequences of these could be atmospheric or global warming. The proportion by volume of water vapour in the air at the ground level on the average changes from less than 0.001%in the arctic to more than 6% in the tropics [4]. This proportion decreases speedily with height [4].
The balance between the incoming radiation from the sun and the outgoing reflected and scattered solar radiation plus the thermal infrared emission to space is referred to as the Earth's Radiation Budget (ERB) and is significantly influenced by the Earth's surface conditions through surface water vapour and temperature variations in the thermal infrared and through a critical contribution of temperature to the planetary albedo particularly for desert areas and snow- and ice-covered polar areas [5-6]. The atmospheric water vapour content responds to variations in temperature, microphysical processes and the atmospheric circulation. An overarching consideration is that the highest quantity of water vapour air can hold increases rapidly with temperature, in accordance with the Clausius- Clapeyron equation [7]. This affects all aspects of the hydrological cycle [7].
Researches on climate models have shown that an increase in atmospheric humidity by 12 – 25% will have the same global average radiative effect than doubling the Carbon (iv) oxide concentration [5]. On the contrary to the homogeneous
distribution of long-lived Carbon (iv) oxide, water vapour distribution is highly variable in space and time. Apart from its direct radiative effect, water vapour acts indirectly by interacting with aerosols, clouds and precipitation [8-9]. This indirect effect of surface cooling offers one of the largest uncertainties in the understanding of the radiative balance of the earth’s atmosphere [10].
The aim of this study was to investigate the daily and monthly variation of surface water vapour density and to examine the monthly variation with meteorological parameters of mean temperature, relative humidity, surface pressure, cloud cover and sunshine hours for Owerri located in South Eastern, Nigeria. The study also developed new model for estimating surface water vapour density and descriptive statistical analysis was carried out for the location under investigation.
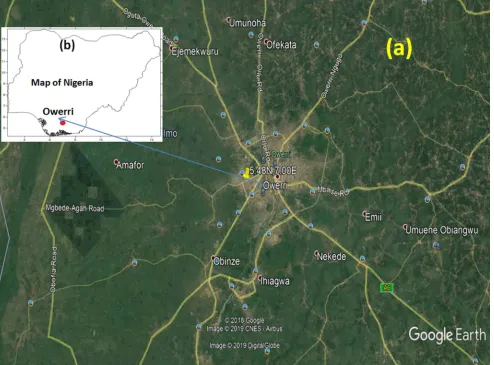
2. Study Area
Figure 1 shows the study area under investigation. Imo is a state in Nigeria located in south eastern Nigeria. Owerri (Latitude 5.48°N, Longitude 7.00°E, and 91m above sea level) is the capital city of Imo and one of the largest in the state. The State is bordered by Abia State on the East, River Niger and Delta State to the West, Anambra State on the North and Rivers State to the South. The changes that occur as a result of rising surface temperature and rainfall, the area is likely vulnerable to the consequences of global warming [11]. Two seasons are identified, wet and dry seasons. The rainy season is from April to October while the dry season is from November to March. Double maxima, with the first maximum in June and the second in September also characterized the climate. There is therefore a “little dry season” in-between known as “August Break” brought about by the seasonal north and southward movement of the ITCZ (Inter-Tropical Convergence Zone). An average annual temperature above 20°C (68.0°F) creates an annual relative humidity of 75%, with humidity reaching 90% in the rainy season [11]. The dry season experiences two months of Harmattan from late December to late February. January and March are the hottest months [11].
Figure 1. Map of (a) Google map showing the study area (b) Map of Nigeria showing the study area.
3. Methodology
The daily and monthly average minimum temperature, maximum temperature, relative humidity, surface pressure, cloud cover and sunshine hours meteorological data used in this study were obtained from the European Centre for Medium-Range Weather Forecasts (ECMWF) at 2m height for Owerri, Imo state located in the South Eastern, Nigeria during the period of sixteen years (2000 – 2015).
The surface water vapour density (SWVD), vapour pressure (e) and mean temperature (T) are related by the following expression [2, 4] as:
216.7 (1)
The vapour pressure was obtained using the expression given by Adeyemi and Ogolo [2] as: (2)
where and are the relative humidity and saturated vapour pressure respectively. The saturated vapour pressure was evaluated using the Claussius Clapeyron equation defined as: 9.4051 ! (3)
The mean temperature, T was obtained using " #$%& #'( (4)
where")*+ and "),- are the maximum and minimum temperatures respectively. The is in ./ , and in millibars 0.12, " in Kelvin 032 and in percentage 0%2. In this study, the regression models for SWVD estimations are of the forms 5 6 1") *-6 7 (5)
8 6 9 6 :;; (6)
6 < 9 6 = (7)
> 6 ?;; 6 @ (8) where5, 1, 7, 8, , :, , <, =, >, ? 5B8 @ are empirical SWVD constants.
Nash-Sutcliffe equation (NSE) and the Index of Agreement (IA), similarly. The coefficient of determination ( ) was determined for each of the models. The expressions for the MBE, RMSE and MPE as stated according to El-Sebaii and Trabea[13] are given as follows.
CDE -∑ G-,K ,,H*I− ,,) *J (9)
C E = L-∑ G-,K ,,H*I− ,,) *J M
N O (10)
C9E =-∑ PQRST',#U$/QRST',V$W
QRST',#U$ X ∗ 100
-,K (11)
The Nash-Sutcliffe equation (NSE) is given by the expression
Z E = 1 − ∑ GQRST(N ',#U$/QRST',V$WJO
∑ GQRST(N ',#U$/QRST[[[[[[[[[',#U$JO (12)
The Index of Agreement (IA) is given as
\] = 1 − ∑ GQRST('^N ',V$W/QRST',#U$JO
∑ G_QRST('^N ',V$W/QRST[[[[[[[[[',#U$_&_QRST',#U$/QRST[[[[[[[[[',#U$_JO (13) From equations (9) – (13) ,,) *, ,,H*I and B are respectively the =`a measured and =`a calculated values of daily surface water vapour density and the total number of observations, also [[[[[[[[[,,) * is the mean surface water vapour density.
Chen et al. [14] have recommended that a zero value for MBE is ideal and a low RMSE is desirable. Similarly, the smaller the value of the MBE and RMSE the better is the performance of the model, a positive MPE and MBE values provide the averages amount of overestimation in the calculated values, while the negative values gives underestimation. A low value of MPE is desirable. The percentage error between −10%and +10% is considered acceptable [15]. High values of R2, NSE and IA are desirable. The MBE and the RMSE are in gm-3, while R2, MPE, NSE and IA are in percentage (%).
The skewness and kurtosis tests were studied in this present work. The skewness test 0bc2 measures the asymmetry of the parameters data around their mean value; it is a measure of symmetry, or more precisely, the lack of symmetry [16]. It informs us about the direction of variation of the dataset [16]. If bc= 0, the data have a Gaussian distribution (normal distribution), while bc< 0indicates that the data are spread out more to the left of the mean value than to its right (negatively skewed), when bc > 0indicates that data are spread out more to the right than to its left (positively skewed) [17].
The Kurtosis test 0?f2describes the shape of a random variable’s probability distribution, that is it characterizes the relative peakedness or flatness of a distribution compared to the normal distribution [16]. It measures the degree of normality of each of the meteorological parameters under investigation [17]. For ?f= 0 the data have normal distribution, for ?f> 0 the data have positive kurtosis which implies peaked distribution, that is, leptokurtic distribution (that is, too tall), when ?f< 0the data have negative kurtosis
signifying flat distribution, that is, platykurtic distribution (that is, too flat, or even concave if the value is large enough).
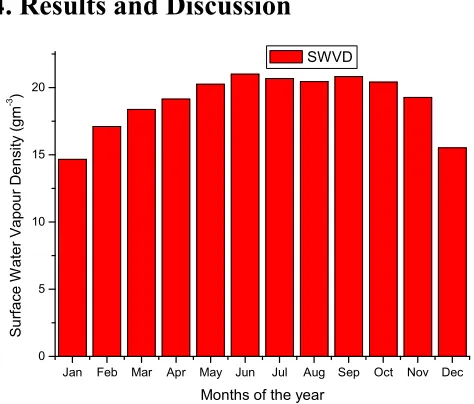
4. Results and Discussion
Figure 2. Monthly variation of Surface Water Vapour Density at Owerri, Nigeria.
Figure 2 shows the monthly variation of Surface Water Vapour Density (SWVD) during the period under investigation for the study area. The result revealed that the SWVD during the raining season is greater than in the dry season. It was observed that the maximum average value of SWVD of 21.002gm-3 and minimum value of 14.653gm-3 occurred during the raining and dry seasons in the months of June and January respectively. It was observed that the values of SWVD decreases in the month of July and August immediately after its maximum value in the month of June and later increases in the month of September; this observation is in line with the result reported by Adeyemi and Ogolo [2] for Ikeja and Ibadan located in the Southern zone of Nigeria.
Figure 3. Surface Water Vapour Density during the dry season for Owerri, Nigeria.
Jan Feb Mar Apr May Jun Jul Aug Sep Oct Nov Dec 0
5 10 15 20
S
u
rf
a
c
e
W
a
te
r
V
a
p
o
u
r
D
e
n
s
it
y
(
g
m
-3 )
Months of the year SWVD
0 5 10 15 20 25 30
4 6 8 10 12 14 16 18 20 22 24
S
W
V
D
(
g
m
-3 )
in
d
ry
se
a
so
n
Days of the months in 2015 for Owerri, Nigeria
Figure 3 shows the SWVD during the dry season for the location under investigation. The result showed fluctuation in the amount of SWVD with the least values in the months of January and December respectively.
Figure 4. Surface Water Vapour Density during the raining season for Owerri, Nigeria.
Figure 4 shows the SWVD during the raining season for the location under investigation. The result showed fluctuation in the amount of SWVD with the highest values in the months of June and September respectively.
Figure 5 is an extraction of figure 2. The maximum and minimum values of SWVD obtained in the month of January 2015 for the location under study are on the 1st and 14th with SWVD of 21.098gm-3 and 4.610gm-3 respectively. The SWVD decreases from its maximum value of 21.098gm-3 on the 1st January 2015 to 4.836gm-3 on the 5th January and gradually increases from 5th January to 7th January. It maintains almost a steady value from 7th to 10th January, 2015 and slightly increases and decreases on the 11th and 12th January 2015 and then maintains almost a steady value from 12th- 15th January. The SWVD then increases from 15th – 20th January 2015 which suddenly decreases and increases on the 21st and 22nd January with dip downward and upward. The SWVD fluctuating varies until it drops from 29th January to 31st January 2015.
Figure 5. Surface Water Vapour Density during the dry season (January and December) for Owerri, Nigeria.
Figure 6. Surface Water Vapour Density during the dry season (June and September) for Owerri, Nigeria.
The maximum and minimum values of SWVD observed in the month of December 2015 are on the 2nd and 30th of December 2015 with SWVD of 21.928gm-3 and 5.602gm-3 respectively. The SWVD gradually increases from 1st to 2nd December and sharply drops from 2nd to 3rd December and consequently to 5th December 2015. It rise and fall between 5th to 6th December and 6th to 7th December. The SWVD increases from 7th December to 9th December and then drop to 11th December, 2015. The pattern of fluctuation between 11th to 19th December is almost similar. The SWVD rises and fall between 19th – 22nd December 2015 with a dip upward on 21st December 2015. The SWVD then fluctuates changing inconsistently until it gets to 31st December 2015.
Figure 6 is an extraction of figure 3. The maximum and minimum values of SWVD obtained in the month of June 2015 for the location under study are on the 18th and 2nd of June 2015 with SWVD of 25.215gm-3 and 16.668gm-3 respectively. The SWVD decreases from 22.237gm-3 on the 1st June to its minimum value of 16.668gm-3 on the 2nd June, 2015 and sharply increases from 2nd June to 3rd June and drop on the 4th June with fluctuations of almost an equal amount from 4th – 8th June, 2015 which suddenly increases from 8th June to 9th June with similar fluctuations from 9th – 11th June; there is a sharp fall in the SWVD from 11th to 12th June, 2015 which increases with almost similar pattern of fluctuation from 12th June – 18th June, 2015. The SWVD drops with almost an equal range in values from 18th – 21st June, 2015 and then rise and fall from 21st – 23rd June, 2015 and from 23rd – 25th June, 2015 and fluctuates with almost similar pattern of variation until it gets to 30th June, 2015.
The maximum and minimum values of SWVD observed in the month of September 2015 for the location under investigation are on the 20th and 10th September, 2015 with SWVD of 23.507gm-3 and 16.671gm-3 respectively. The SWVD slightly increases from 1st to 2nd September, 2015 and suddenly fall and rise on 3rd and 4th September, 2015 with a dip upward; similar observation was noticed between 4th – 6th September, 2015; the SWVD drops from 6th – 8th September,
0 5 10 15 20 25 30
14 16 18 20 22 24 26
S
W
V
D
(
g
m
-3 )
in
r
a
in
in
g
s
e
a
s
o
n
Days of the months in 2015 for Owerri, Nigeria
Apr May Jun Jul Aug Sep Oct
0 5 10 15 20 25 30
4 6 8 10 12 14 16 18 20 22 24
S
W
V
D
(
g
m
-3 )
in
d
ry
s
e
a
s
o
n
Days of the months in 2015 for Owerri, Nigeria
Jan Dec
0 5 10 15 20 25 30
16 18 20 22 24 26
S
W
V
D
(
g
m
-3 )
in
r
a
in
in
g
s
e
a
s
o
n
Days of the months in 2015 for Owerri, Nigeria
2015 at almost equal rate and fluctuates with similar pattern of variation from 8th – 13th September, 2015; the pattern of variation are almost similar from 13th – 27th September, 2015 with minor peak values on the 18th and 20th September, 2015. The SWVD drops from 27th September to 28th September, 2015 and suddenly rise and drop on the 29th and 30th September, 2015 respectively.
Figure 7. Minimum values of SWVD for each month in 2015 for Owerri, Nigeria.
Figure 7 shows the plot of the minimum values in each month for the location under investigation. The result indicated that the minimum value of SWVD was found to be 4.610gm-3on the 14th of January in 2015.
Figure 8. Maximum values of SWVD for each month in 2015 for Owerri, Nigeria.
Figure 8 shows the plot of the maximum values in each month for the location under investigation. The result indicated that the maximum value of SWVD was found to be 25.923gm-3on the 9th of May in 2015.
Figure 9 shows the monthly variation of SWVD with mean temperature for the location under study. The SWVD at Owerri increases gradually from a minimum value of 14.653gm-3 in the month of January until it gets to its peak value of 21.002gm-3 in the month of June and decreases to August with a dip downward which suddenly increases to September and then drop to December. The mean
temperature increases with the SWVD from January and attained its maximum value of 27.813°C in the month of March which then decreases continuously to its minimum value in the month of August and increases subsequently to December. The drop in the SWVD as observed in the month of August may be as a result of August break, which is a period of short dryness; it is obvious that it corresponds to the period when the minimum temperature was observed in the study area. The results showed that high and low values of SWVD were observed during the raining and dry seasons respectively; the reverse is the case for the mean temperature.
Figure 9. Monthly variation of SWVD with mean temperature at Owerri, Nigeria.
Figure 10. Monthly variation of SWVD with relative humidity at Owerri, Nigeria.
Figure 10 shows the monthly variation of SWVD with relative humidity for the location under study. The relative humidity increases with SWVD from their minimum values in the month of January to June while the relative humidity extends to July. A little dip downward was observed both for the relative humidity and SWVD in the month of August which then increases slightly to September and then drop to December. The observed drop in the values of the relative humidity and SWVD in the month of August may be due to short period of dryness (August break) which is common in the coastal region and most parts of Nigeria. The high values of SWVD observed during the raining season are due to high 14-J 19-F 12-M 27-A 04-M 02-J 29-J 23-A 10-S 12-O 6-N 30-D
4 6 8 10 12 14 16 18 M in im u m S W V D ( g m -3 )
Min. Day for each Month in 2015 for Owerri
01-J 18-F 16-M 12-A 09-M 18-J 08-J 25-A 20-S 18-O 14-N 02-D 21 22 23 24 25 26 M a x im u m S W V D ( g m -3 )
Max. Day for each Month in 2015 for Owerri
Feb Apr Jun Aug Oct Dec
14 16 18 20 22 SWVD Temp
Months of the year
S u rf a c e W a te r V a p o u r D e n s it y ( g m -3) 24 26 28 M e a n T e m p e ra tu re ( 0 C )
Feb Apr Jun Aug Oct Dec
14 16 18 20 22 SWVD RH
Months of the year
air humidity (close to 90%) observed in this part of Nigeria, when the city of Owerri is under the influence of a large quantity of moisture-laden tropical maritime air resulting from continuous migration of inter-tropical discontinuity (ITD) with the sun. Generally, when the dry and dust –laden north-east winds become dominant in December, the dry harmattan season sets in, resulting in lower values of SWVD. The result revealed that high values of SWVD and relative humidity were observed during the raining season and low values during the dry season.
Figure 11. Monthly variation of SWVD with surface pressure at Owerri, Nigeria.
Figure 11 shows the monthly variation of SWVD with surface pressure for the location under study. It was observed that as the SWVD increases from its minimum value in January and attained its maximum value in June; the surface pressure decreases from January and attained its minimum value in March which then increases until it gets to its peak value in the month of July and then decreases to December. The result revealed that high values of SWVD and surface pressure were observed during the raining season and low values during the dry season.
Figure 12. Monthly variation of SWVD with cloud cover at Owerri, Nigeria.
Figure 12 shows the monthly variation of SWVD with
cloud cover for the location under study. The cloud cover increases with the SWVD from January to April and maintain almost a constant value from April to May and increases from May and attained its maximum values in the month of September; the cloud cover and SWVD drop from September to December in which the minimum value of cloud cover is in December. The result revealed that high values of SWVD and cloud cover were observed during the raining season and low values during the dry season.
Figure 13. Monthly variation of SWVD with sunshine hours at Owerri, Nigeria.
Figure 13 shows the monthly variation of SWVD with sunshine hours for the location under study. The sunshine hours decreases and increases at almost an equal interval from January to May and then decreases to its minimum value in the month of August which corresponds to the August break observed for the SWVD. The sunshine hours increases from its minimum value in August to its maximum value in December. The result revealed that high values of sunshine hours were observed during the dry season and low values during the raining season which is the reverse case for the SWVD.
The regression equations for the developed models are given by the expressions
= −30.8 + 1.16 ") *-+ 0.257 (14)
= 24 − 0.015 9 + 13.9 ;; (15) = −94 + 0.133 9 − 2.61 (16) = 5.04 + 14.9 ;; + 0.373 (17) Table 1 presents the rundown of the various statistical tests implemented. Based on the R2 the model, equation 14 has the highest value with 99.9 % and is judged the best model. Based on the MBE, the model, equation 17 has the lowest value with overestimation of 0.0831MJm-2day-1 in the estimated value and is judged the best model. Based on the RMSE the model, equation 14 has the lowest value with 0.1462MJm-2day-1 and is judged the best model. Based on the MPE, all the models fall within the acceptable range
Feb Apr Jun Aug Oct Dec
14 16 18 20 22 SWVD Pressure
Months of the year
S u rf a c e W a te r V a p o u r D e n s it y ( g m -3) 990 992 994 S u rfa c e P re s s u re ( m b a rs )
Feb Apr Jun Aug Oct Dec 14 16 18 20 22 SWVD CC
Months of the year
S u rf a c e W a te r V a p o u r D e n s it y ( g m -3) 0.4 0.5 0.6 0.7 0.8 0.9 C lo u d C o v e r
Feb Apr Jun Aug Oct Dec 14 16 18 20 22 SWVD SSH
Months of the year
0C9E ≤±10%2 with the model, equation 17 having the lowest value with underestimation of 0.5504% in the estimated value and is judged the best model. Based on the
NSE and IA the model, equation 14 has the highest value with 99.8402% and 99.9611% respectively and is judged the best model.
Table 1. Validation of the surface water vapour density for Owerri under different statistical test.
Models R2 (%) MBE (gm-3) RMSE (gm-3) MPE (%) NSE (%) IA (%)
Eqn 14 99.9 0.1259 0.1462 -0.6739 99.8402 99.9611
Eqn 15 92.0 0.5963 0.8321 -3.3033 94.8235 98.8499
Eqn 16 52.4 -0.4875 1.5002 1.9285 83.1740 94.6946
Eqn 17 92.3 0.0831 0.5750 -0.5504 97.5278 99.3828
Table 2. Ranking of the evaluated surface water vapour density for Owerri as per Statistical test.
Models R2 MBE RMSE MPE NSE IA Total rank
Eqn 14 1 2 1 2 1 1 8
Eqn 15 3 4 3 4 3 3 20
Eqn 16 4 3 4 3 4 4 22
Eqn 17 2 1 2 1 2 2 10
The ranking of the models (Table 2) was done based on the validation of the models (Table 1). The total ranks obtained by the different models ranged from 10 to 22. Based on the overall results the model, equation 14 was found the best and most suitable for estimating Surface water vapour density for the study area.
Figure 14. Comparison between the SWVD and estimated SWVD models for Owerri, Nigeria.
Figure 14 shows the comparison between the SWVD and estimated SWVD models for the location under investigation. The SWVD underestimated the calculated models in the months of January, February and August. The model (Eqn
16) underestimated the SWVD and other calculated SWVD in the months from March to July and from September to November; the model (Eqn 16) also overestimated the SWVD and other calculated SWVD in the months of January and December. The model (Eqn 15) overestimated the SWVD and other calculated models in the months from February to April and from July to October.
Figure 15 shows that the model (Eqn 14) gives the best fitting with the SWVD as compared to other calculated models and therefore was recommended for estimating SWVD for Owerri, Nigeria.
Figure 15. Comparison between the SWVD and recommended estimated SWVD model for Owerri, Nigeria.
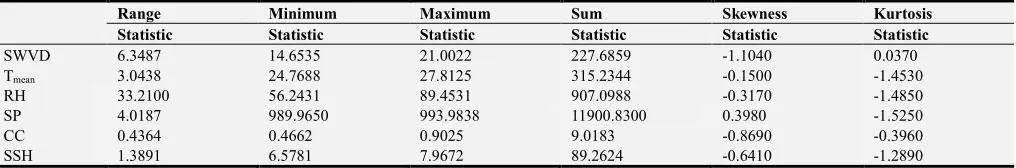
Table 3. Descriptive statistical analysis for the SWVD and other parameters for Owerri, Nigeria.
Range Minimum Maximum Sum Skewness Kurtosis
Statistic Statistic Statistic Statistic Statistic Statistic
SWVD 6.3487 14.6535 21.0022 227.6859 -1.1040 0.0370
Tmean 3.0438 24.7688 27.8125 315.2344 -0.1500 -1.4530
RH 33.2100 56.2431 89.4531 907.0988 -0.3170 -1.4850
SP 4.0187 989.9650 993.9838 11900.8300 0.3980 -1.5250
CC 0.4364 0.4662 0.9025 9.0183 -0.8690 -0.3960
SSH 1.3891 6.5781 7.9672 89.2624 -0.6410 -1.2890
The results shown in Table 3 showed that the surface water vapour density, mean temperature, relative humidity, cloud cover and sunshine hours data spread out more to the left of
their mean value (negatively skewed), while the surface pressure data spread out more to the right of their mean value (positively skewed). The mean temperature, relative humidity
Feb Apr Jun Aug Oct Dec
14 15 16 17 18 19 20 21 22
S
W
V
D
(
g
m
-3 )
Months of the year
SWVD Eqn14 Eqn15 Eqn16 Eqn17
Feb Apr Jun Aug Oct Dec
14 15 16 17 18 19 20 21 22
S
W
V
D
(
g
m
-3)
Months of the year
and surface pressure data seem to have a quassi-Gaussian distribution. Skewness of exactly zero is quite not likely for real world data [16]. The surface water vapour density, cloud cover and sunshine hours data are more divergent away from the normal distribution. It can be seen from Table 3 that the surface water vapour density data have positive kurtosis which indicates a relatively peaked distribution and possibility of a leptokurtic distribution while the other terms (mean temperature, relative humidity, surface pressure, cloud cover and sunshine hours) data have negative kurtosis which indicates a relatively flat distribution and possibility of platykurtic distribution.
5. Conclusion
In this present study, the issue of estimating SWVD and its variation with other meteorological parameters during the period of sixteen years (2000 – 2015) and daily variation of SWVD in each month for the year 2015 has been addressed using monthly average and daily average meteorological data obtained from the European Centre for Medium-Range Weather Forecasts (ECMWF) at 2m height for Owerri (Latitude 5.48°N, Longitude 7.00°E, and 91 m above sea level) Imo state located in the South Eastern, Nigeria. The results of this study revealed that high values of SWVD are recorded during the raining season and low values during the dry season. It was observed that the maximum and minimum average values of SWVD of 21.002gm-3 and 14.653gm-3 were found in the months of June and January during the raining and dry seasons respectively. The highest value of surface water vapour density was observed on 9th May, 2015 and the lowest on 14th January, 2015 during the period under investigation. Four simple two variable correlation models were developed and was statistically tested using statistical indices of coefficient of correlation, mean bias error (MBE), root mean square error (RMSE), mean percentage error (MPE), Nash – Sutcliffe Equation (NSE) and index of agreement (IA) from which the model that relates temperature and relative humidity was found more suitable for estimating surface water vapour density (SWVD) for the location under investigation. The results of the descriptive statistical analysis revealed that the surface water vapour density, mean temperature, relative humidity, cloud cover and sunshine hours data spread out more to the left of their mean value (negatively skewed), while the surface pressure data spread out more to the right of their mean value (positively skewed). The surface water vapour density data have positive kurtosis which designated a relatively peaked distribution and likelihood of a leptokurtic distribution while the mean temperature, relative humidity, surface pressure, cloud cover and sunshine hours data have negative kurtosis which designated a relatively flat distribution and likelihood of platykurtic distribution. This study is vital to hydro meteorologists and other relevant stakeholders and investors that need to know quantitatively the amount of SWVD and other pertinent information regarding SWVD for the location.
Acknowledgements
The authors wish to thank the European Centre for Medium-Range Weather Forecasts (ECMWF) for providing all the necessary meteorological data used in this study. The contributions and suggestions of the anonymous reviewers are well appreciated.
References
[1] AGU (1995). American Geophysical Union’s Special Report on Water Vapour in the Climate System. Washington, DC 20009.
[2] Adeyemi, B and Ogolo, E. O (2014). Diurnal and seasonal variations of surface water vapour density over some meteorological stations in Nigeria. Ife Journal of Science vol. 16: no. 2.
[3] Gerding, M., Christopher, R and Neuber, R (2002). Tropospheric water vapour observations by ground based Lidar. Sixth Ny-Alesund International scientific seminar, NPI report series, NorskPolarinstituH.
[4] Ajayi, G. O (1989). Physics of the tropospheric radio propagation. Proceedings of the ICTP College on Theoretical and Experimental Radio Propagation Physics, 6–24 February 1989, Trieste, Italy.
[5] Harries, J. E (1997). Atmospheric radiation and atmospheric humidity. Quarterly Journal of Meteorol. Society.123: 2173-2186.
[6] Schulz, J., Albert, P., Behr, H. D et al (2009). Operational climate monitoring from space: the EUMETSAT satellite application facility on climate monitoring (CM-SAF). Atmos. Chem. Phys. Discussion. net/8/8517/2008/.
[7] Wentz, F. J and Schabel, M (2000). Precise Climate Monitoring Using Complementary Satellite Data Sets. Nature.403: 414-416.
[8] Hegg, D. A., Hobbs, P. V., Gasso, S et al (1996). Aerosol measurements in the Arctic relative to direct and indirect radiative forcing J. Geophy. Res. 101: 23349-23363.
[9] Ramanathan, V., Crutzen, P. J., Kiehl, J. T et al (2001). Aerosols, climate and the hydrological cycle. Sci., 294: 2119-2124. [10] IPCC (2001). Inter governmental Panel on Climate change.
Third Assessment Report: Climate change 2001. WGI: The scientific basis, summary for policy makers, Geneva, Switzerland.
[11] Okorie, F. C., Okeke, I., Nnaji, A et al (2012). Evidence of Climate Variability in Imo State of Southeastern Nigeria. Journal of Earth Science and Engineering. 2 (2012): 544-553. [12] Okorie, F. C (2010). Great Ogberuru in Its Contemporary
Geography, Cape Publishers, Owerri, Nigeria.
[13] El-Sebaii, A and Trabea, A (2005). Estimation of Global Solar Radiation on Horizontal Surfaces Over Egypt, Egypt. J. Solids. 28(1): 163-175.
[15] Merges, H. O., Ertekin, C and Sonmete, M. H (2006). Evaluation of global solar radiation Models for Konya, Turkey. Energy Conversion and Management. 47: 3149-3173. [16] Akpootu, D. O., Iliyasu, M. I., Mustapha, W et al (2017). The
Influence of Meteorological Parameters on Atmospheric Visibility over Ikeja, Nigeria. Archives of Current Research International. 9(3): 1-12. doi: 10.9734/ACRI/2017/36010.