Mapping the Urban Lead Exposome: A Detailed Analysis of Soil Metal
Concentrations at the Household Scale Using Citizen Science
Gabriel M. Filippelli1,2, Jessica Adamic1, Deborah Nichols1, John Shukle1, and Emeline Frix1
1Department of Earth Sciences and Center for Urban Health, Indiana University – Purdue University Indianapolis (IUPUI), 723 W. Michigan St., Indianapolis, Indiana 46202, USA
2Environmental Resilience Institute, Indiana University
Abstract
An ambitious citizen-science effort in the city of Indianapolis (Indiana, USA) led to
the collection and analysis of a large number of samples at the property scale,
facilitating the analysis of differences in soil metal concentrations as a function of
property location (i.e., dripline, yard, and street) and location within the city. This
effort indicated that dripline soils had substantially higher values of lead and zinc
than other soil locations on a given property, and this pattern was heightened in
properties nearer the urban core. Soil lead values typically exceeded the levels
deemed safe for children’s play areas in the US (<400 ppm), and almost always
exceeded safe gardening guidelines (<200 ppm). As a whole, this study identified
locations within properties, and cities, that exhibited the highest exposure risk to
children, and also exhibited the power of citizen science to produce data at a spatial
scale (i.e., within a property boundary) that is usually impossible to feasibly collect
Keywords: Lead, children's health, zinc, soil, citizen-science
Introduction
Urban soils bear a lingering legacy of sometimes centuries of human occupation and
industrialization (e.g., Bellinger, 2011; Chambers et al., 2016; Filippelli and Taylor,
2018). Among the many anthropogenic inputs to surface soils are metals, many of
which, such as lead (Pb), have a very strong and permanent impact on human health
and urban well-being. Indeed, the social, health, and economic cost of Pb exposure
from urban soils is steep—far greater than the cost of targeted remediation of soil
Pb hotspots(Nevin, 2000; Needleman et al., 2002; Needleman, 2004;Nevin, 2007;
Nevin, 2009; Mielke and Zahran, 2012; Obeng-Gyasi et al., 2018a, b). The problem is
that soil metal concentration are highly heterogeneous at the small scale because of
multiple sources (house paint, automobile exhaust and debris, particulate matter
from utilities, industrial sources, etc.), and barring the identification of particular
emission sources and sinks, these metal hotspots prove exceedingly difficult to
pinpoint (Zahran et al., 2013a, b; Filippelli et al., 2015; Laidlaw et al., 2017).
Although new remote sensing techniques are promising as future geochemical
mapping tools in cities (e.g., Pandit et al., 2010), many obstacles remain to their
effective deployment.
One of the sad realities when it comes to soil contamination is that it is often
identified not through soil measurements but rather through human disease. For
example, we wait until hundreds or even thousands of kids appear on public health
exposome (e.g., Filippelli et al., 2005; Laidlaw et al., 2005; Leech et al., 2016), using
children as the veritable “Canary in the Coalmine,” which is a harmful and
backwards approach to protecting public health (e.g., Filippelli and Laidlaw, 2010;
Bellinger, 2011). What is needed is a better understanding of the soil metal
dynamics and patterns of distribution and associations in the urban environment,
with an eye toward identifying those processes and sources that have the highest
potential to cause human harm and ultimately remediating those sources in a
surgical fashion (Mielke et al., 1999; Clark et al., 2008; Laidlaw and Filippelli, 2008;
Laidlaw et al., 2012, 2016).
We present results from one such effort to map the urban metal exposome in the
city of Indianapolis, Indiana (USA), with a pollution of about 1 million people
residing the in the heart of the post-industrial Midwest region. Indianapolis is a
typical older (>150 year) city with a substantial legacy of industrialization,
manufacturing, and vehicle use, with urban and near-urban residential areas
marked by 80-100 year old single-family dwellings. Indianapolis shares another
characteristic of many Midwest cities—high rates of blood Pb poisoning, with ~25%
of children below 7 years old exhibiting blood lead levels above the level of concern
(5 microgram/dL) in some of the central census tracts (Fig. 1; data from 2005-2015;
Reuters, 2018). The majority of Pb exposure to these children comes from soil Pb,
with the mechanism being inadvertent ingestion or inhalation of Pb-contaminated
soils and/or dusts generated from soils.
2005-reveal areas in the city with persistent Pb exposure to children, which is likely
driven largely by soil and dust sources of legacy Pb from a mixture of leaded
gasoline, lead-based paints, and industrial sources (Laidlaw and Filippelli, 2008).
Citizen-science in action
A unique aspect of this study is that the majority of the samples themselves were
taken by citizen scientists, under the support of the Healthy Cities Project
(http://kheprw.org/healthy-cities-project/). The samples were guided by a soil Pb
dripline sample, one street side sample, and up to three other yard samples), sample
collection (aggregate samples of approximately the top 10 centimeters), and sample
storage (new zip-type plastic bags), in a manner similar as that employed in other
settings (e.g., Filippelli et al., 2015; Rouillon et al., 2017). The geochemical analyses
were performed at the IUPUI Biogeochemistry and Health Core Facility as described
in the Methods, and the results and recommendations were returned to the citizen
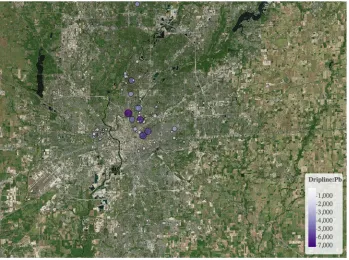
scientists. A total of just under 2,000 samples were analyzed from ~500 residential
properties (Fig. 2), broadly covering the city. The program is ongoing, with a
particular focus on youth activation and science communication.
Fig. 2. Example sample location map for Pb concentrations in dripline soils from
Indianapolis, Indiana (USA), displayed as output from an application under
development to assist citizen scientists in understanding the distribution patters on
multiple locations “hidden” under circles with high soil Pb concentrations.( Filippelli
et al.)
We found clear patterns in soil metal concentrations and relationships between
various metals at the household and the city level, providing insight into patterns of
legacy metal deposition, patterns in human health risks, and potential sources of
metals. The city-wide patterns for Pb in particular correlate strongly to blood lead
levels of children, and the particularly high values found at house driplines provide
further evidence that household-scale interventions that aim to isolate or cover
near-home soils might go a long way toward reducing personal exposure risks for
those dwelling in the homes.
Methods
A combination of open-call and campaign-style sampling schemes were utilized to
collect soil samples from properties in Indianapolis. The open-call samples were
solicited generally via on-line and in-person (community events, flyers, etc.)
contacts. The campaign-style samples came from individual communities or
community groups who would canvas neighborhoods and take samples at high
sampling densities—sometimes as frequently as every other property on a given
block. This led to a total sample location pool that was neither random nor equally
distributed around the city.
As noted above, instructions were provided as to the preferred location of samples,
sampling depths, and sample labeling. But with any citizen-generated science, the
uncontrollable inconsistency is present in the sample pool. It is likely not biased in a
specific direction, and furthermore, the sheer number of samples (~2,000) is likely
to effectively normalize some variations in sampling procedures, via the
“normalization to the mean” nature of high sample n’s numbers. Some inconsistency
in sample labeling was experienced which could be controlled for. In some cases,
this inconsistency was straightforward to interpret, such as “next to house” or “near
road” which translate into our pool of “dripline” and “street” categories. In some
cases, however, samples were labeled in a manner than must have made sense to
the citizen scientist (e.g., 1, 2, 3, 4, 5 or A, 2A, 3A, etc.) but could not be interpreted
into functional categories and thus were excluded from this study. Finally, one key
aspect of this analysis is the identification of spatial patterns in legacy metal
concentrations, and in some cases the sample address could not be uniquely
geocoded to a specific location, and thus these samples were also excluded.
Altogether, about 600 samples that fell into these exclusion criteria, and thus the
total number of samples presented here is about 1,400.
Upon delivery to the laboratory, soils were processed and analyzed as per Filippelli
et al. (2005). Briefly, soil samples were dried, sieved to 150 microns, and weighed
and ashed in a muffle furnace at 550 degrees Celsius to degrade organic matter. The
ashed sample was then transferred to 15 mL HDPE disposable centrifuge tube and
digested overnight in 2N HCl at room temperature on a shaker table. After
centrifugation, a subsample of the supernatant was diluted (1:100) with Milli-Q
water and analyzed on a Perkin Elmer ICP-OES for a suite of metals, specifically lead
Typical sample reproducibility, calculated from multiple measurements of the same
soil ashed, digested, and analyzed was 5% for all elements. Cadmium was also
included in the initial analysis, but unacceptably high levels of detection and poor
sample reproducibility precluded its effective use in this study.
Results
One of the critical components of predicting how, where, and to what metals people
are exposed involves understanding both the origin of metal distribution patterns
and the patterns of distribution at the personal (i.e., property) and community (i.e.,
neighborhood) scales. Our results for Indianapolis (Supplementary Materials) reveal
two origin classes of metals found in surface soils, an anthropogenic source that
dominate Pb and Zn distribution, and an ambient soil mineral source that defines
the relatively homogenous distribution at the household and neighborhood scale of
the other studied metals. The results confirm existing paradigms that elevated soil
Pb in cities has a clearly anthropogenic origin and is generally highest near home
driplines. But the results also reveal the power of citizen science to take an active
role in understanding the urban Pb exposome and to help fill the gap in the
currently poor state of urban soil geochemical mapping.
Property-scale distribution of soil metals and metal sources
Lead and Zinc. The greatest predictor of soil Pb and Zn concentration is location on
a particular property. For both metals, concentrations are much greater at the
dripline that in a given yard or near the street. For Pb, this results in mean
as 8,816 ppm, and for Zn, the mean is 575 ppm and the maximum is 3,814 ppm
(Table 1). For Pb, mean yard samples are lower (345 ppm) and street samples even
lower (240 ppm) than driplines, resulting in a relative dripline enrichment of 2.33.
For Zn, mean yard samples are also lower (312 ppm) and street samples even lower
(262 ppm) than driplines, resulting in a relative dripline enrichment of 2.19, quite
similar as that for Pb. This property-scale distribution pattern is an indicator of
anthropogenic source(s) for these metals. Indeed, a strong correlation is observed
between Pb and Zn when considering the entire individual sample population by
location category, with r2 ranging from 0.637 for dripline samples, 0.635 for yard samples, and 0.706 for street samples (Fig. 3). The consistency in correlation
between these two elements across location category (and nearly identical slope;
Fig. 3) suggests a similar source for both metals.
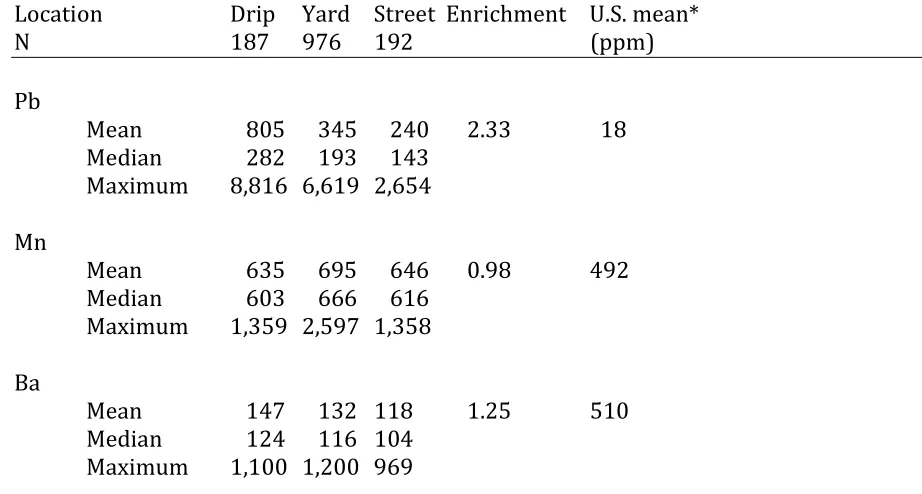
Table 1. Metals concentrations (ppm) for soils as a function of location on a property. Enrichment factor is calculated as highest value/lowest value for each mean metal concentration.
Location Drip Yard Street Enrichment U.S. mean*
N 187 976 192 (ppm)
Pb
Mean 805 345 240 2.33 18
Median 282 193 143
Maximum 8,816 6,619 2,654
Mn
Mean 635 695 646 0.98 492
Median 603 666 616
Maximum 1,359 2,597 1,358
Ba
Mean 147 132 118 1.25 510
Cr
Mean 23 22 20 1.15 30
Median 20 19 19
Maximum 249 1,183 79
Cu
Mean 41 28 29 1.46 14
Median 21 18 16
Maximum 1,469 1,332 888
Zn
Mean 575 312 262 2.19 58
Median 313 216 149
Maximum 3,814 3,660 3,892
Fig. 3. Correlation plots of Pb and Zn for all soil location types. The similar slopes for
over average soil indicate a strong anthropogenic source impacting their
distribution in urban soils. (Filippelli et al.)
Perhaps the best baseline with which to reference urban soil metal concentrations is
the comprehensive nation-wide USGS analysis (Smith et al., 2014). This baseline
encompasses rural regions that have no clear anthropogenic sources and others
semi-urban and urban regions with a strong imprint of anthropogenic inputs. This
US average was chosen as it spans multiple soil types and mineralogical
compositions. It is heavily biased toward non-urban settings given that the sample
locations were based on a geographic grid that provides a “normal” spatial sample
distribution, whereas urban and industrial centers are anything but normally
distributed, with strong concentration and non-random distributions in the spatial
sense.
Other Metals. Unlike the case for Pb and Zn, there are no apparent location
patterns, nor substantial enrichments, for soil Mn, Ba, Cr, or Cu (Table 1). Driplines
tend to have slightly higher Ba, Cr, and Cu values, but only by about 15-46%. The
strongest dripline signature is for Cu (46% enrichment), which might support a
weak relationship to an anthropogenic source. Meanwhile, Mn shows no enrichment
at all at the property scale, which indicates a geogenic driver for soil Mn
concentrations, even in an urban environment.
City-scale distribution of soil metals
There were typically three yard samples taken per property, as opposed to one each
city-wide patterns in soil metals lies in an analysis of yard soil samples. This analysis
yields mean values for soil Pb of between 263 and 494 ppm for Center Township
properties (i.e., downtown or near downtown), and between 323 and 468 ppm Zn
(Table 2). Soil values were significantly lower outside of the downtown, with mean
values between 157 and 175 for Pb and 239 and 244 for Zn (Table 2). It is important
to note that fewer samples were taken outside of the downtown, and thus only two
zipcodes had adequate (i.e., more than 20) samples from which to determine a mean
value. No clear downtown to outside of downtown patterns were observed for the
other elements analyzed as part of this study.
Table 2. Concentration of yard soil Pb and Zn sorted by Zipcode (only where over 20 samples were tested). Indianapolis, Indiana. Center Township represents the
downtown and near downtown zipcodes.
Zipcode Pb Zn
ppm ppm
Center Township
46218 mean 373 323
median 216 236
46222 mean 471 374
median 257 292
46201 mean 401 340
median 261 246
46202 mean 666 468
median 376 293
46203 mean 495 421
median 279 289
46208 mean 263 340
median 183 247
46205 mean 388 365
median 263 285
median 123 204
46220 mean 175 239
median 110 156
Discussion
Anthropogenic sources for Pb and Zn
As has been amply documented, higher-then-background Pb and Zn values are
consistent with an anthropogenic footprint in cities (e.g., Datko-Williams et al.,
2014; Harvey et al., 2017). The sources of these metals are multiple, and include
leaded gasoline, lead-based paint, and industrial emissions for Pb and tire debris,
fossil fuel combustion, and industrial sources for Zn (Mielke et al., 1999). This urban
effect for Pb and Zn is even seen clearly in river and reservoirs sediment samples
downstream of major metropolises (Callendar and Rice, 2000) and is interpreted to
derive from soil and dust runoff. Urban sources drive strong correlation in
downstream sediments and reservoirs surface samples.
The soil values that we found for all sample types (dripline, yard, and street) for Pb
and Zn were significantly above the US mean (Smith et al., 2014). For Pb, that
enrichment was over 1,000% for all sample types, and for Zn was over 400% for all
sample types (Table 1). Although the strong correlation between Pb and Zn (Fig. 3)
and the similar household-scale enrichment factor (Table 1) suggest a similar
source for both in the urban setting, the increase above mean US soil values is much
higher for Pb, with Pb being roughly 4.5 times higher than Zn in dripline soils, 3.6 in
proximal source for Pb that is greater than that for Zn. Although a likely culprit
might be lead-based paints, it is difficult to rule out the potential impact of past
combustion of leaded gasoline and barrier capture of that aerolized Pb next to
structures.
Both Pb and Zn were much higher in downtown properties than those outside of
downtown. One interpretation of this pattern is the growth trajectory of
Indianapolis, and indeed that of many Midwestern industrial cities. Densely spaced
residential and light industrial land uses were common in the first half of the 20th century in downtown areas, and this co-location of emissions sources with high
anthropogenic footprints likely lead to significantly higher amounts of industrial
and vehicular emission and deposition of Pb and Zn, which retained their urban
footprint (Filippelli et al., 2005; Datko-WiIliams et al., 2014) long after the phase-out
of leaded gasoline, lead-based paints, and emission controls for small scale Pb
foundry and recycling facilities in Indianapolis (Filippelli and Laidlaw, 2010).
Subsequent growth, in a relatively Pb-free time, occurred outside of the downtown
area, and thus the anthropogenic legacies were significantly lower in these areas.
Implications for human health
One of the clearest outcomes of this research is that soils near homes pose
significantly greater contact risks of Pb to individuals than soils anywhere else on
their property. Indeed, mean dripline soil concentrations (805 ppm) are above the
screening level of 400 ppm for soil Pb in playground and children’s play areas (US
The consistent finding of high values at driplines is critical, as this is a source of soil
and dust tracked into homes (Hunt et al., 2006; Hunt and Johnson, 2012). And the
mean for all soil location types exceeds the safe gardening recommendations of 200
ppm Pb recommended by some researchers (e.g., Kessler, 2013), and would benefit
from interventions to ensure that gardening in not a undue source of Pb exposure
either through direct contact or through produce consumption (Mielke et al., 2011;
Attanayake et al., 2015; Brown et al, 2016). If one takes the more conservative,
risk-based screening level of 100 ppm adopted by European countries (Jennings, 2013),
nearly all of the dripline and most of the full soil sample set would be in violation of
standards.
To be sure, significant property-to-property variability exists, and beyond some
city-scale patterns, it is impossible to predict in aggregate if a particular dripline soil
Pb value will be 10 ppm (the minimum found in Indianapolis; Supplementary
Materials) or 8,816 ppm, the maximum found (Table 1) and a level that clearly
poses dangers to residents within and near to that home. Given the observed
variability in dripline soils, and even those from yards and streets, it is fruitless to
use mean values to predict Pb exposures to children based on a typical IEUBK soil
exposure model. And indeed, even when property data was determined in those
areas where denser sample coverage was achieved, such as on the near west side of
Indianapolis, the property-to-property variability typically exceeded 50% across all
sample types. Note that the data was aggregated at the zipcode level in this analysis
to protect anonymity of individual property owners, and thus the source data for the
City-wide patterns in anthropogenic metal distributions
Not surprisingly, downtown soils retained a much high legacy metal impact
than those outside of downtown. This indicates that risks from metal exposure are
also significantly higher near the downtown core of Indianapolis, and likely many
other similar cities in the American Midwest and east coast with similar histories
and growth trajectories. Basically, when a city developed and its growth patterns
dictates its anthropogenic metal footprint, with younger cities largely avoiding the
worst of harmful metal emissions and legacy metal contaminants because of much
more rigorous environmental protections that were implemented over the latter
part of the 20th century in the US.
Conclusions
The anthropogenic footprint or urbanization is easily observed in legacy metals
distribution in Indianapolis, with the older urban core generally exhibition the
highest values of those metals presumed to be most strongly related to human
activities—Pb and Zn. Beyond this urban concentration is another spatial pattern—
i.e., significantly elevated levels of Pb and Zn near home driplines. This indicates the
role of structures in capturing fugitive dust as well as being point sources of metals
via paint and other building products. Form a health protection standpoint, these
findings reveal that urban core properties hold the greatest Pb exposure risk, and
that soils proximal to structures are particularly concerning and warrant special
interesting outcome of the approach to sample collection is that citizen-scientists
can be effectively engaged to expand research and to provide data at a scale that is
both not feasibly collected by an individual research and that are most
characteristics of the household’s individual soil exposure risk situation. Future
work focusing on the efficacy of risk communication and more spatially-explicit
examination of soil Pb values versus blood lead levels at the neighborhood scale
would further increase the public health impact of citizen-science studies such as
this one.
Acknowledgements
Funding for this work came from a Charles Bantz Fellowship, the Indiana Clinical
and Translational Sciences Institute funded by the National Institutes of Health, and
the National Science Foundation. Support from the Indiana Clinical and
Translational Sciences Institute funded, in part by Award Number UL1TR002529
from the National Institutes of Health, National Center for Advancing Translational
Sciences, Clinical and Translational Sciences Award. The content is solely the
responsibility of the authors and does not necessarily represent the official views of
the National Institutes of Health. This work was supported by the excellent efforts of
citizen-scientists throughout Indianapolis and particularly our research partners
References Cited
Attanayake, C.P., G.M. Hettiarachchi, S. Martin, and G.M. Pierzynski. 2015. Potential bioavailability of lead, arsenic, and polycyclic aromatic hydrocarbons in compost-amended urban soils. J. Environ. Qual. 44:930–944. doi:10.2134/jeq2014.09.0400
Bellinger, D.C., 2011. The protean toxicities of lead: new chapters in a familiar story. Int. J. Environ. Res. Public Health 8, 2593e2628.
Brown, S.L., Chaney, R.L., Hettiarachchi, G.M., 2016. Lead in urban soils: a real or perceived concern for urban agriculture? J. Environ. Qual. 45, 26e36.
http://dx.doi.org/10.2134/jeq2015.07.0376.
Callendar, E. and Rice, K.C., 2000. The urban environmental gradient: Anthropogenic influences on the spatial and temporal distributions of lead and zinc in sediments. Environ. Sci. & Technol. 34(2), 232-238. doi: 10.1021/es990380s.
Chambers, L.G., Chin, Y-P, Filippelli, G.M., Gardner, C., Herndon, E.M., Long, D.T., Lyons, W.B., Macpherson, G.L., McElmurry, S.P., McLean, C.E., Moore, J., Moyer, R.P., Neumann, K., Nezat, C.A., Soderberg, K., Teutsch, N., and Widom, E., 2016. Developing the scientific framework for urban geochemistry. Applied Geochemistry, 67: 1-20. doi: 10.1016/j.apgeochem.2016.01.005
Clark, H.F., D.M. Hausladen, and D.J. Brabander. 2008. Urban gardens: Lead
exposure, recontamination mechanisms, and implications for remediation design. Environ. Res. 107:312–319. doi:10.1016/j. envres.2008.03.003
Datko-Williams, L., A. Wilkie, and J. Richmond-Bryant. 2014. Analysis of U.S. soil lead (Pb) studies from 1970 to 2012. Sci. Total Environ. 468-469:854– 863.
doi:10.1016/j.scitotenv.2013.08.089
Filippelli, G.M. and Taylor, M. P., 2018. Addressing pollution-related global environmental health burdens. GeoHealth, 2,2 –5. doi: 10.1002/2017GH000119
Filippelli, G.M. and Laidlaw, M.A.S., 2010. The Elephant in the Playground: Confronting lead-contaminated soils as an important source of lead burdens to urban populations. Perspectives in Biology and Medicine, 53: 31-45.
Filippelli, G.M., Laidlaw, M., Raftis, R., and Latimer, J.C., 2005. Urban lead poisoning and medical geology: An unfinished story. GSA Today, 15: 4-11 (doi: 10.1130/1052-5173(2005)015<4:ULPAMG>2.0.CO;2).
Harvey, P.J., Rouillon, M., Dong, C., Ettler, V., Handley, H.K., Taylor, M.P., Tyson, E., Tennant, P., Telfer, V., and Trinh, R., Geochemical sources, forms and phases of soil contamination in an industrial city. Sci. Total Environ. 584, 505-514.
Hunt, A., Johnson, D.L., 2012. Suspension and re-suspension of dry soil indoors following track-in on footwear. Environ. Geochem. Health 34, 355e363.
Hunt, A., Johnson, D.L., Griffith, D.A., 2006. Mass transfer of soil indoors by track-in on footwear. Sci. Total Environ. 370, 360e371.
Jennings, A.A., 2013. Analysis of worldwide regulatory guidance values for the most commonly regulated elemental surface soil contamination. J Environ. Management 118:72–95; http://dx.doi.org/10.1016/j. jenvman.2012.12.032.
Kessler, R., 2013. Urban gardening: Managing the risks of contaminated soil. Environ. Health Perspect. 121(11-12). A327-333.
Laidlaw, M.A. and Filippelli, G.M., 2008. Resuspension of urban soils as a persistent source of lead poisoning in children: A review and new directions. Applied
Geochemistry, 23: 2021-2039.
Laidlaw, M., Mielke, H.W., Filippelli, G.M., Johnson, D., and Gonzales, C.R., 2005. Seasonality and children’s blood lead levels: Developing a predictive model using climatic variables and blood lead data from three US cities. Environmental Health Perspectives, 113 (6): 793-800 (doi:10.1289/ehp.7759).
Laidlaw, M.A.S., Zahran, S., Mielke, H.W., Taylor, M.P., and Filippelli, G.M., 2012. Re-suspension of lead contaminated urban soil as a dominant source of atmospheric lead in Birmingham, Chicago, Detroit, and Pittsburgh, USA. Atmospheric
Environment, 49: 302-310.
Laidlaw, M.A.S., Filippelli, G.M., Sadler, R.C., Gonzales, C.R., Ball, A.S., and Mielke, H.W., 2016. Children’s blood lead seasonality in Flint, Michigan (USA), and soil-sourced lead hazard risks. International Journal of Environmental Research and Public Health, 13, 358: doi:10.3390.
Laidlaw, M.A.S., Filippelli, G.M., Brown, S., Paz-Ferreiro, J., Reichman, S., Netherway, P., Truskewycz, A., Ball, A., and Mielke, H., 2017. Case studies and evidence-based approaches to addressing urban soil lead contamination. Applied Geochemistry, http://dx.doi.org/10.1016/j.apgeochem.2017.02.015.
Mielke, H.W., Zahran, S., 2012. The urban rise and fall of air lead (Pb) and the latent surge and retreat of societal violence. Environ. Int. 43, 48e55.
Mielke, H.W., Gonzales, C.R., Smith, M.K., Mielke, P.W., 1999. The urban environment and Children's health: soils as an integrator of lead, zinc, and cadmium in New Orleans, Louisiana, U.S.A. Environ. Res. Sect. A 81, 117e129.
Mielke, H.W., Covington, T.P., Mielke, P.W., Wolman, F.J., Powell, E.T., Gonzales, C.R., 2011. Soil intervention as a strategy for lead exposure prevention: the New Orleans lead-safe childcare playground project. Environ. Pollut. 159, 2071e2077.
Needleman, H., 2004. Lead poisoning. Annu. Rev. Med. 55, 209e222.
Needleman, H.L., McFarland, C., Ness, R.B., Fienberg, S.E., Tobin, M.J., 2002. Bone lead levels in adjudicated delinquents: a case control study. Neurotox. Teratol. 24,
711e717.
Nevin, R., 2000. How lead exposure relates to temporal changes in IQ, violent crime, and unwed pregnancy. Environ. Res. 83, 1e22.
Nevin, R., 2007. Understanding international crime trends: the legacy of preschool lead exposure. Environ. Res. 104, 315e336.
Nevin, R., 2009. Trends in preschool lead exposure, mental retardation, and scholastic achievement: association or causation? Environ. Res. 109, 301e310.
Obeng-Gyasi, E., Armijos, R.X., Weigel, M., Filippelli, G.M., and Sayegh, A., 2018. Cardiovascular-related outcomes in US adults exposed to lead. International Journal of Environmental Research and Public Health, 15, 759; doi:10.3390/ijerph15040759
Obeng-Gyasi, E., Armijos, R.X., Weigel, M., Filippelli, G.M., and Sayegh, A., 2018. Hepatobiliary-related outcomes in US adults exposed to lead. Environments, 5, 46; doi:10.3390/environments5040046
Pandit, C., Filippelli, G.M., and Li, L., 2010. An estimation of heavy metal concentration
in soils using reflectance spectroscopy and partial least squares regression. International
Journal of Remote Sensing, 31: 4111-4123, doi:10.1080/01431160903229200.
Reuters, 2018. https://www.reuters.com/investigates/graphics/lead-water/en/ accessed 10 June 2018.
Smith, D.B., Cannon, W.F., Woodruff, L.G., Solano, F., and Ellefsen, K.J., 2014.
Geochemical and mineralogic maps of soils of the conterminous United States. USGS Open-File Report 2014-1082.
U.S. EPA, 29 September 2015 update. Lead Regulations.
http://www.epa.gov/lead/lead-regulations (accessed 11 February 2016).
Zahran, S., Laidlaw, M.A., McElmurry, S.P., Filippelli, G.M., Taylor, M., 2013a. Linking source and effect: resuspended soil lead, air lead, and children's blood lead levels in Detroit. Mich. Environ. Sci. Technol. 47, 2839e2845.
Supplementary Material (to be published online)
Filippelli et al., IJERPH Urban Exposome
Table of all data of each location type. Rows are multiple elements of the same
samples. Soil samples were dried, sieved to 150 microns, and weighed and ashed in
a muffle furnace at 550 degrees Celsius to degrade organic matter. The ashed
sample was then transferred to 15 mL HDPE disposable centrifuge tube and
digested overnight in 2N HCl at room temperature on a shaker table. After
centrifugation, a subsample of the supernatant was diluted (1:100) with Milli-Q
water and analyzed on a Perkin Elmer ICP-OES for a suite of metals, specifically lead
(Pb), manganese (Mn), barium (Ba), chromium (Cr), copper (Cu), and zinc (Zn).
Typical sample reproducibility, calculated from multiple measurements of the same
soil ashed, digested, and analyzed was 5% for all elements. Cadmium was also
included in the initial analysis, but unacceptably high levels of detection and poor
Pb Mn Ba Cr Cu Zn
ppm pm ppm ppm ppm ppm
Dripline
Pb Mn Ba Cr Cu Zn
ppm pm ppm ppm ppm ppm
Pb Mn Ba Cr Cu Zn
ppm pm ppm ppm ppm ppm
Pb Mn Ba Cr Cu Zn
ppm pm ppm ppm ppm ppm
Pb Mn Ba Cr Cu Zn
ppm pm ppm ppm ppm ppm
408 554 140 5 61 276 1,227 839 128 17 44 803 148 761 103 13 11 190 332 745 148 15 28 478 465 758 113 12 17 541 1,045 730 103 13 17 809 1,154 739 187 17 18 691 349 720 118 13 19 192 231 847 93 14 17 207 685 878 169 20 35 344 1,796 894 105 25 31 1,349 189 909 135 18 75 207 1,324 746 166 22 19 1,318 298 937 126 16 19 489 322 626 98 13 19 281 903 778 135 20 51 966 174 977 90 14 12 110 538 519 133 27 1,469 1,147 34 417 42 8 5 57 14 326 48 9 3 86 10 132 31 9 2 65 99 749 55 12 12 122 1,738 930 193 21 63 772 23 665 58 12 4 49 6,253 555 85 26 43 2,707 1,173 647 195 13 35 813 516 1,086 116 19 19 519 2,219 1,086 265 24 32 1,230
Yard
Pb Mn Ba Cr Cu Zn
ppm pm ppm ppm ppm ppm
Pb Mn Ba Cr Cu Zn
ppm pm ppm ppm ppm ppm
Pb Mn Ba Cr Cu Zn
ppm pm ppm ppm ppm ppm
Pb Mn Ba Cr Cu Zn
ppm pm ppm ppm ppm ppm
Pb Mn Ba Cr Cu Zn
ppm pm ppm ppm ppm ppm
Pb Mn Ba Cr Cu Zn
ppm pm ppm ppm ppm ppm
Pb Mn Ba Cr Cu Zn
ppm pm ppm ppm ppm ppm
Pb Mn Ba Cr Cu Zn
ppm pm ppm ppm ppm ppm
Pb Mn Ba Cr Cu Zn
ppm pm ppm ppm ppm ppm
Pb Mn Ba Cr Cu Zn
ppm pm ppm ppm ppm ppm
334 1,130 203 28 29 264
1,550 1,170 521 33 47 873
189 1,160 201 48 46 243
368 824 196 27 40 311
728 1,190 377 32 27 791
409 946 215 32 48 365
149 593 132 45 30 143
949 834 221 27 38 480
666 1,120 377 37 61 682
544 938 269 36 43 457
2,180 981 455 28 42 1,570 494 957 278 35 56 384
560 1,120 288 33 38 439
168 1,240 182 35 24 159
265 1,100 223 37 58 268
423 1,170 261 32 31 399
353 1,260 219 52 35 326
533 1,040 262 34 54 457
1,380 997 398 31 53 681
201 1,260 182 26 21 167
269 868 201 38 38 274
656 1,220 245 31 33 378
798 1,100 303 29 28 396
263 955 185 27 42 315
283 1,030 195 28 44 351
773 924 308 27 42 824
108 1,100 175 30 27 177
1,350 982 623 26 140 809
113 873 246 31 32 188
957 698 1,200 38 48 895
267 1,080 277 32 48 421
324 1,100 229 29 33 310
75 641 127 18 18 99
498 998 285 30 54 472
228 902 191 24 24 283
240 689 136 23 25 189
269 1,070 193 29 36 265
293 757 165 24 32 296
644 604 182 21 30 205
Pb Mn Ba Cr Cu Zn
ppm pm ppm ppm ppm ppm
499 899 227 28 39 451
715 906 284 28 64 571
228 666 157 24 51 243
203 1,010 161 24 32 425
200 1,080 179 27 31 235
216 1,050 169 26 32 980
347 682 188 25 49 468
317 564 172 36 51 295
147 259 85 25 44 186
362 855 242 25 43 314
567 754 360 34 51 415
439 842 248 34 42 356
140 1,160 205 29 29 308
985 1,000 479 27 38 579
282 1,130 224 29 30 281
668 1,140 617 39 100 811
252 712 209 27 26 260
160 763 162 26 27 206
1,010 938 348 38 75 733
667 831 216 29 35 404
324 1,050 178 29 34 159
155 1,120 179 30 28 181
> 5000 967 1,140 66 146 3,660 602 1,380 226 33 37 507
210 842 149 27 33 238
248 858 148 28 36 185
121 828 143 27 37 157
156 614 110 18 23 135
109 548 98 17 24 118
124 612 98 18 25 123
29 383 72 13 8 64
423 520 96 18 29 104
47 945 108 25 16 88
206 678 80 14 9 138
95 929 129 23 14 109
94 768 121 21 15 135
173 1,213 154 26 22 208
234 918 164 28 36 253
Pb Mn Ba Cr Cu Zn
ppm pm ppm ppm ppm ppm
117 657 132 25 21 130
73 911 136 23 15 119
169 1,194 161 28 23 211
138 1,137 108 20 19 202
10 665 55 14 10 45
17 1,079 88 12 11 70
9 564 52 14 11 60
75 513 162 29 21 258
183 458 115 23 13 143
141 491 137 40 17 218
97 801 114 24 21 139
108 851 96 20 19 129
102 833 109 22 18 159
169 778 124 22 22 210
139 911 117 18 20 168
289 733 149 23 24 331
231 881 146 25 22 247
286 868 164 30 31 436
193 898 139 24 21 226
60 1,435 137 29 18 306
42 1,543 124 24 15 117
63 1,810 173 32 27 152
48 982 118 27 19 145
514 1,060 330 31 71 749
312 941 249 27 49 472
600 1,060 329 32 88 940
329 1,020 197 29 49 551
246 1,000 185 27 46 443
398 864 192 25 42 447
1,360 1,090 277 36 101 2,070 313 934 283 32 70 570
421 776 234 24 93 525
20 311 138 19 34 99
16 320 141 19 37 96
86 856 189 41 31 197
142 728 109 25 30 253
103 647 75 25 24 126
728 729 151 27 133 476
557 507 164 18 15 392
Pb Mn Ba Cr Cu Zn
ppm pm ppm ppm ppm ppm
514 555 153 18 18 484
233 751 119 16 10 133
816 574 148 17 10 297
33 665 120 17 8 57
634 781 185 35 28 957
539 754 120 23 12 861
652 653 100 36 22 498
192 759 93 22 7 242
154 751 68 19 6 109
258 1,038 103 22 12 268
253 1,010 98 22 12 258
102 1,189 118 21 17 103
11 1,206 86 21 33 175
310 749 76 17 45 308
135 1,083 106 19 17 191
34 389 54 11 21 100
35 465 59 18 20 160
64 551 82 16 29 167
36 614 108 25 19 70
120 795 111 12 10 280
515 384 118 14 18 209
80 689 81 12 25 308
338 392 100 17 25 361
320 463 198 18 31 541
311 553 95 16 34 232
68 643 76 14 15 137
370 336 117 15 17 231
82 318 64 14 19 132
79 529 149 31 32 158
374 684 215 30 140 458
209 438 123 26 45 239
269 623 222 29 55 418
217 604 212 31 55 374
195 650 156 23 38 321
723 454 561 39 392 1,190 143 679 142 24 60 203
197 668 134 26 36 254
66 766 125 22 19 97
Pb Mn Ba Cr Cu Zn
ppm pm ppm ppm ppm ppm
110 721 137 27 31 216
88 764 124 25 25 146
106 489 142 26 47 218
157 577 133 21 38 239
230 630 183 27 53 285
34 639 129 32 31 116
32 595 146 31 36 120
38 534 124 25 26 99
57 839 154 26 28 119
163 751 210 22 35 191
136 841 162 24 41 180
121 784 154 26 27 157
31 676 127 23 32 150
70 931 153 29 29 326
21 670 123 14 16 85
68 906 165 37 31 143
192 1,170 175 29 59 388
573 828 112 13 18 359
572 845 215 22 40 400
879 552 163 16 21 488
406 579 134 14 15 200
150 542 88 13 8 127
350 500 119 15 14 194
4,400 845 88 27 47 1,967 636 818 122 14 14 635
215 705 91 14 9 145
951 616 107 15 15 343
1,289 774 130 51 1,332 1,070 408 558 78 14 18 474
1,368 826 51 35 119 917
513 514 81 24 18 343
200 472 93 9 9 142
246 496 102 9 8 143
20 9 1 1 1 10
772 512 201 34 77 409
564 336 119 15 71 316
934 369 159 30 73 584
253 590 142 19 14 165
295 574 128 21 17 163
Pb Mn Ba Cr Cu Zn
ppm pm ppm ppm ppm ppm
538 564 167 21 19 362
562 701 142 29 46 1,261 536 779 130 28 36 683
684 716 199 29 30 747
45 568 94 20 17 90
29 693 106 20 18 82
42 526 80 17 13 64
330 623 144 30 36 378
131 681 150 25 20 157
315 1,010 262 44 35 335
84 285 63 16 5 95
161 374 95 19 8 164
246 515 97 17 19 252
670 705 178 21 28 351
363 605 137 18 21 259
329 347 74 11 48 262
190 283 69 11 11 177
155 298 64 11 7 133
530 763 103 14 22 386
1,689 636 65 11 14 435
129 596 99 16 16 334
57 460 109 19 17 153
65 434 86 19 18 199
56 492 121 22 18 159
126 561 95 24 12 209
60 406 69 20 9 108
66 408 62 17 16 572
199 355 82 18 13 133
152 739 165 26 18 246
204 624 125 24 14 219
328 493 83 17 13 620
197 316 89 20 12 287
269 488 129 20 26 381
45 491 150 30 28 130
278 650 152 27 37 228
288 717 200 33 48 362
121 458 102 24 31 126
511 608 207 29 62 499
Pb Mn Ba Cr Cu Zn
ppm pm ppm ppm ppm ppm
6 85 29 8 2 43
145 764 64 14 12 253
64 783 90 22 20 181
54 865 84 30 11 100
110 1,185 132 21 24 285
75 1,006 104 24 17 534
33 659 95 18 19 171
31 855 120 14 6 78
17 666 87 21 17 74
1,174 2,597 439 50 82 889
139 1,278 123 17 15 119
369 978 172 26 21 412
82 843 106 26 34 137
204 961 112 23 24 164
59 983 101 19 15 109
311 843 108 23 18 156
92 712 140 11 18 115
191 626 113 14 11 774
91 610 86 13 7 129
112 677 93 11 10 128
27 394 98 30 22 93
78 714 133 23 26 210
75 385 70 28 23 137
79 698 124 23 22 190
41 639 156 17 47 112
201 595 124 22 27 1,010 33 824 88 19 10 88
37 986 111 62 11 93
132 629 87 5 4 64
400 558 151 6 15 237
485 671 121 5 24 233
284 936 140 5 11 231
120 440 43 9 9 91
106 733 85 13 12 130
122 634 81 15 14 219
176 807 89 15 17 206
155 556 49 13 15 140
513 855 152 24 23 597
Pb Mn Ba Cr Cu Zn
ppm pm ppm ppm ppm ppm
51 460 68 15 10 78
197 550 91 21 17 137
45 333 57 14 8 87
381 1,065 172 27 29 430
320 1,089 158 28 29 345
628 1,048 172 29 44 415
186 729 112 16 15 161
398 585 140 26 42 371
1,051 619 203 29 209 920
180 731 119 16 19 175
164 925 126 18 16 159
214 676 131 22 27 366
212 824 147 20 16 479
128 822 118 17 9 977
412 611 193 21 35 459
74 844 102 16 7 96
57 790 88 13 6 82
110 681 84 12 8 177
155 806 111 15 10 198
370 848 143 21 137 952
185 870 179 23 36 230
117 725 118 13 13 210
66 602 94 11 7 115
107 742 117 14 16 223
463 856 116 19 33 361
187 809 118 13 8 190
65 600 99 16 10 107
457 828 96 12 10 372
229 919 146 40 18 335
235 869 121 75 44 287
243 800 144 80 59 298
179 620 113 19 12 240
210 717 131 20 14 199
140 718 133 18 10 154
177 884 135 16 14 265
262 782 150 19 18 513
355 812 163 18 42 763
261 765 117 30 16 290
Pb Mn Ba Cr Cu Zn
ppm pm ppm ppm ppm ppm
698 1,073 155 16 36 654
520 1,011 145 18 27 458
514 1,141 151 18 28 474
530 1,200 170 21 26 348
1,490 883 159 26 37 1,047 187 862 165 24 28 232
2,260 941 154 22 39 1,235 1,708 805 155 25 31 910
1,847 896 137 24 33 1,050 131 563 109 15 13 263
137 579 109 16 15 294
141 611 101 15 14 271
156 742 71 4 6 48
147 769 104 4 8 54
146 463 74 4 4 35
150 591 76 3 3 34
134 714 91 4 6 53
796 580 85 5 10 494
1,244 621 119 6 22 501
827 519 130 6 20 452
980 463 160 10 25 653
225 981 131 23 21 344
174 874 120 25 13 313
245 805 124 19 13 256
55 626 85 11 6 64
86 664 89 14 18 106
906 670 91 18 31 786
344 855 104 13 13 204
637 1,456 197 30 36 442
239 940 152 21 37 274
387 1,153 106 13 8 119
109 342 54 8 25 156
422 345 67 16 67 303
524 416 110 22 107 321
1,181 606 172 36 197 616
1,083 593 92 34 166 410
528 729 131 13 19 432
315 695 124 12 18 372
Pb Mn Ba Cr Cu Zn
ppm pm ppm ppm ppm ppm
175 555 83 9 9 134
740 583 105 16 14 397
4,278 591 106 16 11 904
64 654 56 7 4 41
164 648 129 17 15 139
318 810 78 9 9 176
205 637 108 12 13 202
27 526 66 9 5 45
767 644 109 15 21 367
1,397 694 105 14 13 585
485 609 137 15 12 324
308 632 106 12 17 190
439 704 124 12 11 247
547 961 124 27 56 281
739 825 159 21 23 399
305 786 163 18 11 360
248 902 127 20 19 192
381 705 134 20 21 335
1,706 732 133 17 18 458
1,324 849 202 20 19 452
511 913 122 22 33 295
1,778 670 60 30 71 1,238 864 882 119 29 60 939
1,144 835 144 27 36 664
750 797 135 24 35 404
397 1,210 127 24 25 332
174 1,219 133 18 16 189
126 1,080 101 19 13 159
328 1,257 133 21 17 327
1,478 944 96 33 98 412
826 1,082 214 16 31 368
238 930 109 12 17 556
369 824 158 15 16 1,565 833 1,112 157 23 129 673
468 869 114 17 36 240
922 2,321 156 34 52 847
458 923 126 16 34 370
Pb Mn Ba Cr Cu Zn
ppm pm ppm ppm ppm ppm
1,166 766 190 16 19 407
698 917 138 14 20 228
885 737 130 15 13 300
570 538 81 18 52 281
174 715 125 14 12 175
628 763 150 15 20 270
256 764 180 17 24 273
373 575 129 15 30 340
701 764 173 20 36 651
1,616 945 159 28 40 775
155 567 73 12 14 196
263 621 96 16 21 213
45 384 70 12 8 70
2,150 738 81 56 32 1,478 131 637 60 15 15 97
76 865 93 17 12 473
60 605 73 19 11 113
234 973 151 18 18 240
678 876 181 28 46 512
417 838 139 20 26 374
489 816 155 17 20 382
203 748 113 12 16 183
571 879 121 18 34 469
2,602 881 125 25 72 1,453 806 848 125 22 72 702
799 1,074 117 27 120 1,144 1,647 1,147 184 37 166 809
204 898 140 24 27 948
499 973 117 26 29 918
574 1,126 91 28 46 761
477 1,025 114 21 30 377
148 876 112 19 18 215
411 740 112 18 25 190
218 869 116 18 15 207
86 888 107 13 9 115
194 914 102 16 11 191
141 1,020 95 13 9 110
213 628 85 11 13 153
1,008 748 125 18 18 581
Pb Mn Ba Cr Cu Zn
ppm pm ppm ppm ppm ppm
538 757 142 18 15 323
248 762 104 16 22 185
180 608 109 13 8 103
5 352 72 10 8 29
109 509 79 11 6 151
295 736 138 13 15 194
220 619 82 12 17 131
91 522 45 11 7 146
312 465 44 11 54 429
26 488 63 15 21 192
171 492 60 10 10 275
281 444 54 16 84 581
68 428 43 9 5 133
357 465 42 11 9 465
213 401 40 9 5 394
209 534 39 7 6 398
299 555 38 8 17 348
276 763 63 15 15 189
185 504 108 14 13 275
359 580 134 17 24 337
331 639 94 15 18 232
179 726 64 12 20 151
95 539 81 12 6 118
162 504 91 11 5 155
178 506 68 16 15 171
104 528 64 10 4 147
178 683 85 13 16 130
82 601 86 12 10 115
138 767 91 14 51 358
107 709 109 12 9 138
92 692 78 14 27 246
121 667 105 16 15 151
345 616 119 20 43 350
321 585 115 18 25 406
361 531 134 20 16 411
269 530 101 16 29 231
38 544 68 10 5 66
100 614 81 13 7 127
Pb Mn Ba Cr Cu Zn
ppm pm ppm ppm ppm ppm
81 628 80 12 7 132
74 487 58 11 8 127
115 546 88 16 9 323
97 426 64 14 16 356
224 426 93 14 31 383
104 300 34 8 11 181
601 791 321 33 97 796
175 895 194 24 44 209
366 1,130 199 33 44 305
35 662 71 15 14 112
50 530 66 12 8 161
25 437 63 14 14 100
26 440 62 15 16 77
22 551 87 18 11 83
31 625 97 17 11 99
16 506 81 16 9 72
215 426 127 16 25 270
187 488 94 16 16 206
151 446 92 13 18 183
33 269 41 9 3 44
66 307 49 12 4 57
37 422 52 11 6 80
38 518 72 16 16 778
31 690 53 10 6 41
34 704 64 12 6 44
24 330 60 14 16 53
17 371 86 13 26 86
32 395 117 28 22 106
15 190 20 6 7 34
14 284 40 10 11 32
6 469 59 13 11 53
7 480 59 14 12 57
14 587 87 18 21 76
17 573 92 26 26 111
15 539 81 21 24 82
19 613 80 20 24 78
12 530 83 21 20 75
26 804 80 20 9 42
15 602 60 15 6 36
Pb Mn Ba Cr Cu Zn
ppm pm ppm ppm ppm ppm
16 337 80 18 8 59
19 357 81 20 11 57
42 354 57 16 8 73
29 357 55 14 10 64
34 424 62 17 8 71
11 825 75 21 18 77
13 430 56 48 29 84
16 392 41 13 13 52
26 402 110 20 13 69
74 636 95 19 12 236
31 833 76 21 17 105
31 765 75 22 17 111
29 816 80 19 13 52
14 485 93 22 21 72
26 490 105 22 26 81
17 594 127 24 29 78
89 516 75 15 9 89
82 669 83 14 8 79
45 645 71 16 7 79
90 852 101 18 8 112
37 878 89 15 5 65
34 571 59 14 7 62
60 579 66 11 6 67
28 357 34 9 5 67
28 498 44 9 4 82
15 296 40 14 5 78
12 508 93 19 24 78
11 691 121 25 20 81
13 634 122 20 38 87
6 359 45 12 10 51
9 537 72 11 8 48
42 260 66 14 6 80
623 700 147 18 32 267
18 249 53 12 7 47
19 294 60 14 8 226
18 184 80 15 8 72
29 222 122 29 27 120
26 1,020 126 20 18 108