An Analysis of MANET Routing Protocol Performance for an Interactive User
Engaging Quiz
Jordan Walton, Stewart Blakeway, Anna Kirpichnikova
Department of Mathematics and Computer ScienceLiverpool Hope University Liverpool, England
[email protected], [email protected], [email protected]
Abstract – A Mobile Ad-hoc Network is a flexible wireless network. The nodes also function as routers which determine and propagate the routing tables amongst their neighbours to ensure a destination can be reached in the network. Without the restraint of physical links, mobility is common; these connections are not necessarily constant, with nodes free to either leave or join the network. This paper presents an analysis of four routing protocols in relation to network performance. In particular, our analysis considers throughput, packet delivery fraction, and total number of packets received. Network Simulator 3 was used to simulate an environment and scenario based on an Interactive Quiz where data such as text, image and video is transmitted to participants of the quiz. 20 simulations with varying parameters, i.e. routing protocol and number of nodes show that DSDV is the most suitable protocol, managing 99.9% packet delivery regardless of number of nodes.
Keywords – mobile ad-hoc networks; routing protocols; AODV; DSDV; DSR; OLSR; MANET
I. INTRODUCTION
Networking technologies are seeing an ever-increasing presence in how we, as a people, view life. Over the last decade particularly, networking communication technology has become ingrained in mainstream society, rather than being relegated to usage only in large corporations as they once were. Nowadays, these technologies are made up of a massive infrastructure that supports up to millions of clients. In the specific case of the Internet itself, there are, as of 30th November 2015, 3,366,261,156 users; this represents a staggering growth of 832.5% since 2000 [1]. This is only possible due to evolution of the underlying Infrastructure over time. Despite this, some situations, in which there is no available infrastructure still have the need for communications; alternative technologies such as a Mobile Ad-hoc Network (MANET) can facilitate this. The common routing protocols in use with MANETs vary in performance dependent upon a wide range of conditions and the scenarios used. The most relevant studies to this research are those involving the impact of node density on the performance of routing protocols, notably the work seen in [2].
An “ad-hoc” network, as can be inferred from the name is a wireless network that is designed for a specific purpose, usually for a short duration. Thus, an ad-hoc network is required to be able to be deployed rapidly, and is often
reconfigured to incorporate necessary changes. Much of the early work on ad-hoc networks was supported by the Defense Advanced Research Projects Agency (DARPA), through their DARPA Packet Radio program [3].
A MANET is a collection of wireless devices, such as mobile phones and tablets, which are able to communicate between themselves directly without a centralised administrator. A self-sufficient system of mobile routers and hosts interconnected via wireless, a pre-defined physical infrastructure is not necessitated. The lack of a centralised administrator allows for the network to remain intact even following disconnection of one of the nodes when it leaves the range of the network or the power source is rendered depleted; MANET nodes can usually function as either host or router, unlike within traditional infrastructure-based networks.
It is significantly faster to deploy a MANET as a data communications network than it is to deploy a data communications network with a physical infrastructure. With this in mind, research and development of MANETs was furthered with the goal of having a system that can be deployed quickly in areas where a predefined infrastructure is unavailable, damaged beyond functionality, or insecure.
The purpose of the research being undertaken is to compare the available routing protocols for MANETs with the aim of determining the most appropriate routing protocol for an application that requires local audience participation. This research discusses four of the most popular routing protocols available for use in a MANET. Each of these protocols has been tested against a realistic scenario that models a user engaging quiz application. In particular, we increase the participant size to determine if the routing protocol is scalable or not. Data are accumulated from the testing output, and are compared using appropriate metrics, before future work that should be attempted is outlined.
II. LITERATUREREVIEW
A. MANET Routing Protocols
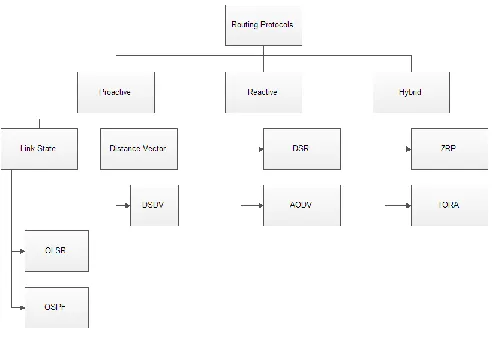
There has been a significant volume of research into comparing a wide range of MANET routing protocols, both in general and in relation to specific scenarios. Routing protocols are responsible for locating transmission links between wireless devices with the aim of packets reaching their destination. These protocols tend to fall under one of two groupings, proactive and reactive; a third group, hybrid, contains protocols that are a combination of both reactive and proactive in their implementation. Available protocols need to be reviewed in order to choose which are best suited for the simulations. Fig. 1 shows the classification of routing protocols for MANETs [4]. Other papers, and figures within, do make note of other protocols, such as Fisheye State Routing (FSR), High-availability Seamless Redundancy (HSR), Wireless Routing Protocol (WRP), and Zone-Based Hierarchical Link State (ZHLS), which are included in an expanded figure in [5]. Ultimately, focus was on Optimised Link State Routing Protocol (OLSR), Destination-Sequenced Distance-Vector (DSDV), Ad-Hoc On-Demand Distance Vector (AODV), and Dynamic Source Routing (DSR).
Figure 1. Routing Protocol Classification .
Proactive routing, also known as Table Driven Routing, Protocols manage their routing tables by making a never-ending stream of requests for update information from neighbours and sharing routing tables. This allows each node to have routes in place for every other node in the network. As such, transmission of data can be accomplished immediately, provided the route already exists. Where the route does not exist, packets are enqueued until such a time as the route to the corresponding destination has been received by the node [6]. The logical conclusion to be drawn from this functionality is that it would be better suited to smaller scale network topologies, as large, highly dynamic networks require substantial resources in order to maintain valid routing tables. The impact of node density, or number of nodes, on MANET routing protocols is discussed in [2], but the researcher opted to focus on three protocols, DSR, AODV, and TORA; both DSDV and OLSR protocols were
neglected. Despite this, the performance metrics utilised, Packet Delivery Fraction, Average End-to-end Delay, Packet Dropped, Routing Load, and Throughput, make logical sense for analysing the results of the simulations carried out in order to evaluate the performance of each protocol.
In [7] useful information is provided that can be applied to any research into routing protocols; their focus is on a modified AODV protocol of their own design. In their review, common parameters were outlined, though focusing on a larger scale mobility model with movement. The scenario here contrasts with that so these values are of little use. However, the explanation of Packet Delivery Fraction and Throughput in the paper is useful. Three control packets establish and manage the MANET routes; Route Request (RREQ), Route Reply (RREP), and Route Error (RERR). These packets are sent in a user datagram packet, chosen due to it being efficient; the application, however, must account for any errors such as undelivered packets, as UDP does not provide a mechanism for dealing with this. Each protocol utilizes these control packets to maintain routes differently.
B. AODV Routing Protocol
The design of AODV reduces overhead on traffic in order to more readily facilitate scalability. In a way similar to the DSR protocol, destination sequences enable it to calculate new routes. The process of route discovery involves the source broadcasting RREQ packets. RREQ gets the initial route from source to destination, being broadcast to all devices, expanding the transmission area until the correct destination, or a node with knowledge of the destination, is located and a RREP packet is sent on the reverse path to the initial sender. This process is shown in more detail within [8]. The AODV protocol is further explained in RFC3561 [9].
C. DSDV Routing Protocol
DSDV, a proactive protocol, determines routes by flooding the network with RREQ packets, affecting the available resources of each node as outlined in [10]. Each host manages a table of its neighbours and distance to the destination node. The age of a route is determined through sequence numbers that are increased upon every update. Hosts will repeatedly broadcast routing tables to ensure an up to date selection of routes. The DSDV protocol is further explained in [11].
D. DSR Routing Protocol
E. OLSR Routing Protocol
OLSR uses multipoint relays (MPR) to negate the need for total flooding of the network. An MPR is a selected router for forwarding broadcast messages during flooding; each only declares a portion of their neighbours, reducing the size of these broadcast messages. One issue with OLSR is that these intermediary routers result in a route that may not necessarily be the shortest [4]. OLSR uses four message types: hello, topology control, multiple interface declaration, and host and network association. Hello messages sense neighbouring nodes, topology control messages provide for topology declarations, Multiple Interface Declaration (MID) messages declare interfaces, and Host and Network Association (HNA) messages declare host and network information. The OLSR protocol is further defined in RFC3626 [14].
III. DESIGN
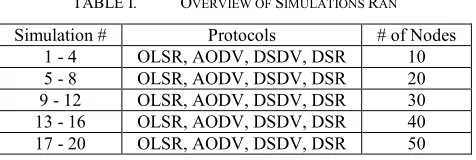
In order to evaluate network performance and draw comparisons between four common routing protocols, AODV, OLSR, DSDV, and DSR, two each of reactive and proactive protocols, simulations were carried out of a MANET being used for player participation in a quiz, see table I.
TABLE I. OVERVIEW OF SIMULATIONS RAN
Simulation # Protocols # of Nodes
1 - 4 OLSR, AODV, DSDV, DSR 10
5 - 8 OLSR, AODV, DSDV, DSR 20
9 - 12 OLSR, AODV, DSDV, DSR 30
13 - 16 OLSR, AODV, DSDV, DSR 40
17 - 20 OLSR, AODV, DSDV, DSR 50
The idea is for participants to partake in the quiz through a wirelessly linked mobile devices. The idea of the local player participation provided the variables needed to run different simulations, and the flexibility in number of participants lends itself well to also comparing the effect of node density. To simulate different sized audiences, the number of nodes will be scaled up as simulations for each protocol progress. In each instance, one node served as destination node, emulating the quiz host.
Due to the relative proximity of participants in a quiz compared to the needs of scenarios others have tested, there was no reason to use a transmission range on the same scale (hundreds of meters squared) as prior research; a much more restricted range of 10m x 15m was fit for purpose. While other scenarios have consisted of moving nodes, it is assumed that participants will be spaced equally, in a grid-like layout, for this scenario. The scenario consisted of 660-second simulations, emulating a round in a quiz, to ensure the networks had been running long enough to produce suitable results. The first 50-60 seconds served as the stabilisation time for the network. Table I shows each combination of protocol and nodes that were simulated as part of this scenario.
IV. METHODOLOGY
Research has shown that despite there being no standardised simulation software, Network Simulator ns-2 is a popular choice, being used in [8], [15], and [16], amongst others. There is a clear lack in testing with simulations carried out using Network Simulator ns-3, though this is due, at least in part, to ns-3 lacking many of the modules available in ns-2. New versions of ns-3 are released quarterly, ensuring a stable environment or simulations, a necessity for simulations that will be required to run hours at a time. There is hesitance from researchers when it comes to adopting Network Simulator ns-3; ns-2 is a common sight in research papers, despite the availability of the completely rewritten software.
Ns-3 is advantageous in it being faster and more stable than ns-2, while receiving ongoing support. One of the bigger gaps in research, embracing the ns-3 software will encourage development of the necessary modules and bring ns-3, along with its improvements, in line with the functionality of ns-2. This is similar to the real life implementation of IPv4 and IPv6; migration has been delayed and the life of IPv4 prolonged by stop-gap measures to avoid compatibility issues and the necessity of infrastructural overhauls. With support for the four common routing protocols, AODV, DSDV, DSR, and OLSR, ns-3 meets the needs of the research herein.
The scenario outlined in the previous section was implemented through modification of freely available code [17]. The wealth of data exported by this code provided suitable data for analysis after implementing the scenario, though some additional forms of data output were added to complement these, notably animation.xml files, for use in NS-3’s Network Animator software, and Wireshark pcap files. A trace and callback were added to the Application Layer in order to monitor the generating of packets within the network.
In order to facilitate unattended running of simulations, the code was altered in order to automate the process of setting up and carrying out the simulations alongside exporting the data into suitable sub-folders. The code cycles through the simulations, from 1 to 20, as part of the main method, though this has circumvented the command line options. Sockets are created between node 0 and every subsequent node.
A. Performance Metrics
In order to determine which protocol is most efficient, the data outputted by the simulation was analysed and specific metrics were compared. Although traceroutes provide an abundance of captured data from the simulated networks, the specifically chosen data exported to a comma-separated-value file provide the necessary data for the creation of the figures in the results section. These data allow for comparisons in terms of performance. Extrapolation of multiple metrics is facilitated for drawing conclusions regarding choice of routing protocol.
refers to the total number of successfully transferred bytes to all nodes that make up the network. For this research, the Average Throughput per Second was used to draw conclusions. Total Percentage Packets Received refers to the percentage of packets received overall out of all packets sent.
B. Simulation Parameters
Table II details the parameters used to carry out the simulations using the four protocols. The destination node parameter specifies which node the others send data to. These parameters enable the research herein to be replicated.
TABLE II. SIMULATION SETTINGS
Parameter Value
Simulation Area 10m x 15m Simulation length 660 seconds
Nodes 10, 20, 30, 40, 50 Data Rate 2048bps Packet Size 64 bytes Start Delay Between 50 and 60 seconds Transmission Power 7.5
Mobility Model Constant Position Mobility Model PhyMode DsssRate11Mbps Type of Packet UDP Destination Node Node 0
V. RESULTS
A. Packet Delivery Fraction
For each value for nodes, the PDF each second was plotted on a line graph comparing all four routing protocols. Two of the protocols are represented by dashed lines in order to facilitate comparison between overlapping packet delivery fractions. Simulation seconds 79 through 171 and 226 onwards are constant, and therefore omitted.
Fig. 2 shows the fraction of sent UDP data packets that were received by destination nodes in each second of the simulation for each of the four routing protocols.
Throughout the 660 second simulation, both OLSR and DSR routing protocols maintained a PDF of below 1, approximately 0.9, for most of the runtime; DSR did start at 1, but hastily declined. Meanwhile, AODV and DSDV protocols maintained a PDF of 1 for most of the simulation; DSDV did take a few seconds longer to reach this value, while AODV fluctuated once early in the simulation. For local player participation involving 10 nodes, either AODV or DSDV would be suitable, with DSDV stabilisation taking longer, but AODV fluctuating on one occasion.
Figure 2. Packet Delivery Fraction (10 nodes).
Throughout the 660 second simulation, both OLSR and DSR routing protocols maintained a PDF of below 1, approximately 0.9, for most of the runtime; DSR did start at 1, but hastily declined. Meanwhile, AODV and DSDV protocols maintained a PDF of 1 for most of the simulation; DSDV did take a few seconds longer to reach this value, while AODV fluctuated once early in the simulation. For local player participation involving 10 nodes, either AODV or DSDV would be suitable, with DSDV stabilisation taking longer, but AODV fluctuating on one occasion.
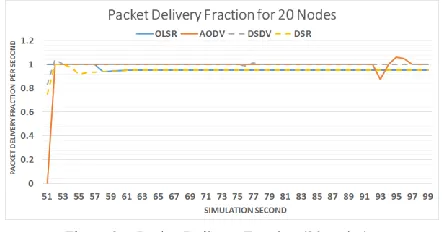
Fig. 3 shows the fraction of sent UDP data packets that were received by destination nodes in each second of the simulation for each of the four routing protocols. Simulation seconds 100 onwards are effectively constant and are therefore omitted.
Figure 3. Packet Delivery Fraction (20 nodes).
OLSR started off with a PDF of 1, before quickly dropping and maintaining a value of 0.95 except for one fluctuation near the end of the simulation. AODV managed a PDF of 1 for most of the simulation, aside from an early fluctuating around 95 seconds in. DSDV fluctuated in the first couple seconds of the simulation after packets began sending, but managed to maintain a value of 1 onwards, aside from one minor decrease around 537 seconds in and one minor increase around 609 seconds in. DSR maintained a value of 0.95 for almost all of the simulation after stabilising over a longer period of time than the other protocols. For a local participation scenario involving 20 nodes, the DSDV protocol is the most suitable, managing a near-constant PDF of 1.
Fig. 4 shows the fraction of sent UDP data packets that were received by destination nodes during seconds 51 through 186 of the simulation for each of the four routing protocols.
For the remainder of the simulation, values remained constant. OLSR managed to operate with a PDF of 0.9667 for most of the simulation; this is better than the 0.95 achieved with fewer nodes. AODV, while operating with a PDF of 1 for most of the simulation, experienced significant fluctuation over the first 200 seconds, dropping as low as 0.625. DSDV, again, maintained an almost constant PDF of 1, with only very minor and rare changes. DSR, like OLSR, achieved a value of 0.9667, an improvement over its performance with fewer nodes. For a local participation scenario involving 30 nodes, the DSDV protocol proves to be most suitable, with its almost constant perfect PDF.
Fig. 5 shows the fraction of sent UDP data packets that were received by destination nodes in each second of the simulation for each of the four routing protocols. Simulation seconds 243 through 411, and 468 onwards are near-constant and have been omitted.
Figure 5. Packet Delivery Fraction (40 nodes).
OLSR saw another marginal increase in PDF over the simulations with fewer nodes; with 40 nodes it managed 0.975. AODV saw an increase in how erratic its PDF was, but still managing a value of 1 for the most part. DSDV still manages a PDF of 1 for most of the simulation, fluctuating only slight on occasion; analysis of the raw data showed that on these occasions, one packet would be received in the second after that in which it was transmitted. DSR joined OLSR in achieving a PDF of 0.975 for most of the simulation. OLSR did not achieve this value as quickly, hitting 0.882 in the first second of activity. For a local participation scenario involving 40 nodes, the DSDV protocol proved most effective, with a PDF of 1 for the most parts with fluctuations involving only one packet.
Figure 6. Packet Delivery Fraction (50 nodes).
Fig. 6 shows the fraction of sent UDP data packets that were received by destination nodes in each second of the simulation for each of the four routing protocols. Simulation seconds 191 through 411 have been omitted as they are constant. OLSR achieved a 0.98 PDF, after starting off at a value of 1. The performance of AODV continued to deteriorate, with more fluctuation in PDF, hitting a new low of 0.295 on two occasions. DSDV maintained PDF of 1 for most of the first 447 seconds, excluding a couple occasions in which one packet was received late. However, in the final 200 seconds of the simulation, the DSDV protocol exhibited some new behaviour, with low points of 0.0875 and high points of 1.11. DSR managed a near-consistent 0.98 PDF, edging even closer to that desirable value of 1.
For a local participation scenario involving 50 nodes, the DSR protocol seems to be the most suitable, but despite the erratic behaviour, DSDV is more appropriate as DSR ensures less than 99% of packets reach their destination; DSDV still manages 99.9% successful transmission of packets.
B. Throughput
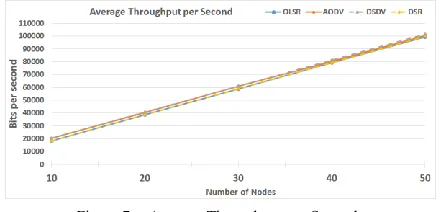
Fig. 7 shows average throughput per second, in bits per second, of the four routing protocols for simulations featuring 10, 20, 30, 40, and 50 nodes. This shows that all four protocols can handle the increased data transfer in increasingly larger networks up to 50 nodes, but DSDV manages a marginally higher throughput compared to the other three.
Figure 7. Average Throughput per Second.
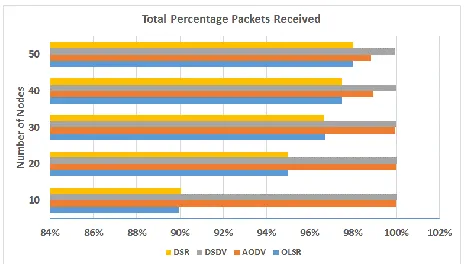
C. Total Percentage Packets Received
Figure 8. Total Percentage Packets Received
VI. CONCLUSION AND FUTURE WORK
Although OLSR achieved consistent packet delivery fractions, the total percentage packets received was considerably less than other routing protocols; for 10 nodes, over 10% of packets were not received. Likewise, DSR, managed consistent packet delivery fractions but sizable total received packet losses. AODV becomes less efficient as the number of nodes is increased, struggling to receive packets in a timely manner, and outright losing an increasing number of packets. DSDV, although usually seen as creating unnecessary overhead, manages a consistent performance in the simulations for this scenario. As DSDV floods the network with RREQ packets, and the network is designed for all of the nodes representing participants to send packets to one node representing the quiz host, it is increasingly likely a node with the destination in its routing table will be found quickly.
Results were similar for the throughput of all four protocols, DSDV leading by a margin, but it was already looking to be the case that DSDV would be the most suitable following analysis of its packet delivery fraction performance. Taking everything ascertained from this research into consideration, it is therefore apparent that the DSDV protocol is that which is most suited to implementation in a MANET being used for local user interaction in a quiz, assuming it falls within the range of nodes tested herein. This may not scale up effectively to significantly larger networks, however.
There are several areas in which future research could be carried out in order to further the results of this paper. It would be beneficial to repeat the simulations for longer periods of time, and with a far wider range of node densities to determine how the routing protocols perform for larger scale player participation, such as that found in a TV show audience that could extend into the hundreds. DSDV protocol showed a change in behaviour in a network containing 50 nodes; further research into how DSDV reacts with larger networks would help to ascertain whether this would have significant impact on the potential deployment for TV show audiences. Doing this would provide more data to support conclusions drawn in the results, or potentially require new conclusions to be drawn.
REFERENCES
[1] "World Internet Users Statistics and 2015 World Population Stats", Internetworldstats.com, 2016. [Online]. Available: http://www.internetworldstats.com/stats.htm. [Accessed:15- Mar- 2016].
[2] N. Adam, M. Ismail and J. Abdullah, "Effect of node density on performances of three MANET routing protocols", 2010 International Conference on Electronic Devices, Systems and Applications, 2010. [3] M. Gerla, C. Chiasserini, K. Mase, E. Modiano and J. Redi, "Mobile
ad hoc wireless networks", Journal of Communications and Networks, vol. 6, no. 4, pp. 291-294, 2004.
[4] M. Rajeswari, P. Maheswari, S. Bhuvaneshwari and S. Gowri, "Performance analysis of AODV, DSR, TORA and OLSR to achieve group communication in MANET", 2012 Fourth International Conference on Advanced Computing (ICoAC), 2012.
[5] A. Tuteja, R. Gujral and S. Thalia, "Comparative Performance Analysis of DSDV, AODV and DSR Routing Protocols in MANET Using NS2", 2010 International Conference on Advances in Computer Engineering, 2010.
[6] A. Gupta, H. Sadawarti and A. Verma, "Performance analysis of AODV, DSR & TORA Routing Protocols", International Journal of Engineering and Technology, vol. 2, no. 2, pp. 226-231, 2010. [7] A. Bamhdi and P. King, "Performance evaluation of
Dynamic-Power AODV, AOMDV, AODV and DSR protocols in MANETs", 2013 International Conference on Smart Communications in Network Technologies (SaCoNeT), 2013.
[8] Q. Razouqi, A. Boushehri, M. Gaballah and L. Alsaleh, "Extensive Simulation Performance Analysis for DSDV, DSR and AODV MANET Routing Protocols", 2013 27th International Conference on Advanced Information Networking and Applications Workshops, 2013.
[9] C. Perkins, E. Belding-Royer and S. Das, "Ad hoc On-Demand Distance Vector (AODV) Routing", Ietf.org, 2003. [Online]. Available: https://www.ietf.org/rfc/rfc3561.txt. [Accessed: 21- Apr- 2016].
[10] S. El Khediri, N. Nasri, A. Benfradj, A. Kachouri and A. Wei, "Routing protocols in MANET: Performance comparison of AODV, DSR and DSDV protocols using NS2", The 2014 International Symposium on Networks, Computers and Communications, 201 [11] C. Perkins and P. Bhagwat, "Highly dynamic Destination-Sequenced
Distance-Vector routing (DSDV) for mobile computers", ACM SIGCOMM Computer Communication Review, vol. 24, no. 4, pp. 234-244, 1994.
[12] D. Som and D. Singh, "Performance Analysis and Simulation of AODV, DSR and TORA Routing Protocols in MANETs", International Journal of Recent Technology and Engineering, vol. 1, no. 3, 2012.
[13] D. Johnson, Y. Hu and D. Maltz, "The Dynamic Source Routing Protocol (DSR) for Mobile Ad Hoc Networks for IPv4", Ietf.org, 2007. [Online]. Available: https://www.ietf.org/rfc/rfc4728.txt. [Accessed: 21- Apr- 2016].
[14] T. Clausen and P. Jacquet, "Optimized Link State Routing Protocol (OLSR)", Ietf.org, 2003. [Online]. Available: https://www.ietf.org/rfc/rfc3626.txt. [Accessed: 21- Apr- 2016]. [15] Q. Razouqi, A. Boushehri, M. Gaballah and L. Alsaleh, "Combined
traffic simulation scenarios performance investigation routing protocols AODV, DSR and DSDV in MANET", 2012 8th International Computer Engineering Conference (ICENCO), 2012. [16] G. Vijayavani and G. Prema, "Performance comparison of MANET
routing protocols with mobility model derived based on realistic mobility pattern of mobile nodes", 2012 IEEE International Conference on Advanced Communication Control and Computing Technologies (ICACCCT), 2012.