1364
Received: 2 May 2016 Revised: 4 October 2016 Accepted article published: 12 October 2016 Published online in Wiley Online Library: 14 December 2016
(wileyonlinelibrary.com) DOI 10.1002/ps.4456
Use of an individual-based simulation model
to explore and evaluate potential insecticide
resistance management strategies
Russell Slater,
a*
Pierre Stratonovitch,
b
Jan Elias,
a
Mikhail A Semenov
b
and Ian Denholm
c
Abstract
BACKGROUND: Tools with the potential to predict risks of insecticide resistance and aid the evaluation and design of resistance management tactics are of value to all sectors of the pest management community. Here we describe use of a versatile individual-based model of resistance evolution to simulate how strategies employing single and multiple insecticides influence resistance development in the pollen beetle,Meligethes aeneus.
RESULTS: Under repeated exposure to a single insecticide, resistance evolved faster to a pyrethroid (lambda-cyhalothrin) than to a pyridine azomethane (pymetrozine), due to difference in initial efficacy. A mixture of these compounds delayed resistance compared to use of single products. The effectiveness of rotations depended on the sequence in which compounds were applied in response to pest density thresholds. Effectiveness of a mixture strategy declined with reductions in grower compliance. At least 50% compliance was needed to cause some delay in resistance development.
CONCLUSION: No single strategy meets all requirements for managing resistance. It is important to evaluate factors that prevail under particular pest management scenarios. The model used here provides operators with a valuable means for evaluating and extending sound resistance management advice, as well as understanding needs and opportunities offered by new control techniques.
© 2016 Society of Chemical Industry
Keywords:insecticide resistance; individual-based modelling; computer simulation; resistance management; pollen beetle;Meligethes aeneus; insecticide mixtures
1
INTRODUCTION
Although insecticides and acaricides remain essential for control-ling arthropod pests of arable and horticultural crops, the evo-lution of insecticide resistance is a continuing threat to their sustainability and profitability. The loss of single compounds or even entire insecticide groups to resistance can have a significant impact on the productivity of an agricultural system,1especially
without access to alternative control agents. Even if alternatives are available, these may be less favourable or more costly to apply, impacting on the environmental footprint and/or economic sus-tainability of crop protection. Development of resistance is also a major challenge to the agrochemical industry.2The cost of taking a
new insecticide from the laboratory to the marketplace is currently estimated at US $250 million.3This investment has to be recovered
and, although resistance to any product can be expected at some point, the more time that elapses before significant levels of resis-tance occur, the greater the likelihood of profitability. All sectors of the agricultural industry therefore have a strong vested inter-est in being able to anticipate the relative risk of resistance under contrasting pest management scenarios.
Whenever feasible, it is widely agreed that insecticide resistance management (IRM) tactics should be tailored to conditions of a particular agricultural system and region.4,5However, in any given
scenario there is a complex interaction of factors influencing resis-tance, which relate to pest biology and crop agronomy, as well as environmental conditions, pesticide dynamics and the mode of application.4,6,7There are generic guidelines or tactics that can
underpin any IRM strategy, such as those recommended by the Insecticide Resistance Action Committee (www.irac-online.org/ about/resistance/management/), but the most effective strategies will benefit from a detailed knowledge of pest population dynam-ics, the range of control options available (chemical, biological and physical) and the prevailing agricultural landscape. Optimization
∗ Correspondence to: R Slater, Syngenta Crop Protection AG, Research Biology,
Werk Stein, Schaffhauserstrasse, Stein, Switzerland. E-mail: [email protected]
The copyright line for this article was changed on 24 January 2017 after original online publication.
a Syngenta Crop Protection AG, Research Biology, Stein, Switzerland
b Computational and Systems Biology Department, Rothamsted Research, Harp-enden, UK
1365
of IRM can also undoubtedly exploit information on theproper-ties of any resistance mechanisms already known to exist, such as potency, cross-resistance patterns, inheritance and potential fit-ness costs.6,8However, proactive implementation of IRM is much
more likely to prolong the efficacy of insecticides than a reac-tive approach once resistance has been detected in the field.4The
advantages of proactive IRM have been amply demonstrated by the implementation of measures for combating resistance to crops expressing insecticidal proteins.9
Empirical comparisons of the effect of different control strategies on resistance are severely hampered by the large spatial and tem-poral scales needed to measure the relevant selection responses10
and the level of replication needed to encompass the stochas-ticity or noise inherent in biological systems. For this reason, resistance researchers have exploited a range of mathematical models and computer simulations to predict the appearance of resistance under contrasting scenarios of pest biology and insec-ticide deployment.11,12The majority of these studies have been
deterministic simulations exploring the impact of specific factors such as the initial frequency or dominance of resistance alleles or insecticide persistence on the speed of selection.13–15Others
have explored the effectiveness of exploiting two or more insecti-cides in alternation, as mixtures or in spatial mosaics.4,16–19Such
work has been invaluable for disclosing broad principles but has rarely been directed at specific pest/crop/pesticide combinations. In addition, most modelling approaches have failed to incorporate the impact that individual behaviour and spatial heterogeneity can exert on population and resistance dynamics. Such limita-tions and the assumplimita-tions made have restricted the applicability of resistance modelling to resolving specific pest management problems.20
Advances in computing power and underlying theory pro-vide access to newer and more realistic simulations adopting an individual-based approach.21 We have therefore developed an
individual-based model (IbM) that enables pest populations to be modelled as an assemblage of individual insects inhabiting a spatially structured landscape made up of farmers’ fields and semi-natural habitats in order to simulate the different control strategies and their impact on the evolution of resistance.22This
model has initially been parameterized to investigate control of pollen beetle (Meligethes aeneus), an important pest of oilseed rape (OSR) in the UK and elsewhere in Europe. We report here on the use of this model to simulate the outcome of potential IRM tac-tics employing single and multiple insecticides, usingM. aeneus inhabiting OSR to exemplify the application and outcomes of this modelling approach.
2
MATERIALS AND METHODS
2.1 Background to the model and its application toMeligethes aeneus
Meligethes aeneusis one of a suite of insect pests that attack OSR (Brassica napus L.) throughout its growing season in Europe.23
In the UK it infests rape in the spring and early summer, and is a major target of spring-applied pesticides on this crop. Adults emerge from overwintering sites in early spring, feed on pollen from a taxonomically diverse range of plants, and then migrate to winter OSR crops where they mate and lay eggs in the flower buds.23,24 Oviposition and feeding damage by adults
and first-instar larvae within the bud results in bud abscission and loss of yield.25Backward winter-sown crops and those sown
in the spring are at greatest risk, as the growth stages most
susceptible to damage byM. aeneus occur after beetles have emerged from overwintering and are seeking oviposition sites. From late June a new generation of adults feeds on pollen from open flowers before moving to overwintering sites without mating.24
For many years, pyrethroid insecticides were used almost exclusively to control M. aeneus, leading to the widespread appearance of resistance to these chemicals. Resistance was first reported in mainland Europe in the early 2000 s26,27 and has
since spread rapidly through most rape-growing countries in Europe, including the UK.28The primary mechanism of pyrethroid
resistance involves enhanced detoxification of insecticides by an over-produced P450-dependent monooxygenase enzyme,29
although a second mechanism based on modification of the pyrethroids target site has also been reported.30 In response to
pyrethroid resistance, a number of alternative chemicals with distinct modes of action have been made available, including the pyridine azomethine insecticide pymetrozine.31 The challenge
now presented to OSR growers is how to ensure economically viable pest control, while planning for long-term sustainability through resistance management.
Construction of the IbM and its parameterization to simulate the population dynamics and control of M. aeneushave been described in detail by Stratonovitchet al.22The model generates
a heterogeneous landscape divided into cells, each of which is assigned to a particular crop or habitat type. ForM. aeneus, the cells contain host plants (i.e., OSR) and non-host plants (e.g., cereals) in proportions representing common cropping practice in eastern UK. Sowing dates and crop phenology for winter-sown and spring-sown rape simulate UK farming practice and exploit published models of crop development. Within the crop cells, OSR is planted every 4 years in rotation with crops not supportingM. aeneus. In keeping with current growing practice in the UK, 95% of the OSR crop is sown in winter, and the remaining 5% is sown in spring.
Life history parameters forM. aeneusare extracted from pub-lished sources (see Stratanovichet al.22 for references).
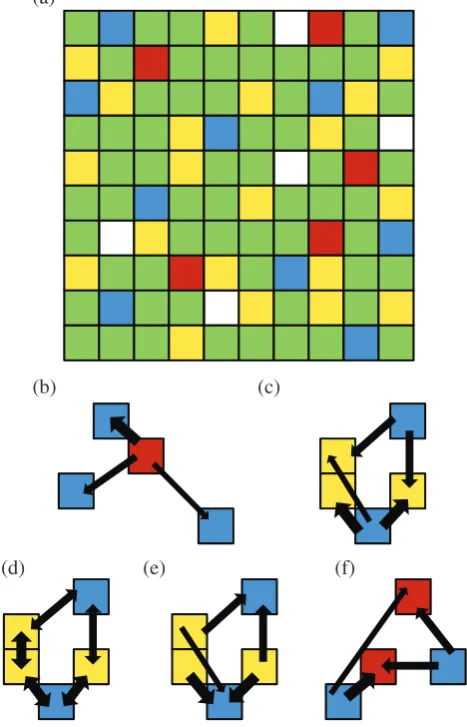
Applica-tion of insecticide leads to an enhanced mortality profile for adults defined using the probability of exposure, the degrada-tion profile curve of the compound(s) and the genotype of the insect. Other cells contain hibernation sites (e.g., woodland) and sites with semi-natural habitats containing non-crop food plants. Before and after hibernation, the probability of movement ofM. aeneusfrom and to overwintering sites, and between crop and non-crop hosts during the growing season, are determined by its life cycle and host preference, and the distance between cells in a landscape.22Figure 1 shows a representative 10×10 cell
land-scape and patterns of movement within the grid at different points in time.
1366
(a)
(b)
(c)
(d)
(e)
(f)
Figure 1. Schematic representation of the spatial dynamics of pollen beetles in a simulated agricultural landscape. (a) A representative 10×10 cell landscape with habitats in the same proportions as used in the IbM simulations. Cells containing arable crops are shown in yellow (oilseed rape [OSR]) or green (non-host crops such as cereals), overwintering sites are in red, refuge areas in blue and empty cells in white. Parts (b)–(f ) use subsets of this landscape to illustrate five stages in spatial dynamics as the season progresses: (b) emergence from hibernation and movement from overwintering sites to early-flowering refuge plants; (c) movement from refuge plants to OSR at the onset of crop flowering; (d) movement between refuge plants and OSR cells during the crop flowering season; (e) movement from OSR to late-flowering refuge plants; and (f ) movement back to overwintering sites and the onset of hibernation. The width of arrows represents the extent of movement as a function of distance between cells.
2.2 Calibration of insecticide efficacy and the potency of resistance
Data were provided by Syngenta from 48 independent trials on the efficacy of lambda-cyhalothrin and pymetrozine againstM. aeneusconducted in 10 countries. In these trials, a proportion of plots were treated with either lambda-cyhalothrin or pymetrozine at their respective field application rates and the remaining control plots were left untreated. The control achieved using each of the insecticides was determined by counting insects at regular intervals post treatment and calculating the reduction in numbers relative to control plots. In the absence of resistance, the average control achieved the day following initial treatment with lambda-cyhalothrin was 92%. However, some trials were done in areas known from monitoring programmes to harbour
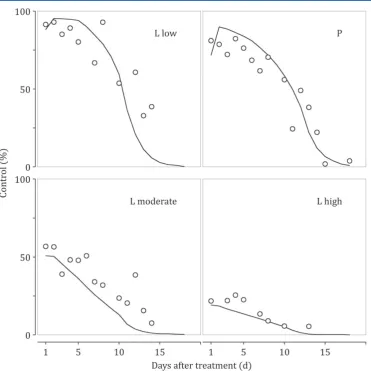
pyrethroid-resistant insects. These showed initial efficacy as low as 25% in some cases. The modified mortality schedules were used to derive response curves for resistant as well as susceptible phenotypes. The average control achieved the day after treatment with pymetrozine was consistently∼80%, wholly attributable to lower intrinsic efficacy than lambda-cyhalothrin at equivalent field concentrations, since no resistance has been reported to this ticide. Parameters describing the degradation profile of the insec-ticides and their respective effects onM. aeneuspopulations were calibrated from field trial data using an evolutionary algorithm with self-adaptation.22Observed and simulated levels of efficacy
of the two insecticides are shown in Fig. 2. For lambda-cyhalothrin, the parameters included the persistence of the insecticide and the observed responses of susceptible and resistant phenotypes. The calibration exercise showed resistance to lambda-cyhalothrin to be incompletely dominant in expression. For pymetrozine, parameters included the persistence of the insecticide and the observed response of the susceptible phenotype. The potency and dominance of pymetrozine resistance are assumed to be equivalent to values derived for resistance to lambda-cyhalothrin. When used in combination, the insecticides are assumed to show an additive effect on toxicity againstM. aeneus.
Thresholds for the application of insecticide were based on the current UK threshold of 15 insects per plant and 5 insects per plant, respectively. Unless otherwise stated, the starting frequency of each resistance allele was set to 10−5.
2.3 Design and conduct of simulations
In order to compare the outcome of different pest management scenarios, it was necessary to define a quantitative threshold at which resistance was deemed to be established, and ways of representing the variation in the outcome of repeat runs caused by stochastic features of the model. For each simulation, the speed of resistance development was defined as the number of years (y) for the resistance allele to reach a frequency of 30%. The choice of this figure was based on the fact that with a dominant resistance trait this corresponds to equal proportions of susceptible and resistant phenotypes, the latter consisting of both homozygous and heterozygous genotypes. At this stage, control after treatment with lambda-cyhalothrin or pymetrozine is reduced to less than half the initial efficacy, i.e. 44% and 37%, respectively. At these frequencies, the efficacy of a mixture of both compounds applied at their recommended field rates is decreased to 67%.
Utilizing data for lambda-cyhalothrin and pymetrozine, the IbM was used to simulate a set of pest management scenarios poten-tially available to farmers and to compare timeframes for resistance development. Each simulation used the same parameters describ-ing the life cycle ofM. aeneusand OSR agronomy, and used the same proportions of landscape features. Each scenario was repeat-edly run under different conditions in order to assess its robustness and potential for delaying resistance. An initial analysis of the model’s sensitivity showed weather, especially daily minimum and maximum temperatures, to be an important source of variation.22
Both plant and insect phenology are regulated by climate, as are the pest density and the time of crop colonization. To incorporate climatic variation, six sets of 50 years of daily weather data were generated for two locations in England (Rothamsted in Hertford-shire and Brooms Barn in Suffolk) using the Long Ashton Research Station Weather Generator.32Another important factor identified
1367
Figure 2.Observed and simulated levels of efficacy (relative to untreated controls) obtained with lambda-cyhalothrin (L) and pymetrozine (P) as a function of time since sprays were applied. For lambda-cyhalothin, results are presented separately for regions where levels of resistance to this compound were judged to be low, moderate or high. No resistance is recorded to date for pymetrozine. Open circles show observed mean levels of control from pooling data from the respective field experiments. Solid lines show the mean predicted level of control from ten simulations of the field trials with 5000 insects randomly distributed in the trial plots.simulations that follow, the proportions of different landscape fea-tures were kept constant at: fields (host and non-host crops), 80%; overwintering sites, 5%; refuge areas with alternative untreated host plants, 10%; and empty cells with features irrelevant to the biology ofM. aeneus, 10%. However, four spatial arrangements with these proportions were randomly generated. Finally, two dif-ferent values were used to initialize the internal random generator used by the model. Thus, for each scenario that was simulated, there were 2 geographical locations×6 weather datasets×4 landscape arrangements×2 random initializations=96 runs from which a distribution of outcomes was computed.
For each scenario, a probability distribution ofyvalues was gen-erated from the 96 runs described above. In simulations involving use of both compounds, distributions ofyvalues are shown for each resistance allele. In the case of the mixture, distributions ofy for individual alleles give a more conservative estimate of the loss of efficacy, which remains below 50% until the proportion of indi-viduals with a doubly resistant phenotype reaches 50%. To reach such levels, if one allele frequency is at 30% the other allele fre-quency needs to be at least at 65%.
For each set of simulations, 48 years of weather data were available to run the simulation because the model needed 2
years to initialize the crop rotations and the pest population. Thus simulations were run for a maximum of 48 years and each value ofywas constrained between 0 and 47. If the frequency of an R allele was still below 30% at the end of the simulation, itsyvalue was set to 47 because there is no practical interest in longer timespans. This enabled such simulations to be included in the results alongside those that reached the threshold frequency within the time limit.
3
RESULTS
3.1 Baseline scenarios
Three baseline scenarios compare the rate of resistance devel-opment with exclusive use of lambda-cyhalothrin (scenario L0),
pymetrozine (P0) and the combination (L+P0), all at the full
1368
Figure 3.Box plots of the probability distribution of years for the frequency of a resistance allele to reach 30% under three baseline treatment regime: sole use of lambda-cyhalothrin (L0), sole use of pymetrozine (P0) and sole
use of a mixture of these insecticides (L+P0). For the mixture regime,
results are shown for alleles conferring resistance to lambda-cyhalothrin (L+P0/L) or pymetrozine (L+P0/P), respectively. Box boundaries show
25th and 75th percentiles, vertical whiskers show maximum and minimum values, and the think horizontal line shows the median value. Each simula-tion is based on 96 runs.
to reach the 30% threshold compared to the single compound scenarios. These baseline responses provided reference points for evaluating the outcome of subsequent simulations.
3.2 Initial allele frequency
Simulations summarized in Fig. 4 extend the baseline mixture sce-nario (L+P0) to cases when the initial frequency of the allele
con-ferring resistance to lambda-cyhalothrin varied from 10−6to 10−1
(10−5being the baseline value). In all cases the initial frequency
of the pymetrozine resistance allele is maintained at 10−5. For
both compounds, the speed of resistance development increased in a linear manner with an increase in the starting frequency of pyrethroid resistance. With lambda-cyhalothrin, use of the mixture continued to afford at least a slight advantage over the single-use scenario (L0) until the starting frequency exceeded 10−3.
There-after, resistance became established faster than under the baseline L0regime. Selection of the pymetrozine resistance allele by a
mix-ture was slower at all starting frequencies of pyrethroid resistance than under the baseline pymetrozine use scenario (P0). Thus, with
the present assumptions, the advantages of a combination treat-ment are optimized when resistance to both ingredients is still very rare and become quickly compromised with more frequent resis-tance even to only one component of the mixture.
3.3 Mixtures, alternations and mosaics
Simulations summarized in Fig. 5 represent the three primary approaches for deploying two structurally and functionally dis-tinct compounds as part of a resistance management programme. Mixing the compounds, alternating them over time and applying them singly across a spatially structured mosaic all delayed resis-tance compared to sole reliance of single products. For alternation tactics, the order in which compounds are advocated for use within a growing season was shown to be an important determinant of the speed of resistance development. This reflects the fact that when applying insecticides in response to pest density thresholds (as is the case here) there is no certainty that a second treatment will be required. Thus resistance to lambda-cyhalothrin developed
more rapidly under a regime applying this compound prior to pymetrozine than when applying the compounds in reverse order. The opposite was the case for resistance to pymetrozine. The pro-tection afforded to a compound being used second in an alterna-tion was negated when both were used continuously in different segments of a spatial mosaic. In these simulations there was little or no advantage to applying insecticides as a mixture compared to alternation of single ingredients.
3.4 Level of compliance
The benefits accruing from implementation of IRM guidelines, for very mobile pests especially, would be expected to depend on the level of compliance with the guidelines achieved from grow-ers. If advocating mixtures, one obvious threat comes from a pro-portion of growers continuing to use one or both ingredients singly. This is explored in Fig. 6, where the percentage of growers complying with a mixture strategy varies from 0% to 100%. The ‘non-compliers’ were all dependent on lambda-cyhalothrin alone and none used pymetrozine as a sole treatment. Thus zero com-pliance represents the baseline L0scenario and full compliance
represents the L+P0scenario. Low (25% or less) levels of
com-pliance have very little effect on the development of resistance to lambda-cyhalothrin, but higher levels of compliance result in a gradual delay in the establishment of resistance. As expected, in these simulations the effect of compliance on resistance to pymetrozine was much less pronounced, with resistance only appearing when 75% or more of growers where adopting the mix-ture strategy.
4
DISCUSSION
There has been much research to investigate how multiple insecti-cides can best be used to delay the appearance of resistance to individual compounds. The majority of these studies have been theoretical evaluations of compounds applied as rotations, spatial mosaics or mixtures compared to the sequential ‘blanket’ use of single compounds to the stage at which resistance renders them ineffective.4,17,19One consistent outcome has been that applying
two compounds in a mixture from the outset can potentially lead to substantial delays in resistance, provided that stringent the-oretical assumptions are met. The overarching principle behind the use of mixtures is that of ‘redundant killing’,18whereby any
individual resistant to one ingredient is killed by simultaneous exposure to the other. The first prerequisite for redundant killing (and indeed all multiple pesticide tactics) is that there is no threat of cross-resistance encompassing both ingredients, implying that ideal mixture partners must be structurally and functionally as dif-ferent as possible. The second key requirement is that the two chemicals confer mutual protection throughout the effective life of an application, and must therefore be broadly equivalent in effi-cacy and persistence. In order to realize the maximum benefits of mixtures, alleles conferring resistance to each ingredient should initially be rare, so that any doubly resistant insects surviving expo-sure are exceptionally rare and likely to be swamped by suscepti-ble immigrants.16–18The stringency of these requirements greatly
limits the utility of this tactic in practice, although the conse-quences of relaxing the assumptions inherent in redundant killing have been less intensively studied. In contrast to theoretical work, most empirical studies of mixtures have focused on opportunities to exploit the enhanced toxicity of combinations33–35rather than
1369
Figure 4.Box plots of the probability distribution of years for the frequency of alleles conferring resistance to lambda-cyhalothrin (top) and pymetrozine (bottom) to reach 30% based on exclusive use of a mixture of these insecticides and when varying the starting frequency of the lambda-cyhalothrin resistance allele from 10−6to 10−1. The starting frequency of the pymetrozine resistance allele was kept constant at 10−5. A starting frequency of 10−5corresponds to the baseline L+P0regime in Fig. 4. Results for the baseline regimes involving sole use of lambda-cyhalothrin (L0) or pymetrozine (P0) are
included for comparison. See Fig. 3 for an explanation of box plots.
Unlike mixtures, rotations and mosaics aim to diversify selection pressures over time or space by restricting the period of expo-sure to each selecting agent. Both are founded on an assump-tion that frequencies of resistance to each compound decline in absence of the selector, due to dilution by susceptible immigrants, decreased fitness of resistant individuals, or both.8,36,37As a
gen-eral rule, the stronger the fitness penalty, the greater is the advan-tage of rotations over mosaics, although for mosaics there are also requirements relating to the extent of migration between treated patches.4It has been speculated that even in the absence of strong
fitness costs rotating compounds could have operational advan-tages by limiting and optimizing the use of particularly favoured insecticides.38The few examples of experimental evaluations of
multiple pesticide tactics under field or laboratory conditions39–41
have yielded inconsistent results, probably due to differences in biological variables such as initial allele frequency and the effective dominance of resistance genes.
Against this backdrop we have populated an individual-based model22 with empirically based estimates of key biological and
operational parameters, in order to evaluate the outcome of dif-ferent scenarios for applying two unrelated insecticides against M. aeneus on OSR. Many of the parameters used in building the scenario are unique to the individual case study, and there-fore the outputs from model analysis are also unique. Therethere-fore the conclusions made about the impact of those resistance
management techniques from this particular scenario should not be applied ‘carte blanche’ to all crop pest scenarios. A resistance management practice that is predicted to provide longer product sustainability under a two-sprays-per-season, threshold-triggered pest management regime, does not necessarily translate to a regime involving six calendar-based insecticide applications per season.
Repeated use of the same insecticide or ones with the same mode of action has long been regarded as the worst-case scenario for the selection for insecticide resistance, with the number and frequency of applications, as well as number of insect generations exposed determining the speed at which resistance arises. ForM. aeneus, this scenario was common across much of Europe, with pyrethroids the exclusive choice for control between their first reg-istrations up to the mid-2000s. Exclusive reliance on pyrethroids was unquestionably the main driver for the selection of pyrethroid resistance in this pest.28Use of the IbM model to simulate a
sce-nario of repeated use of a pyrethroid alone (lambda-cyhalothrin), up to two sprays per calendar season based on a treatment thresh-old of 15 and five insects per plant for winter and spring OSR respectively, predicts a similar time to resistance as was observed in the field (average of 15 years28).
1370
Figure 5. Box plots of the probability distribution of years for the frequency of alleles conferring resistance to lambda-cyhalothrin (top) and pymetrozine (bottom) to reach 30% under alternation regimes involving lambda-cyhalothrin followed by pymetrozine (L→P), pymetrozine followed by lambda-cyhalothrin (P→L) or a mosaic with 50% of cells relying on exclusive use of each insecticide. Results for the baseline regimes involving sole use of lambda-cyhalothrin (L0), pymetrozine (P0) or a mixture of the compounds (L+P0) are included for comparison. See Fig. 3 for an explanation of box plots.
pyridine–azomethine insecticide pymetrozine appears on aver-age to take longer to select for resistance than the pyrethroid. Since other parameters are identical, we deduce that the differ-ence in resistance risk is a consequdiffer-ence of a differdiffer-ence in product efficacy. The lower initial activity and resulting differences in efficacy decay for pymetrozine (as calculated from field trial data) impose a lower selection pressure for pymetrozine-resistant bee-tles than pyrethroid-resistant ones. This leads to speculation that under the certain circumstances a product that provides adequate but incomplete control may prove more sustainable than one pro-viding higher initial efficacy. However, this statement requires qualification since at present there is no evidence of either field-or labfield-oratfield-ory-evolved resistance to pymetrozine inM. aeneus. We have therefore based assumptions on the potency and inheritance of potential resistance to pymetrozine on empirically derived esti-mates for resistance to lambda-cyhalothrin. The need to make such assumptions is a recurring challenge when developing and evaluating proactive resistance management recommendations, i.e., before resistance has been documented and characterized.4,5
Simulated use of a mixture of lambda-cyhalothrin and pymetrozine delayed the selection of resistance to both insecti-cides compared to the use of single active ingredients, doubling the time to lambda-cyhalothrin resistance and more than dou-bling the time to pymetrozine resistance. This is under a scenario with resistance alleles rare (10−5) for both insecticides, and
insecticides are applied at doses that would be fully active indi-vidually. These conditions approach those required for effective redundant killing but with two important exceptions. Firstly, the insecticides differed in their initial efficacy against the target pest, resulting in a differing rate of build-up of the two resistance alleles in the baseline mixture scenario. Secondly, analyses of field trial data from sites harbouring resistance to lambda-cyhalothrin indi-cated that resistance was largely dominant in expression, and this was built into the simulations. The likelihood of substantial num-bers of heterozygotes surviving exposure is an important reason why the mixture did not lead to the longer delays that would be expected if resistance is effectively recessive in expression.17,18The
simulations also reinforced the important effect that the starting frequency of resistance can exert on the outcome of a mixture scenario. Raising the initial frequency of resistance to one of the components (the pyrethroid) decreased the time to resistance for both components of the mixture. However, unless the starting frequency of pyrethroid resistance was very high (>10−3) there
1371
Figure 6.Box plots for the probability distribution of years for the frequency of alleles conferring resistance to lambda-cyhalothrin (top) and pymetrozine (bottom) to reach 30% under regimes representing different levels of compliance with a mixture strategy. Growers not using the mixture were reliant on lambda-cyhalothrin alone. Percentage use of the mixture increases from 0 (=baseline L0regime) to 100 (baseline L+P0regime). See Fig. 3 for anexplanation of box plots.
The most commonly promoted approach to resistance manage-ment is to alternate the use of insecticides with differing modes of action. This approach has some practical advantages over the use of mixtures, which include reduced environmental loading of active ingredients and in some cases a lower cost for growers. Our simulations suggest little difference in terms of resistance man-agement benefits between the mixture and rotation strategy. The simulations exclude any fitness costs associated with resistance to either product, and therefore represent a worst-case scenario for the efficacy of rotations, which can be substantially enhanced by selection against resistance in the absence of a selecting agent.4,36
The resistance risk associated with rotations was, unsurprisingly, related to the order in which the products are used, especially for a scenario in which insecticide applications are triggered by pest density thresholds. A rotation strategy utilized for resistance management relies upon target insects being exposed to different insecticides, but a strategy based on insect thresholds being breached may not achieve this objective. Rotations explored in this paper specify use of one particular insecticide when the insect population first exceeds threshold, followed by a second compound if the threshold is exceeded a second time. Naturally, this is not always the case and the effects of this unpredictability and reliance on the second spray are apparent from the current results. The insecticide used first in the strategy has a greater resistance risk than the one placed second in the strategy. This contrasts with a mixture that incorporates both modes of action within a single application.
One of the greatest challenges with implementing insecticide resistance management is to ensure compliance with any given strategy within an agricultural system. There are many factors that prevent the widespread adoption of insecticide resistance management techniques, not least being the perceived increased cost of crop production. Compliance with mandated resistance management programmes is never complete and ironically often decreases in the absence of resistance problems.9,42We therefore
investigated the impact of compliance on the effectiveness of a resistance management programme. As compliance with a man-dated mixture strategy decreased, not surprisingly so did the ben-efits of the programme. At least 50% compliance was required to achieve some benefits, but by default the resistance risk to pymetrozine increased as its use increased. This presents a notable challenge to those advocating resistance management. Provid-ing recommendations that have practical disadvantages, such as increased cost, risk or inconvenience, is unlikely to encourage growers to comply to the extent needed for a strategy to be effec-tive. Communication of the short- and long-term benefits of resis-tance management is just as important as defining product use patterns.
1372
with a valuable basis for extending sound resistance management advice. Such tools form a basis for designing and optimizing pest control strategies, not only by predicting resistance risks but also by understanding needs and opportunities for new control techniques, whether chemical, biological, genetic or cultural.
ACKNOWLEDGEMENTS
We thank Dr Sam Cook (Rothamsted Research) for advice and sources of information on the biology and behaviour of Meligethes aeneus.
REFERENCES
1 Mitchell PD and Onstad DW, Valuing pest susceptibility to control, in Insect Resistance Management: Biology, Economics and Prediction, ed. by Onsted DW. Academic Press, London, pp. 17–38 (2008). 2 Sparks TC and Nauen R, IRAC: mode of action classification and
insec-ticide resistance management,Pestic Biochem Physiol121:122–128 (2015).
3 Anonymous, The cost of new agrochemical product discovery, devel-opment and registration in 1995, 2000, 2005–8 and 2010 to 2014: a consultancy study for CropLife International, CropLife America and the European Crop Protection Association (2015). [Online]. Available: http://www.croplifeamerica.org/wp-content/uploads/ 2016/04/Phillips-McDougall-Final-Report_4.6.16.pdf [12 November 2016].
4 Roush RT, Designing resistance management programs: how can you choose?Pestic Sci26:423–441 (1989).
5 Denholm I and Rowland MW, Tactics for managing pesticide resistance in arthropods,Annu Rev Entomol37:91–112 (1992).
6 McKenzie JA,Ecological and Evolutionary Aspects of Insecticide Resis-tance. RG Landes, Austin, TX (1996).
7 Denholm I, Cahill M, Dennehy T and Horowitz AR, Challenges with managing insecticide resistance in agricultural pests, exemplified by the whiteflyBemisia tabaci.Philos Trans R Soc, B353:1757–1767 (1998).
8 Roush RT and McKenzie JA, Ecological genetics of insecticide and acaricide resistance.Annu Rev Entomol32:361–380 (1987). 9 Tabashnik BE, Brevault T and Carriere Y, Insect resistance to BT crops:
lessons from the first billion acres,Nat Biotechnol31:510–521 (2013). 10 Roush RT and Daly JC, The role of population genetics in resistance research and management, inPesticide Resistance in Arthropods, ed. by Roush RT and Tabashnik BE. Chapman & Hall, New York, pp. 97–152 (1990).
11 Taylor CE, Genetics and evolution of resistance to insecticides,Biol J Linn Soc27:103–112 (1986).
12 Tabashnik BE, Modelling and evaluation of resistance management tactics, inPesticide Resistance in Arthropods, ed. by Roush RT and Tabashnik BE. Chapman & Hall, New York, pp. 153–182 (1990). 13 Taylor CE and Georghiou GP, Suppression of insecticide resistance
by alteration of gene dominance and migration.J Econ Entomol 72:105–109 (1979).
14 Tabashnik BE and Croft BA, Managing pesticide resistance in crop– arthropod complexes: interactions between biological and opera-tional factors,Environ Entomol11:1137–1144 (1982).
15 Mani GS and Wood RJ, Persistence and frequency of application of an insecticide in relation to the rate of evolution of resistance,Pestic Sci 15:325–336 (1984).
16 Curtis CF, Theoretical models of the use of insecticide mixtures for the management of resistance,Bull Ent Res75:259–265 (1985). 17 Mani GS, Evolution of resistance in the presence of two insecticides.
Genetics109:761–783 (1985).
18 Comins HN, Tactics for resistance management using multiple pesti-cides,Agric Ecosyst Environ16:129–148 (1986).
19 Tabashnik BE, Managing resistance with multiple pesticide tactics: the-ory, evidence and recommendations,J Econ Entomol82:1263–1269 (1989).
20 Thompson GD, Matten S, Denholm I, Whalon ME and Leonard P, The politics of resistance management: working towards pesticide resistance management globally, inGlobal Pesticide Resistance in Arthropods, ed. by Whalon ME, Mota-Sanchez D and Hollingworth RM. CAB International, Wallingford, UK, pp. 146–165 (2008).
21 Grimm V and Railsback SF,Individual-Based Modelling and Ecology. Princeton University Press, Woodstock, UK (2005).
22 Stratonovitch P, Elias J, Denholm I, Slater R and Semenov MA, An individual-based model of the evolution of pesticide resis-tance in heterogeneous environments: control of Meligethes aeneuspopulation in oilseed rape crops,PLoS ONE9(12): e115631, doi:10.1371/journal.pone.0115631 (2014).
23 Alford DV, Nilsson C and Ulber B, Insect pests of oilseed rape crops, in Biocontrol of Oilseed Rape Pests, ed. by Alford DV. Blackwell Science, Oxford, pp. 9–42 (2003).
24 Williams IH and Free JB, The feeding and mating behaviour of pollen beetles (Meligethes aeneusFab) and seed weevils (Ceutorhynchus assimilis Payk) on oilseed rape (Brassica napus L.). J Agric Sci 91:453–459 (1978).
25 Cook SM and Denholm I, Ecological approaches to the control of pollen beetles in oilseed rape,EPPO Bull38:110–113 (2008).
26 Hansen LM, Insecticide-resistant pollen beetles (Meligethes aeneusF) found in Danish oilseed rape (Brassica napusL) fields,Pest Manag Sci 59:1057–1059 (2003).
27 Heimbach U, Muller A and Thieme T, First steps to analyse pyrethroid resistance of different oil seed rape pests in Germany.Nachrichtenbl Dtsch Pflanzenschutzdienstes58:S1–S5 (2006).
28 Slater R, Ellis S, Genay JP, Heimbach U, Huart G, Sarazin M et al., Pyrethroid resistance monitoring in European populations of pollen beetle (Meligethes spp.): a coordinated approach through the Insecticide Resistance Action Committee (IRAC). Pest Manage Sci 67:633–638 (2011).
29 Zimmer CT and Nauen R, Cytochrome P450 mediated pyrethroids resis-tance in European populations ofMeligethes aeneus(Coleoptera: Nitidulidae).Pestic Biochem Physiol100:264–272 (2011).
30 Nauen R, Zimmer CT, Andrews M, Slater R, Bass C, Ekbom Bet al., Target-site resistance to pyrethroids in European populations of pollen beetle, Meligethes aeneus F. Pestic Biochem Physiol 103:173–180 (2012).
31 Tait MF, Horak A and Dewar AM, Control of pollen beetles,Meligethes aeneus, in oilseed rape using pymetrozine. Aspects Appl Biol 106:187–194 (2011).
32 Semenov MA, Donatelli M, Stratonovitch P, Chatzidaki E and Baruth B, ELPIS: a dataset of local-scale daily climate scenarios for Europe,Clim Res44:3–15 (2010).
33 Ahmad M, Saleem MA and Sayyed AH, Efficacy of insecticide mix-tures against pyrethroids- and organophosphate-resistant popula-tions ofSpodoptera litura(Lepidoptera: Noctuidae),Pest Manage Sci 65:266–274 (2009).
34 Shi X, Xiong MH, Jiang WH, Wang ZT, Guo WC, Xia ZHet al., Efficacy of endosulfan and fipronil and joint toxic action of endosulfan mixtures againstLeptinotarsa decemlineata,J Pestic Sci85:519–526 (2012).
35 Abbas N, Crickmore N and Shad SA, Efficacy of insecticide mixtures against a resistant strain of house fly (Diptera: Muscidae) collected from a poultry farm.Int J Trop Insect Sci35:48–53 (2015).
36 Georghiou GP, Management of resistance in arthropods, inPest Resis-tance to Pesticides, ed. by Georghiou GP and Saito T. Plenum, New York, pp. 769–792 (1983).
37 Leeper JR, Roush RT and Reynolds HT, Preventing and managing resistance in arthropods, inPesticide Resistance: Strategies and Tactics for Management. National Academy Press, Washington, DC, pp. 335–346 (1986).
38 Mallet J, The evolution of insecticide resistance: have the insects won? Trends Ecol Evol4:336–340 (1989).
39 MacDonald RS, Surgeoner GA, Solomon KR and Harris CR, Effect of four spray regimes on the development of permethrin and dichlorvos resistance, in the laboratory, by the house fly (Diptera: Muscidae).J Econ Entomol76:417–422 (1983).
40 Pimental D and Burgess M, Effects of single versus combinations of insecticides on the development of resistance,Environ Entomol 14:582–589 (1985).
41 Immaraju JA, Morse JG and Hobza RF, Field evaluation of insecticide rotation and mixtures as strategies for Citrus thrips (Thysanoptera: Thripidae) resistance management in California. J Econ Entomol 83:306–314 (1990).