Queensland Coastal Wetland Resources: Sand Bay to Keppel Bay.
104
0
0
Full text
(2) QI00100 ISSN 0727-46273 This report may be cited as: Bruinsma, C (2000). Queensland Coastal Wetland Resources: Sand Bay to Keppel Bay. Information Series QI00100. Department of Primary Industries Queensland, Brisbane.. General disclaimer Information contained in this publication is provided as general advice only. For application to specific circumstances, professional advice should be sought. The Department of Primary Industries, Queensland has taken all reasonable steps to ensure that the information contained in this publication is accurate at the time of production. Readers should ensure that they make appropriate inquiries to determine whether new information is available on the particular subject matter. ©. The State of Queensland, Department of Primary Industries, 2000. Copyright protects this publication. Except for purposes permitted by the Copyright Act, reproduction by whatever means is prohibited without prior written permission of the Department of Primary Industries, Queensland. Inquiries should be addressed to: Manager, DPI Publications Department of Primary Industries GPO Box 46 Brisbane Qld 4001. Acknowledgments Funding provided by Environment Australia supported the research and collation of information presented in this report. The project was undertaken for the Marine Protected Areas Program, Coast and Clean Seas, Natural Heritage Trust. The views and opinions expressed in this report are those of the authors and do not reflect those of the Commonwealth Government, the Minister for the Environment or the Director of National Parks and Wildlife. Landsat TM satellite imagery was acquired by the Australian Centre for Remote Sensing (ACRES), a business unit of the Australian Surveying and Land Information Group (AUSLIG), Australia's national mapping agency. www.auslig.gov.au Copies of the report may be borrowed from the library: Environment Australia, GPO Box 787, CANBERRA ACT 2601 Australia.
(3) EXECUTIVE SUMMARY Protection of coastal wetland environments is an important prerequisite to effective and sustainable inshore fisheries management and conservation of habitats for use by future generations. Mangroves, saltmarshes, seagrasses and non-vegetated habitats directly support local and regional inshore and offshore fisheries through the provision of food, shelter, breeding and nursery grounds. As such, these wetland environments have significant economic value as well as their intrinsic aesthetic and ecological values. Approximately 85% of the wetland resources of the Queensland coastline have been mapped or are currently being mapped by the Assessment and Monitoring Unit, Queensland Fisheries Service, Department of Primary Industries Queensland. The mapping undertaken to date consistently uses the protocol developed in-house (Danaher 1995a) which has been recognised (Ward et al. 1998) as an appropriate model for a national approach to coastal wetlands mapping. This process is being undertaken in order to provide a baseline dataset for Fish Habitat Area (FHA) declaration, Ramsar site nomination and future monitoring of these important fish habitats. This report summarises the results of the mapping undertaken in the Central Queensland Coast from Sand Bay to Keppel Bay (hereafter referred to as the Study Area). The study was undertaken in order to: 1. document and map the coastal wetland communities along the Queensland coastline from Sand Bay (20.93°S, 149.04°E) to Keppel Bay (23.65°S, 151.07°E); 2. document levels of existing disturbance to and protection of the wetlands; 3. examine existing recreational and commercial fisheries in the region; and 4. evaluate the conservation values of the areas investigated from the viewpoint of fisheries productivity and as habitat for important and/or threatened species. Project Rationale There is a need to identify and map fish habitats for the management and conservation of the resource through the declaration of Marine Protected Areas (MPAs) (e.g. FHAs) and Ramsar sites, as well as a requirement for conducting further research into the interactions between fauna and the habitat. Studies combining data on coastal wetland primary productivity, connectivity between habitat types, fish species associated with particular habitats and feeding strategies of these fish species and will contribute to a better understanding of the value of particular habitats to local and regional fisheries productivity. Completion of mapping of the coastal wetland communities of the Queensland coastline will provide quantitative data for incorporation into these studies. Additionally, it provides the base information required for monitoring short term and long term changes in coastal wetland habitats and planning appropriate management measures. Results Coastal Wetlands of the Study Area In most estuaries in the Study Area, Closed Rhizophora, located on the seaward margin, is the dominant community. Closed Ceriops is generally located directly landward of the Closed Rhizophora zone. In more upstream locations, where freshwater input is highest, Closed Mixed communities line the stream banks. Saltpans are usually limited to a narrow band in the upper intertidal zone, except where low coastal plains and a dry environment allow further development of a hypersaline environment. Saline Grasslands usually only occur in the upper intertidal zone where there are freshwater swamps adjacent.. Queensland Coastal Wetland Resources: Sand Bay to Keppel Bay. i.
(4) Saltpans are the dominant coastal wetland community by area in this Study Area. However, the majority of these Saltpan communities are found in only two locations, Broad Sound and the Fitzroy River Delta. Both areas have extensive low coastal plains and a dry climate. Inundation by the tide and subsequent evaporation create a hypersaline environment in which very little vegetation can survive. On a regional scale such Saltpan development is relatively unique as the majority of the tropical environments in Queensland receive high annual rainfall and riverine freshwater input, which limits Saltpan development. In both the Broad Sound region and the Fitzroy River Delta, the extensive Saltpans are drained by mangrove-lined creeks, which are generally dominated by Closed Ceriops or Closed Mixed communities. These communities are generally very narrow (less than 30 m wide) and are often unmappable by this technique (Section 4.3).. Closed Rhizophora Closed Avicennia Open Avicennia Closed Ceriops Open Ceriops Closed Aegiceras Closed Rhizophora/Avicennia Closed Avicennia/Ceriops Open Avicennia/Ceriops Closed Mixed Closed Ceriops Dieback Saline Grassland Saltpan Samphire-dominated Saltmarsh Total. 30590 7697 627 20536 81 148 25 1002 1 13188 41 10185 64520 961 149594. PERCENT OF TOTAL. AREA OF COASTAL WETLAND COMMUNITIES (ha). TABLE I Areas of coastal wetland communities in the Study Area.. 20.5 5.2 0.4 13.7 0.1 0.1 0.0 0.7 0.0 8.8 0.0 6.8 43.1 0.6. Within the Study Area, the coastal wetlands of Shoalwater Bay are of particular regional significance. The Shoalwater Bay Military Training Area (SWBMTA) is the largest coastal wilderness area between Nadgee (southern NSW) and the Cape Melville/Starke Holding area on Cape York Peninsula (ANCA 1996). The area is species rich due to the fact that it is a significant overlap zone for tropical, subtropical and temperate species in all fauna groups (ANCA 1996). The coastal wetlands and surrounding terrestrial vegetation is in virtually pristine condition. For these reasons the Shoalwater Bay region is one of great value for scientific research and as a conservation area.. ii. Queensland Coastal Wetland Resources: Sand Bay to Keppel Bay.
(5) Recommendations The current study confirms the fisheries value for the declared FHAs in this Study Area and identifies the need for expansion of the existing marine protected area network. In particular, the following recommendations for new FHAs in the Study Area should be considered as a priority: ♦ It is strongly recommended that the coastal wetland vegetation of the Fitzroy River Delta, including the extensive Saltpans and the mangrove-lined feeder creeks from Balaclava Island to the western side of Curtis Island be gazetted as a FHA. These important fish habitats are representative of the Fitzroy River Delta and are relatively undisturbed. Other coastal wetland communities of the Fitzroy River Delta have been modified extensively through the construction of levees for pondage systems and salt evaporation ponds. ♦ The diverse characteristics of the coastal wetlands of the Shoalwater Bay region promote it as an area suitable for protection within a FHA. It is recommended that the requirement for a FHA in this region be investigated further, in collaboration with the land managers (the Australian Army). Recommendations for Further Investigations Continuation of the coastal wetlands mapping to complete the remainder (15%) of the Queensland coastline is recommended to: ♦ Provide baseline habitat data for FHA declaration and Ramsar site nomination; ♦ Provide a basis for future monitoring of the spatial and composition changes in tidal coastal wetland communities on a local, bioregional and State-wide basis; ♦ As a resource for incorporation into studies of the relationships of specific marine fauna to particular coastal wetland habitats; ♦ Provide baseline habitat data for Local Government Planning Schemes prepared under the provisions of the Integrated Planning Act 1997. Effectiveness of the Project The method of investigating and mapping relatively large coastal regions, utilised in this study, has proven to be cost effective with a high degree of accuracy (approximately 90%) for coastal wetland communities at this scale. The information presented in the report has been provided to the DPI Fisheries, Marine Habitat Unit staff responsible for FHA declaration, for the purpose of incorporation into FHA planning processes relevant to the study area. It has been demonstrated, in this and previous studies, that the technique developed for coastal wetlands mapping is transferable to similar coastal wetland systems. Landsat TM data is widely available. However, limitations to the technique apply. The minimum mapping unit is a 25 x 25 m Landsat TM pixel. Consequently, a community smaller than this size is not mappable. Additionally, polygons of less than 0.5 ha are eliminated in the mapping process. The mapping technique is generally more accurate in areas where clear zonation in coastal wetland communities occurs. An overall evaluation of the project is included in Appendix 9.. Queensland Coastal Wetland Resources: Sand Bay to Keppel Bay. iii.
(6) TABLE OF CONTENTS Executive Summary. i. Project Rationale ......................................................................................................................................... i Results......................................................................................................................................................... i Recommendations..................................................................................................................................... iii Recommendations for Further Investigations ........................................................................................... iii Effectiveness of the Project....................................................................................................................... iii. Table of Contents. iv. Section 1 Introduction. 1. 1.1 Project Scope.............................................................................................................................................. 1 1.2 Current Progress of Queensland Coastal Wetland Resource Mapping....................................................... 2. Section 2 Background. 3. 2.1 The Study Area........................................................................................................................................... 3 2.2 Coastal Wetland Environments .................................................................................................................. 6 Fish Habitats Mapped in this Study ........................................................................................................... 6 Mangroves.................................................................................................................................................. 6 Saltmarshes ................................................................................................................................................ 8 Other Fish Habitats Not Mapped in this Study .......................................................................................... 8 Seagrasses .................................................................................................................................................. 8 Intertidal Flats, Rocky Foreshores and Coral Reefs................................................................................... 9 2.3 Project Rationale ........................................................................................................................................ 9. Section 3 Methods. 11. 3.1 Data .......................................................................................................................................................... 11 3.2 Mapping Methods..................................................................................................................................... 11 3.3 Field Methods........................................................................................................................................... 12 3.4 Classification Details................................................................................................................................ 13 3.5 Accuracy Assessment............................................................................................................................... 14 3.6 Overview Map of Fish Habitats ............................................................................................................... 14 3.7 Overview of Existing Conservation Measures ......................................................................................... 15 3.8 Assessment of Coastal Wetlands for FHA Nomination ........................................................................... 15. Section 4 Results. 17. 4.1 Description of the Mapping Units ............................................................................................................ 17 4.2 Accuracy Assessment............................................................................................................................... 24 4.3 Limitations of the Mapping Technique .................................................................................................... 24. Section 5 Distribution and Significance of the Coastal Wetland Communities. 26. 5.1 Overview of Coastal Wetland Community Distribution .......................................................................... 26 5.2 Sand Bay to Cape Palmerston .................................................................................................................. 28 Sand Bay .................................................................................................................................................. 28 Northern Beaches..................................................................................................................................... 29 Bassett Basin ............................................................................................................................................ 29 Bakers Creek-Sandringham Bay Aggregation ......................................................................................... 29 Dalrymple Bay ......................................................................................................................................... 30 Sarina Inlet-Ince Bay Aggregation........................................................................................................... 30 5.3 Cape Palmerston to Clairview Bluff......................................................................................................... 32 Yarrawonga Point .................................................................................................................................... 32 West Hill .................................................................................................................................................. 32 Carmilla.................................................................................................................................................... 33 Clairview.................................................................................................................................................. 33 Clairview Bluff ........................................................................................................................................ 33 5.4 Broad Sound Region (Clairview Bluff to Stanage) .................................................................................. 34 St Lawrence ............................................................................................................................................. 35 Broad Sound............................................................................................................................................. 36 Long Island .............................................................................................................................................. 37 iv. Queensland Coastal Wetland Resources: Sand Bay to Keppel Bay.
(7) 5.5 Shoalwater Bay (Stanage to Stockyard Point).......................................................................................... 38 Shoalwater Bay ........................................................................................................................................ 38 Townshend and Leicester Islands ............................................................................................................ 39 Island Head .............................................................................................................................................. 39 Port Clinton.............................................................................................................................................. 39 5.6 Stockyard Point to Cattle Point ................................................................................................................ 40 Corio Bay ................................................................................................................................................. 40 Yeppoon–Cawarral Creek........................................................................................................................ 40 Great Keppel Island ................................................................................................................................. 41 5.7 The Fitzroy River Delta (Cattle Point to Ramsay Crossing) .................................................................... 41 Area 1. Rockhampton to Pirate Point (including the northern bank of the Fitzroy River)....................... 42 Area 2. Pirate Point to Raglan Creek ....................................................................................................... 43 Area 3. Raglan Creek to Ramsay Crossing (including western Curtis Island)......................................... 43 5.8 Regional Significance of the Coastal Wetland Environments.................................................................. 44 Distribution of Mangrove Species............................................................................................................ 44. Section 6 Disturbance of and Threats to Coastal Wetland Vegetation in the Study Area 46 6.1 Specific Disturbance of and Threats to Coastal Wetland Vegetation....................................................... 46 6.2 Catchment-wide Threats to Coastal Wetland Vegetation......................................................................... 47 Pioneer River Catchment Area................................................................................................................. 47 Sarina−Shoalwater Bay Catchment Area ................................................................................................. 48 Fitzroy River Catchment Area ................................................................................................................. 48 Buffer Zones as a Management Tool ....................................................................................................... 49 6.3 Pondage Systems...................................................................................................................................... 50 6.4 Mangrove Dieback within the Study Area ............................................................................................... 50 Mangrove Dieback of the Bassett Basin and Surrounding Estuaries ....................................................... 50 Other Areas of Natural Mangrove Dieback ............................................................................................. 51 Fitzroy River Delta Regrowth Communities............................................................................................ 52 6.5 Pests.......................................................................................................................................................... 53 Rubber vine.............................................................................................................................................. 53 Feral Pigs ................................................................................................................................................. 53. Section 7 Existing Conservation Measures and Conservation Values. 54. 7.1 Fish Habitat Areas .................................................................................................................................... 54 7.2 Ramsar Sites ............................................................................................................................................. 54 7.3 National Parks .......................................................................................................................................... 57 7.4 Marine Parks ............................................................................................................................................ 57 The Great Barrier Reef Marine Park and World Heritage Area............................................................... 57 State Managed Marine Parks ................................................................................................................... 57 7.5 Shoalwater Bay Military Training Area ................................................................................................... 58 7.6 Directory of Important Wetlands in Australia (Australian Nature Conservation Agency)....................... 58. Section 8 Existing Recreational, Indigenous and Commercial Fishing Resources in the Study Area 60 8.1 Recreational and Indigenous Fisheries Resources.................................................................................... 60 8.2 Commercial Fisheries Resources.............................................................................................................. 60 8.3 Fisheries Resources and their Habitat Requirements ............................................................................... 63. Section 9 Application of the Dataset to FHA Planning. 64. 9.1 Fish Habitat Area Declaration Process..................................................................................................... 64 9.2 Assessment of Coastal Wetland Habitats for FHA Declaration Purposes................................................ 66 9.3 Coastal Wetland Communities Currently Included in FHAs ................................................................... 67 9.4 Representative Areas to be Considered as Potential FHAs ...................................................................... 68 The Fitzroy River Delta ........................................................................................................................... 68 Shoalwater Bay, Townshend and Leicester Islands ................................................................................. 69 Other Gaps ............................................................................................................................................... 69. Section 10 Recommendations and Further Investigations. 70. Further Investigations .............................................................................................................................. 70. Queensland Coastal Wetland Resources: Sand Bay to Keppel Bay. v.
(8) Other Coastal Wetland Mapping Projects ................................................................................................ 73 Acknowledgements.................................................................................................................................. 73 References................................................................................................................................................ 74. List of Tables and Figures TABLE I Areas of coastal wetland communities in the Study Area.................................................................. ii FIGURE 1.1 Queensland coastal wetland resource mapping projects. .............................................................. 2 FIGURE 2.1 Site map of the study area, Sand Bay to Keppel Bay, central Queensland. .................................. 4 TABLE 2.1 Hydrology and catchment details for the main estuaries within the study area. ............................ 5 TABLE 3.1 Aerial photography utilised in the study. ..................................................................................... 11 FIGURE 3.1 Distribution of ground truthing data utilised in this study. ......................................................... 13 TABLE 3.2 Details of digital datasets used in the fish habitats overview map. .............................................. 14 TABLE 3.3 Details of digital datasets used in examining existing conservation measures............................. 15 TABLE 3.4 Details of the methods of the coastal wetland significance assessment. ...................................... 16 FIGURE 4.1 Closed Rhizophora along a creek at Mangrove Island................................................................ 18 FIGURE 4.2 Closed Avicennia at Rocky Dam Creek...................................................................................... 18 FIGURE 4.3 Closed Ceriops on Long Island................................................................................................... 20 FIGURE 4.4 A Closed Aegiceras fringe at Price’s Landing, with Closed Rhizophora behind. ...................... 20 FIGURE 4.5 Closed Rhizophora/Avicennia along a waterway on Mangrove Island....................................... 21 FIGURE 4.6 Closed Avicennia/Ceriops at Rocky Dam Creek.. ...................................................................... 22 FIGURE 4.7 Closed Mixed along a waterway on Mangrove Island................................................................ 22 FIGURE 4.8 A Saltpan community at Charon Point. ...................................................................................... 23 FIGURE 4.9 A Saline Grassland community at Rocky Dam Creek. ............................................................... 23 TABLE 4.1 User’s and producer’s accuracy for each of the coastal wetland communities. ........................... 24 FIGURE 5.1 Transect of a typical coastal wetland system in the Study Area across the tidal profile............. 26 TABLE 5.1 Areas of coastal wetland communities in the Study Area. ........................................................... 27 TABLE 5.2 Area of coastal wetland communities in the Bassett Basin: 1953, 1993 and 1997....................... 29 FIGURE 5.2 Freshwater wetlands at Rocky Dam Creek. ................................................................................ 31 TABLE 5.3 Areas of coastal wetland communities from Sand Bay to Cape Palmerston. ............................... 31 TABLE 5.4 Areas of coastal wetland communities from Cape Palmerston to Clairview Bluff. ..................... 34 FIGURE 5.3 St Lawrence Creek at low tide. ................................................................................................... 35 FIGURE 5.4 Waverley Creek at low tide ........................................................................................................ 35 FIGURE 5.5 Transect of a typical Saltpan dominated coastal wetland system across the tidal profile ........... 36 TABLE 5.5 Areas of coastal wetland communities in the Broad Sound Region............................................. 37 TABLE 5.6 Areas of coastal wetland communities of Shoalwater Bay........................................................... 39 TABLE 5.7 Areas of coastal wetland communities from Stockyard Point to Cattle Point. ............................. 41 TABLE 5.8 Areas of coastal wetland communities of the Fitzroy River Delta. .............................................. 44 TABLE 6.1 Development proposals that may impact upon coastal wetland vegetation.................................. 46 TABLE 6.2 Existing developments that may be a potential threat to coastal wetlands if poorly managed. .... 47 TABLE 6.3 Area of Closed Ceriops dieback within the Study Area............................................................... 51 FIGURE 6.1 Closed Ceriops dieback at Clairview Bluff. ............................................................................... 52 FIGURE 6.2 Closed Ceriops dieback at Bar Plains, Broad Sound. ................................................................. 52 FIGURE 6.3 A regrowth community on the northern bank of the Fitzroy River............................................. 53 TABLE 7.1 Summary of existing conservation measures in the Study Area. ................................................. 55 TABLE 7.2 Fisheries values and habitat types of Fish Habitat Areas (both A and B) within the study area. . 56 TABLE 7.3 Conservation significance of wetlands of national importance (ANCA 1996). ........................... 59 TABLE 8.1 Coastal wetland systems in the Study Area which have been recognised by the ANCA as important local fishing areas. ................................................................................................................ 60 FIGURE 8.1 Catch in tonnes (1988−2000) of major fisheries species in the Study Area in comparison to state-wide catches.................................................................................................................................. 61 FIGURE 8.2 Total catch in tonnes of barramundi by 30 minute grid, 1998. ................................................... 62 TABLE 8.2 Habitat requirements for selected fisheries resources of importance to the Study Area. ............. 63 TABLE 9.1 Details of the methods of the coastal wetland significance assessment. ...................................... 65 TABLE 9.2 Summary of coastal wetland characteristics from Sand Bay to Keppel Bay................................ 66 FIGURE 9.1 Coastal wetland communities currently included in FHAs......................................................... 67 TABLE 9.3 Area of coastal wetland communities protected within declared FHAs in the Study Area.. ........ 68. vi. Queensland Coastal Wetland Resources: Sand Bay to Keppel Bay.
(9) List of Appendices Appendix 1: Declared FHAs in Queensland Appendix 2: FHA Declaration Process and Management Options Appendix 3: Criteria for Ramsar site Nomination Appendix 4: MPA Declarations and Nominations Resulting from Queensland Coastal Wetlands Mapping Projects Appendix 5: Satellite Remote Sensing Appendix 6: Metadata Appendix 7: Distribution of Coastal Wetland Communities in the Study Area Appendix 8: Field Data Appendix 9: Project Evaluation Appendix 10: Dams and Weirs in the Study Area. Queensland Coastal Wetland Resources: Sand Bay to Keppel Bay. 77 78 83 85 86 87 88 89 91 93. vii.
(10) viii. Queensland Coastal Wetland Resources: Sand Bay to Keppel Bay.
(11) SECTION 1 INTRODUCTION 1.1 Project Scope Marine, estuarine and freshwater systems in Queensland are managed under the provisions of the Queensland Fisheries Act 1994 and Fisheries Regulation 1995. This legislation provides for the ‘management, use, development and protection of fisheries resources and fish habitats’. All marine plants throughout Queensland are specifically protected under this legislation. Key fish habitats are further protected through the declaration of Fish Habitat Areas (FHAs). FHAs are part of the on-going management of fisheries resources within Queensland and are specifically declared to ensure continuation of productive recreational, indigenous and commercial fisheries in a region through habitat protection. Declaration publicly proclaims the value of the area from a fisheries viewpoint, and increases the statutory level of protection of the wetlands for community fisheries benefits. Appendix 1 displays the current distribution of declared FHAs of both Management A and B status in Queensland. Appendix 2 gives further details on FHA declaration and management. Further protection of significant wetland areas is achieved through the declaration of Ramsar sites. Formal listing of Ramsar sites was the result of the Convention on Wetlands of International Importance. Coastal wetland resources are an important consideration in the nomination of these Ramsar sites. Further details of the criteria for the assessment of wetlands for Ramsar nomination can be found in Appendix 3. This report provides key resource data for the ongoing assessment of the requirement for additional Marine Protected Areas (e.g. FHAs under the Queensland Fisheries Act 1994) in regions of high established fish habitat value. Additionally, the study provides baseline information on the coastal wetlands from Sand Bay to Keppel Bay for Ramsar site nomination. The project aims are: 1. document and map the coastal wetland communities along the Queensland coastline from Sand Bay (20.93°S, 149.04°E) to Keppel Bay (23.65°S, 151.07°E); 2. document levels of existing disturbance to and protection of the wetlands; 3. examine existing recreational, indigenous and commercial fisheries resources in the region; 4. evaluate the conservation values of the areas investigated from the viewpoint of fisheries productivity and as habitat for important and/or threatened species for future FHA/MPA declaration.. Queensland Coastal Wetland Resources: Sand Bay to Keppel Bay. 1.
(12) 1.2 Current Progress of Queensland Coastal Wetland Resource Mapping Approximately 85% of Queensland’s coastal wetland resources have been or are currently being mapped by the Department of Primary Industries, Queensland Fisheries Service as a baseline resource for FHA declaration and continued monitoring of these environments (as of Dec 2000). The areas that have been completed or are currently being mapped are displayed in Figure 1. A summary of this work and the resulting MPA declarations are included in Appendix 4.. Project Areas (completion date) Current Study Area Completion planned for July 2001 NT Border to the Flinders River (2000) SE Gulf of Carpentaria (1994) Cape York Peninsula (1993) The Burdekin Region (1994) The Bowen Region (1999) The Curtis Coast Region (1998) Round Hill Head to Tin Can Inlet (1999) The Moreton Region (2000). QLD coastline data: Commonwealth of Australia, AUSLIG.. FIGURE 1.1 Queensland coastal wetland resource mapping projects.. 2. Queensland Coastal Wetland Resources: Sand Bay to Keppel Bay.
(13) SECTION 2 BACKGROUND 2.1 The Study Area The Study Area lies in the tropical environment of Queensland’s central coastline. Extending from Andrews Point, Sand Bay to Ramsay Crossing, the Narrows (Keppel Bay), the Study Area encompasses large bays with extreme tidal ranges of up to 9m, extensive stretches of coastline with small estuaries and numerous sandy islands and offshore reefs. The outer reefs of the Great Barrier Reef provide protection from open ocean wave action for the coastal wetland communities in the Study Area. Mackay (149.18°E, 21.15°S) and Rockhampton (150.56°E, 23.34°S) are the two main urban centres within the Study Area. These two cities have populations of approximately 45 000 and 58 000, respectively (ABS 1996). Mackay is the major retail and wholesale centre for the Mackay/Whitsunday region, and is the main transport and administrative hub, catering for the surrounding sugar and coal mining industries (QDCILGP 2000). The coal industry, cattle industry and meat processing, railways, education and medical services provide the majority of employment in Rockhampton (QDCILGP 2000). Cattle grazing, agriculture and mining are the main industries within the Study Area. The region surrounding Rockhampton, from the southern limit of the Study Area to St Lawrence, is heavily utilised as cattle grazing country. Agriculture, primarily sugar cane production, is the main land use of the region surrounding Mackay. Wheat, cotton, and pineapple plantations along with irrigated crops such as citrus, sunflower and soya beans all contribute to the growing agricultural sector of the central Queensland region. Coal mining is a major contributor to the economy of the region, being a key employer in the central Queensland region and accounting for around 78% of Queensland’s coal production (QDCILGP 2000). The tourism industry makes a significant contribution to the economy of the Mackay region and is emerging as a significant industry further south in the Study Area, in the Rockhampton/Yeppoon area (QDCILGP 2000). The area has a diversity of attractions, including providing access to the Great Barrier Reef and numerous islands, which entice a large number of visitors to the region each year. The Mackay region has an average maximum temperature of 26°C and an average minimum of 17°C. Rainfall in the region is seasonal with the majority of the annual rainfall of around 2000 mm falling in the summer months. Within the Study Area, mean annual rainfall ranges from 800 mm to 2000 mm, with the lowest rainfalls recorded in the Rockhampton and St Lawrence regions. Further details of the mean annual rainfall recorded in estuaries of the Study Area are listed in Table 2.1. Between 10 and 15 cyclones per decade are reported to occur in the Study Area (IMCRA Technical Group 1998). Tides in the Study Area range from 4 m to 9 m, with the greatest tidal range occurring within the Broad Sound Region (IMCRA Technical Group 1998). Further details of the tidal ranges of estuaries within the study area, as reported by Digby et al. 1999, are listed in Table 2.1. The majority of the Study Area, from Mackay to Ramsay Crossing falls within the Shoalwater Coast Bioregion (SCT) as defined in the Interim Marine and Coastal Regionalisation for Australia (IMCRA Technical Group 1998). The remainder of the Queensland Coastal Wetland Resources: Sand Bay to Keppel Bay. 3.
(14) Study Area to the north of Mackay falls in the Lucinda-Mackay Coast Bioregion (LMC). The Study Area lies adjacent to the Brigalow Belt North (BBN), Central Mackay Coast (CMC) and South Brigalow (BBS) Regions as defined in the Interim Biogeographic Regionalisation of Australia (Thackway and Cresswell 1995).. 150°. 151° 20°. 149°E. N WHITSUNDAY ISLANDS GROUP. Repulse Bay STUDY AREA 21°. Sand Bay. # MACKAY. 22°. Sarina #. Broad Sound St Lawrence #. St. He. yx. R.. Shoalwater Bay. t Ck 23°. r. be r. YEPPOON #. ROCKHAMPTON #. Keppel Bay. Curtis Island. 24°S. GLADSTONE # Coastline data: Commonwealth of Australia, AUSLIG.. FIGURE 2.1 Site map of the study area, Sand Bay to Keppel Bay, central Queensland.. 4. Queensland Coastal Wetland Resources: Sand Bay to Keppel Bay.
(15) TABLE 2.1 Hydrology and catchment details for the main estuaries within the study area.. WETLAND Constant Creek Leila Creek Pioneer River Baker's Creek Sandy Creek Louisa Creek Castrades Inlet Sarina Inlet Rocky Dam Creek Coconut Creek Cape Creek Knobler Creek Walter Hill Creek Marion Creek Basin Creek West Hill Creek Carmila Creek Feather Creek Thirsty Sound Clairview Creek Canoe Passage St. Lawrence Creek Island Head Creek Waverley Creek Styx River Ross Creek Herbert Creek Raspberry Creek Wadallah Creek Oyster Creek Port Clinton East Creek Shoalwater Creek Head Creek George's Creek Corio Bay Causeway Lake Cawarral Creek Pumpkin Creek Fitzroy River The Narrows. MEAN ANNUAL RAINFALL (mm) 1785 1785 1666 1359 1359 1359 1819 1819 1819 1474 1474 1474 1474 1474 1474 1430 1430 1430 1052 1052 1745 1052 1745 1052 822 902 902 902 1745 1745 1745 1745 1745 1745 1745 1745 1353 1084 1084 805 805. RUNOFF COEFFICIENT 0.36 0.36 0.41 0.44 0.38 0.38 0.29 0.29 0.29 0.35 0.35 0.35 0.35 0.35 0.35 0.36 0.36 0.36 0.19 0.49 0.21 0.21 0.21 0.21 0.27 0.22 0.22 0.22 0.21 0.11 0.21 0.21 0.11 0.21 0.21 0.21 0.27 0.33 0.33 0.06 0.12. EXTREME TIDAL RANGE (m) 6.1 6.1 6.1 6.1 6.4 6.4 6.4 6.3 6.3 6.3 6.3 6.3 6.3 6.3 6.3 6.3 7.5 7.5 7.4 7.5 6.4 7.4 6.4 7.4 7.4 6.4 7.4 6.4 6.4 6.4 5.1 6.4 6.4 6.4 6.4 5.1 5.1 4.9 4.9 4.9 5.0. CATCHMENT AREA (km2) 139 88 1580 230 678 33 45 144 539 16 51 17 9 107 110 143 150 49 311 264 56 469 138 506 1890 57 2286 64 22 108 257 67 443 224 127 514 32 169 104 142733 2668. Data compiled from the Australian Estuarine Database (Digby et al. 1999). Data for minor estuaries within the study area were not included in the database.. Queensland Coastal Wetland Resources: Sand Bay to Keppel Bay. 5.
(16) 2.2 Coastal Wetland Environments Mangrove, saltmarsh and seagrass communities are recognised for their value to fisheries production. These marine plants establish habitats that directly support local and regional inshore and offshore fisheries through the provision of food, shelter, breeding and nursery areas. Previous DPI research (Quinn 1992) has estimated that the estuarine habitats provided by mangroves and seagrasses are critical to more than 75% by weight of commercially and recreationally important fish and crustacean species during some stage of their life cycle (eg. mud and blue swimmer crabs, prawns, barramundi, threadfins, whiting, flathead, bream and mullet). Mangrove and seagrass communities form only part of a range of coastal habitats (along with saltmarshes, intertidal flats, rocky foreshores and coral reefs) that all provide a diversity of environments maintaining marine and estuarine ecosystems.. Fish Habitats Mapped in this Study For the purposes of this study, environments located between the highest astronomical tide contour and the low water mark (ie. the intertidal communities) are described collectively as coastal wetlands. The coastal wetlands mapped in this study include mangrove and saltmarsh communities. The absence of a universally accepted definition of a mangrove community leads to many different interpretations of areal extents of “mangroves”. Here, the term mangrove community refers to any community within the intertidal zone that is dominated by trees and shrubs. Saltmarshes are intertidal plant communities that are dominated by salt tolerant herbs and low shrubs, such as samphires and salt couches (Hopkins et al. 1998). Two subsets of this vegetation type are recognised in this study. Saltpans are those hypersaline areas that range from unvegetated claypans to those areas dominated by samphire vegetation. Saline Grasslands are those areas that are dominated by Sporobolus virginicus (salt couch). Mangroves Mangroves are a diverse group of predominantly tropical shrubs and trees growing in the marine tidal zone (Duke 1992). These marine plants serve a wide variety of functions (Claridge and Burnett 1993; Ewel et al. 1998) including: ♦ physical protection of the coastal fringe from erosion and flooding; ♦ sediment trapping; ♦ nutrient uptake and transformation; ♦ provision of food, shelter, breeding and nursery areas for a wide variety of marine and terrestrial animal species. At a regional scale, the distribution of mangrove species is determined by a number of factors including temperature, rainfall, catchment area and tides. It has been shown that mangrove species are limited in their latitudinal distribution by their physiological tolerance to low temperatures (Duke et al. 1998). The majority of mangrove species are limited to tropical environments where the mean winter temperatures are higher than 20oC. Consequently, mangrove species diversity generally decreases with increasing latitude. Additionally, areas of high freshwater availability (both as rainfall and runoff from riverine catchments) tend to support more species rich estuarine mangrove communities than areas of low freshwater availability. In Queensland this phenomenon is clearly 6. Queensland Coastal Wetland Resources: Sand Bay to Keppel Bay.
(17) demonstrated in the north of the State. The relatively dry coastline of the southern Gulf of Carpentaria (from the Northern Territory border to Flinders River) supports less than 20 species of mangrove (Bruinsma and Duncan 2000) whereas more than 30 species have been recorded for areas of similar latitude on the wetter eastern coastline of Australia (Lovelock 1993). Mangrove species are also variable in their tolerance to the variety of environmental parameters experienced in the intertidal zone, including salinity, soil type, frequency of inundation (both tidal and fresh) and wave action. Accordingly, mangrove species distribution within an estuary can generally be related to the variation of these factors and typical mangrove zones often result. For example, Closed Rhizophora zones (or communities) within Queensland generally occur on the water’s edge where they receive inundation with every high tide. In contrast, Open or Closed Ceriops communities, which occur towards the landward mangrove edge, are generally only inundated on the spring tides that occur once or twice per month. The primary production of mangroves varies between different communities. Factors affecting net primary productivity and forest growth include soil nutrient status and redox potential, salinity, temperature, light intensity, associated fauna and tidal flushing (Clough 1992; Amarasinghe and Balasubramaniam 1992). Important detrital, marine food webs, which are supported by primary production from mangrove trees in turn, support economically important commercial and recreational fisheries. Unfortunately, there is a lack of quantitative information regarding the direct benefits gained from the various mangrove forest community types. Section 2.3 contains further details of the relationships between coastal wetland communities and marine fauna. The following 22 mangrove species have been 1993; Wells 1983): ♦ Acanthus ilicifolius L. ♦ Acrostichum speciosum Willd. ♦ Aegialitis annulata R. Br. ♦ Aegiceras corniculatum (L.) Blanco ♦ Avicennia marina (Forsk) Vierh. ♦ Bruguiera exaristata Ding Hou ♦ Bruguiera gymnorrhiza L. Lam. ♦ Bruguiera parviflora (Roxb.) Griffith ♦ Ceriops tagal C. T. White ♦ Crinum pedunculatum R.Br. ♦ Cynometra iripa Kostel. ♦ Excoecaria agallocha L. ♦ Heritiera littoralis Aiton ♦ Hibiscus tiliaceus L. ♦ Lumnitzera racemosa Willd. ♦ Osbornia octodonta F. Muell. ♦ Rhizophora apiculata Blume ♦ Rhizophora lamarckii Montr. ♦ Rhizophora stylosa Griff. ♦ Sonneratia alba Sm. ♦ Xylocarpus granatum Koen ♦ Xylocarpus moluccensis Pierre. reported from the Study Area (Lovelock Holly mangrove Mangrove fern Club mangrove River mangrove Grey mangrove Rib-fruited orange mangrove Large−leafed orange mangrove Small−leafed orange mangrove Yellow mangrove Mangrove lily Wrinkle pod mangrove Milky mangrove Looking-glass mangrove Native hibiscus Black mangrove Myrtle mangrove Tall−stilted red mangrove Stilted mangrove Red mangrove Mangrove apple Cannonball mangrove Cedar Mangrove. Queensland Coastal Wetland Resources: Sand Bay to Keppel Bay. 7.
(18) Saltmarshes Saltmarshes are intertidal plant communities that are dominated by salt tolerant herbs and low shrubs, such as samphires and salt couches (Hopkins et al. 1998). In contrast to mangrove species, saltmarsh species diversity and community complexity in Queensland increases with increasing latitude (Zeller 1998). Although saltmarsh environments generally experience limited inundation with the high tides they can play an important role as fish habitat. In these environments, interactions of the soil, water and air provide optimal environmental conditions, which under specific circumstances allow fisheries resources to feed, grow and reproduce to complete their lifestyle (Beumer et al. 1997). Specifically, shallow tidal pools within the saltmarshes provide transitory feeding habitat for larval and juvenile fishes, and may support a variety of invertebrates (Zeller 1998). Unvegetated claypans can be important for the life cycles of certain fishes (eg. barramundi). In the Gulf of Carpentaria extensive claypans are flooded during the monsoon season. Major spawning of barramundi occurs just before or early in the wet season so that the juveniles can take maximum advantage of this temporary wetland habitat. The inundated claypans also allow extensive, seasonal migrations of juvenile and spawning fish moving along and among stream channels, tidal pools and coastal waters. Connolly (1999) recently studied the use by fish species of subtropical saltmarsh habitat. In this study it was confirmed that both vegetated and non-vegetated subtropical saltmarsh habitats are utilised by abundant and diverse communities of both estuarine-resident and estuarine-marine fish species. More than half of the fish species caught on the saltmarsh habitat were of direct economic importance, and several of these species were common without dominating the catch numerically. The distribution of fish on saltmarshes was found to be most strongly influenced by proximity to intertidal, mangrove-lined feeder creeks, with more species and more individuals near to creeks than further away (Connolly 1999).. Other Fish Habitats Not Mapped in this Study Seagrasses Seagrasses are productive flowering plants, which are able to complete their life cycle completely submerged beneath marine waters (Mateer 1998). In order to establish a healthy community, seagrasses require minimum exposure to air, shelter from high-energy waves, sufficient light penetration for photosynthesis and marine salinities. Consequently, coastal and surface topography, water depth and turbidity, and freshwater run-off all influence seagrass distribution and abundance patterns. Seagrass beds play an important role in coastal marine and estuarine systems. They provide food, habitat and shelter for many marine species (in particular, prawns and dugong) and contribute a large proportion of the primary production of coastal systems. Coles et al. (1987) mapped the broad distribution of seagrasses meadows in the coastal inshore waters and around the islands located between Bowen and Water Park Point, Corio Bay. The following 10 species were reported in the present Study Area:. 8. Queensland Coastal Wetland Resources: Sand Bay to Keppel Bay.
(19) ♦ ♦ ♦ ♦ ♦ ♦ ♦ ♦ ♦ ♦. Cymodocea serrulata (R. BR.) Aschers. and Magnus Halodule pinifolia (Miki) den Hartog Halodule uninervis (Forsk.) Aschers Halophila decipiens Ostenfeld Halophila ovalis (R. Br.) Hook.f. Halophila ovata Gaud. Halophila spinulosa (R. Br.) Aschers. Halophila sp. (identification uncertain) Syringodium isoetifolium (Aschers.) Dandy Zostera capricorni Aschers.. Lee Long et al. (1992) mapped the broad distribution of seagrasses in October 1988 from Water Park Point to Hervey Bay. Lee Long et al. (1997) mapped the distribution of seagrass meadows in the Shoalwater Bay during spring (September) 1995 and autumn (April) 1996. Natural variability in the species composition, density and biomass of seagrass communities over time results from the different responses of seagrasses to environmental parameters such as temperature, water turbidity, sediment stability and nutrient levels (English et al. 1994). For this reason, distribution patterns from previous studies can only be considered as ‘snapshots’ of seagrass distribution in a window of time. However, as these regions have supported seagrass communities in the past, it is possible that they may do so in the future, provided the environmental conditions for colonisation and maintenance of the meadows are favourable. Intertidal Flats, Rocky Foreshores and Coral Reefs Despite their often unrecognised role in primary production, ‘non-vegetated’ habitats such as intertidal flats, rocky foreshores and coral reefs are important fish habitats. Intertidal flats are defined as the zone exposed at low tide and submerged at high tide (Bird 1968), and may be non-vegetated sand or mud or colonised by seagrass or algal beds. Erftemeijer and Lewis (1999) recognised that intertidal mudflats constitute an important habitat that support a high biodiversity and biomass of benthic invertebrates, sustain productive fisheries and provide important feeding grounds for migratory and other shorebirds. Rocky foreshores provide a hard substrate for the attachment of algal flora as well as the long-term attachment of sessile invertebrates (such as barnacles, oysters and tube worms) (Zeller 1998). Both macro and micro algae, particularly benthic microalgae, play a key role in primary production and may in total contribute more than half of the total net production (Alongi 1998). Coral reefs provide shelter and food for reef and pelagic animals that colonise or are attracted to these biological structures (eg. sponges, coral and fish).. 2.3 Project Rationale There is a need to identify and map fish habitat for the management and conservation of the resource through the planning and declaration of Marine Protected Areas (MPAs) (e.g. FHAs) and Ramsar sites, as well as a requirement for conducting further research into the. Queensland Coastal Wetland Resources: Sand Bay to Keppel Bay. 9.
(20) interactions between fauna and the habitat. Studies combining data on coastal wetland primary productivity, connectivity between habitat types, fish species associated with particular habitats and feeding strategies of these fish species and will contribute to a better understanding of the value of particular habitats to fisheries productivity. Continuation of the mapping of the coastal wetland communities of the Queensland coastline will provide quantitative data for incorporation into these studies. Additionally, it provides the base information required for monitoring short and long term changes in coastal wetland habitats and implementing appropriate management measures.. 10. Queensland Coastal Wetland Resources: Sand Bay to Keppel Bay.
(21) SECTION 3 METHODS 3.1 Data Maps of coastal wetland communities were produced from Landsat 5 Thematic Mapper (TM) satellite imagery. Three full scenes and two quarter scenes were required to map the entire study area. The areas mapped from each of these scenes are listed below. ♦ Mackay (16 July 1997 full scene): Sand Bay to Ince Bay, ♦ Sarina (20 July 1995 quarter scene): Ince Bay to West Hill, ♦ St Lawrence (20 July 1995 full scene): West Hill to Port Clinton, ♦ Yeppoon (13 July 1995 quarter scene): Port Clinton to Yeppoon ♦ Gladstone (16 June 1997 full scene): Yeppoon to Ramsay Crossing, The Narrows Landsat TM scenes of the same date were not used due to the limited availability of data. The imagery used in this study was obtained with final radiometric correction and geometric rectification using ground control points already complete. The scenes were rectified to the Australian Map Grid (Zone 55 and 56) using the Australian National Spheroid and the Australian Geodetic Datum 1984. The spatial resolution of Landsat TM data is 25 m x 25 m. The spectral characteristics of the data, as well as details of the Landsat satellites are outlined in Appendix 5. Aerial photography was used to aid in the classification of the satellite imagery. The photography used in this study is listed in Table 3.1. The approximate coverage of these aerial photos is included in Figure 3.1 TABLE 3.1 Aerial photography utilised in the study. AERIAL PHOTOGRAPHY BPA St Lawrence to Townsville BPA Urangan to St Lawrence BPA Urangan to St Lawrence BPA Urangan to St Lawrence. YEAR 1993 1996 1996/1997 1992. SCALE 1: 50 000 1: 50 000 1: 12 000 1: 12 000. 3.2 Mapping Methods The satellite imagery was processed using ERDAS Imagine® 8.3.1 on a PC with a MS Windows NT operating system. Six TM bands (excluding Band 6 — the thermal band) were contrast stretched using a linear stretch and breakpoints to highlight the intertidal regions. All water bodies were spectrally masked out using a TM band 4 (near infrared) image. In order to limit the area of the classification to the coastal wetland environments, the terrestrial land features were masked out manually. The upper limit of the intertidal zone was identified using a false colour composite of TM bands 1, 4 and 5 (through blue, green and red colour guns, respectively) in conjunction with colour aerial photography, topographic maps and fieldwork. The greenness and wetness bands of a tasselled cap analysis were also used to assist in defining the extent of the coastal wetland communities. The remaining imagery, which included the intertidal zone and a small strip of adjacent coastal land, was processed using an unsupervised classification procedure. ERDAS Queensland Coastal Wetland Resources: Sand Bay to Keppel Bay. 11.
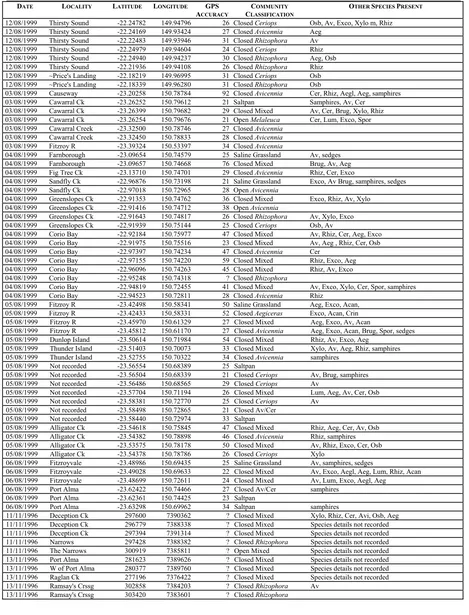
(22) Imagine uses the Iterative Self-Organising Data Analysis Technique (ISODATA) classification algorithm in order to create clusters of pixels that are spectrally similar. The ISODATA utility repeats the clustering of the image until either a maximum number of iterations has been performed, or a maximum percentage of unchanged pixels (convergence threshold) has been reached between two iterations (ERDAS 1997). A limit of thirty iterations or a convergence threshold of 99% was set in this classification. The resulting classes were labelled according to their dominant cover type with the aid of the aerial photography. Clumps of pixels less than 0.5 ha were eliminated and the image was smoothed using a three by three pixel, moving kernel. The classification was converted from raster to vector format using ARC/INFO® GIS software. To improve cartographic presentation of the data, the jagged vector boundaries were splined and generalised and polygons with areas under 0.5 ha were excluded. The coverage was then converted to an ESRI shapefile and projected to geographics. Appendix 6 contains the metadata for this shapefile. The shapefiles were overlaid on a Band 3 (visible red) Landsat TM image. Maps were produced using ARCVIEW® GIS Version 3.2 at a scale of 1: 100 000 (Appendix 7: Sheets 1–23).. 3.3 Field Methods The computer-based community classification was validated with fieldwork conducted during August 1999 and December 1999. One hundred and forty-nine sites were selected on the basis of their accessibility by either vessel, 4WD vehicle or on foot. At each of these sites, information on mangrove community floristics and structure was documented. At each site data recorded included the specific composition of mangroves, dominant genus, estimated density (Projective Foliage Cover − PFC) of each vegetation layer, composition and hardness of substrate, and presence/absence of seedlings, samphires, grasses, algae, leaf litter, roots, ferns, epiphytes, sedges and ponds. The distribution of field sites accessed in this Study is displayed in Figure 3.1. The detail of the species composition at each of these sites is included in Appendix 8. A Garmin 4S XL Personal Navigator Global Positioning System (GPS) was used to determine the latitude and longitude of each field site. The average estimated error recorded by the GPS was 25 m (~1 pixel) with a maximum error of 133 m and a minimum error of 21 m. The amount of fieldwork undertaken was limited by accessibility to the mangroves and by time and budget constraints. The information collected from the fieldwork was used to aid in the classification of the satellite image and the interpretation of the aerial photography. As the field sites were used to derive the final wetland classification they were not used in assessing its accuracy. Rather a set of random points was generated in order to assess the accuracy of the classification (Section 3.5).. 12. Queensland Coastal Wetland Resources: Sand Bay to Keppel Bay.
(23) Distribution of Ground Truthing Data in the Study Area approximate airphoto coverage #. ## # # #. field sites coastal wetlands. # #. # ##. #. # # # # ##. ## ##. #. ### # ### # ## # ## ## # ## #### # # # # ## # # # ##. # # # # # # ## # # # # # #. N. 50. 0. Kilometres 50. # #. # ## # # # # ##### ## ##. # # # ## #. #. Coastline data: Commonwealth of Australia, AUSLIG.. FIGURE 3.1 Distribution of ground truthing data utilised in this study.. 3.4 Classification Details Mangroves were classified to the community level on the basis of dominant genus present and relative densities of the whole community. The density of the community was determined by estimating the PFC. A canopy cover of greater than 50% was classified as closed, while less than 50% was identified as open. The standard Specht (1987) vegetation categories of ‘forest’ and ‘shrub’, which are based on height, were not included in this classification. This is due to the fact that community height cannot be determined from the Landsat TM data. Only areas subject to tidal inundation were included in this mapping exercise. Excluded classes included permanent pools of water and elevated land containing terrestrial vegetation. Tidally exposed intertidal flats and seagrass beds were also excluded.. Queensland Coastal Wetland Resources: Sand Bay to Keppel Bay. 13.
(24) 3.5 Accuracy Assessment A set of 320 accuracy assessment points was generated using a random stratified sampling procedure on ERDAS Imagine. The community present at each of these points was determined from the aerial photography and this was compared to the class assigned on the maps. An error matrix using this data was generated and the overall accuracy along with user’s accuracy and producer’s accuracy was calculated. The overall classification accuracy is a measure of the number of correct pixels in the error matrix. User’s accuracy is the probability that a pixel classified on the map actually represents that category on the ground and producer’s accuracy calculates the probability of a reference pixel being correctly classified (how well a certain area can be classified) (Jensen 1996). An overall evaluation of the project is included in Appendix 9.. 3.6 Overview Map of Fish Habitats An overview map of fish habitats was created from various sources using ARCVIEW ® Version 3.2 GIS software. Along with the mangrove and saltmarsh communities mapped as part of this study, spatial datasets of seagrass meadows, intertidal foreshore flats, reefs and coral cays were obtained. A list of the datasets obtained, their source and currency is included in Table 3.2. TABLE 3.2 Details of digital datasets used in the fish habitats overview map. TITLE Coral cays. CUSTODIAN Great Barrier Reef Marine Park Authority (GBRMPA) GBRMPA. CURRENCY unknown. Foreshore flats Seagrass beds-Bowen to Water Park Point Seagrass beds-Water Park Point to Hervey Bay Freshwater swamps. GBRMPA Queensland Department of Primary Industries (QDPI) Queensland Department of Primary Industries (QDPI) Australian Land, Survey and Information Group (AUSLIG). unknown March 1986. Dams and Weirs. Queensland Department of Natural Resources (QDNR). 31-12-1994. Reefs. 13-01-1994. DESCRIPTION Major coral cays in the GBR region Major coral reef structures in the GBR region Intertidal foreshore areas Seagrass meadows. October 1988 Seagrass meadows ~1988. Freshwater swamps theme from the digital GEODATA TOPO-250K topographic map series. Location of major dams and weirs in Queensland.. The AUSLIG GEODATA product, from which the freshwater swamps theme was taken, is primarily sourced from the 1: 250 000 scale National Topographic Map Series, which was completed in 1988. In this series, swamps are defined as land that is so saturated with water that it is not suitable for agricultural or pastoral use and presents a barrier to free passage. It is often covered with characteristic grass and reed growths, and the degree of wetness may vary with season (AUSLIG 1994).. 14. Queensland Coastal Wetland Resources: Sand Bay to Keppel Bay.
(25) 3.7 Overview of Existing Conservation Measures The extent of existing conservation measures in the Study Area was investigated using data from various sources using ARCVIEW® Version 3.2 GIS software. A list of the spatial datasets, their source, currency and a brief description is included in Table 3.3. TABLE 3.3 Details of digital datasets used in examining existing conservation measures. TITLE GBRMP Zones. CUSTODIAN GBRMPA. Protected Areas. Environmental Protection Agency (EPA). GBRMPA Dugong Protection Areas QDPI Fish Habitat Areas EPA Ramsar sites of Queensland. CURRENCY 1984, correct as of 01-01-1999 17-12-1999. 01-11-1998 13-08-1999 22-07-1999. DESCRIPTION Management zones of the GBRMP National parks and resources reserves gazetted under the Nature Conservation Act 1992 up to 17-12-1999. Nature refuges and coordinated conservation areas are stored in another dataset. Dugong protection areas gazetted from Hinchinbrook to Great Sandy Strait. Fish Habitat Areas in Queensland gazetted under the Fisheries Act 1994. Important wetland sites declared under the Ramsar Convention 1971.. 3.8 Assessment of Coastal Wetlands for FHA Nomination The suitability of various coastal wetland systems for nomination as candidate areas for FHA declaration is currently assessed on the basis of the following criteria: 1. Size 2. Diversity of or specific habitat features 3. Diversity of or specific marine fauna and flora 4. Level of existing and future disturbances 5. Unique features 6. Existing or potential fishing grounds 7. Protected species The details of the methods of assessment of these criteria are included in Table 3.4.. Queensland Coastal Wetland Resources: Sand Bay to Keppel Bay. 15.
(26) TABLE 3.4 Details of the methods of the coastal wetland significance assessment. CRITERIA. SUBCATEGORIES. Size Diversity of or specific habitat features. Diversity of Mangrove and Saltmarsh Communities. Presence of Intertidal Flats Adjacent Freshwater Swamps Diversity of or specific marine fauna and flora. Level of existing and future disturbances. Significant Dams and Weirs Disturbance to Adjacent Terrestrial Vegetation. Unique Features Existing or potential fishing grounds. Significant/Important Fishing Grounds. Protected species. Not included in this evaluation.. 16. DETAILS Area of mangrove and saltmarsh communities, calculated in hectares. High (H): 11–14 mangrove and saltmarsh communities present Medium (M): 5–10 mangrove and saltmarsh communities present Low (L): 1–4 mangrove and saltmarsh communities present The number of mangrove and saltmarsh communities was calculated on the basis of the mapping conducted for this investigation. See Section 4.1 for the descriptions of these mapping units. Comments on the extent of intertidal flats along the coastline were based the GBRMPA foreshore flats coverage as well as 1: 50 000 aerial photograph interpretation. Presence (Y) or absence (N) of freshwater swamps adjacent to the coastal wetland communities. O indicates freshwater swamps nearby but not adjacent. The “swamp” coverage from the AUSLIG 1: 250 000 digital topographic series was used. See Map 5.1. Comprehensive surveys of species diversity for each wetland system were not conducted as part of this investigation. Specific, noteworthy marine flora communities have been described in Section 5.8 and are recorded as unique features (see below). Information concerning the diversity of fauna was not included in this evaluation. Presence (Y) or absence (N) of significant dams or weirs on the river or creek. The locations of dams and weirs in Queensland collected by the Dept. of Natural Resources. See Map 5.1. Near Pristine (NP) : natural cover >90% Largely Unmodified (LU) : natural cover ~65–90% Modified (M) : natural cover ~35–65% Severely Impacted (SI) : natural cover <35% Adjacent terrestrial vegetation refers to the vegetation within 5km of the upper intertidal limit. Presence (Y) of unique features. The details of these features are included in Section 5.8. Significant (Y) fishing grounds. Assessed from local knowledge of each coastal wetland system and/or from literature review. Further details of important fisheries in the region are reported in Section 8. All marine plants are protected under fisheries legislation. Other information on protected species was not included in this evaluation.. Queensland Coastal Wetland Resources: Sand Bay to Keppel Bay.
(27) SECTION 4 RESULTS 4.1 Description of the Mapping Units CLOSED RHIZOPHORA FIGURE 4.1 Occurs fringing waterways low in intertidal zone with roots submerged during Habitat high tides. Usually dominated by tall, mature Rhizophora spp. which form a dense canopy Canopy (approximately 5−6 m) with a Projective Foliage Cover (PFC) greater than 50%. Other species that may occur in this community are A. marina (emergent), B. gymnorrhiza, and C. tagal. Poorly developed or completely absent. Shrub layer Ground cover Rhizophora spp. stilt roots with a sparse cover of Rhizophora spp. seedlings. CLOSED AVICENNIA FIGURE 4.2 Can be found in a diverse range of intertidal environments from the seaward edge Habitat (as a pioneer), to accreting banks (as a fringe), to the landward edge. A. marina, with occasional C. tagal and Rhizophora spp., forming a dense canopy Canopy with a PFC of greater than 50%. Heights less than 10 m often around 5 m. May have A. corniculatum and C. tagal forming an understorey. Shrub layer Ground cover A. marina pneumatophores and seedlings form a ground cover. OPEN AVICENNIA Found on the seaward edge as a pioneer and on the landward edge that is only Habitat inundated by the highest spring tide. A. marina plants form a canopy that has a PFC of less than 50%. Height varies, Canopy generally <1 m in areas bordering on Saltpans and up to 10 m in pioneering zones. Generally absent. Shrub layer Ground cover Occasional presence of samphires (on the landward edge) and a sparse coverage of A. marina pneumatophores. CLOSED CERIOPS FIGURES 4.3 Generally occur on upstream creek edges and towards the upper intertidal limit Habitat landward of Rhizophora spp. communities on more elevated land. Only inundated by the spring tides. Dominated by C. tagal with occasional A. marina, B. gymnorrhiza and L. Canopy racemosa. Height of the canopy across sites varies (from approximately 1–4 m) however at an individual site is generally remarkably uniform. PFC greater than 50%. Generally absent. Shrub layer Ground cover Consists of sparse cover of seedlings and roots of the species present. OPEN CERIOPS Habitat Canopy Shrub layer Ground cover. Occurs on the landward edge of the intertidal zone and is inundated by only the high spring tides. This community often surrounds Saltpans and is rarely on the water’s edge, except on eroding banks. A community dominated by C. tagal with occasional A. marina emergents. The PFC is less than 50%; height varies from <1 m in the extremely saline areas to approximately 3 m. Occasional presence of other species such as A. corniculatum and A. marina. Consists of seedlings of the species present along with a sparse to open coverage of samphires and grasses.. Queensland Coastal Wetland Resources: Sand Bay to Keppel Bay. 17.
(28) FIGURE 4.1 Closed Rhizophora along a creek at Mangrove Island.. FIGURE 4.2 Closed Avicennia at Rocky Dam Creek.. 18. Queensland Coastal Wetland Resources: Sand Bay to Keppel Bay.
(29) CLOSED AEGICERAS FIGURE 4.4 Occurs in the upper tidal reaches and on accreting banks of creeks and rivers Habitat over a wide range of salinities. Dominated by A. corniculatum, often with A. marina emergents and A. annulata Canopy as a subdominant. Generally absent. Shrub layer Samphires, salt couch and the mangrove fern A. speciosum are often found in the Ground cover understorey of this community type.. CLOSED RHIZOPHORA/AVICENNIA FIGURE 4.5 Generally occurring within Closed Rhizophora communities. Habitat A mixed community of A. marina and Rhizophora spp. together forming a closed Canopy canopy with a PFC of greater than 50%. The understorey may consist of A. annulata, A. marina and Rhizophora spp. Shrub layer Roots and seedlings of the canopy species. Ground cover. CLOSED RHIZOPHORA/AEGICERAS Found in sheltered areas with considerable marine influence e.g. close to the Habitat mouths of rivers and creeks. A closed canopy of Rhizophora spp. forms a large component of this community. Canopy A low A. corniculatum community sometimes forms a narrow fringe on the water’s edge. The understorey in this community is dominated by A. corniculatum, which Shrub layer forms a considerable component of the community. Rhizophora spp. roots and seedlings of the species present. Ground cover. CLOSED AVICENNIA/CERIOPS FIGURE 4.6 Commonly bordering Saltpans in areas only inundated during spring tides. Habitat A mixed community of A. marina and C. tagal forming a canopy with a PFC of Canopy greater than 50%. Generally a low community with a canopy of <1.5 m. A. annulata, A. corniculatum and L. racemosa may be present. Shrub layer Occasional presence of samphires and seedlings of the species present. Ground cover. OPEN AVICENNIA/CERIOPS Commonly bordering Saltpans in areas only inundated during spring tides. Habitat A mixed community of A. marina and C. tagal forming a canopy with a PFC of Canopy less than 50%. Generally a low community with a canopy of <1.5 m. A. annulata, A. corniculatum and L. racemosa may be present. Shrub layer Presence of samphires and seedlings of the species present. Ground cover. CLOSED MIXED Habitat Canopy Shrub layer Ground cover. FIGURE 4.7 Generally found on the landward edges of mangrove communities and in the upper tidal reaches of creeks and rivers. A closed mix of species in which a variety of the 22 species present in this region may occur. A shrub layer consisting of juveniles of the various canopy species may be present. Seedlings and roots of the various species along with sparse samphires and grasses.. Queensland Coastal Wetland Resources: Sand Bay to Keppel Bay. 19.
(30) FIGURE 4.3 Closed Ceriops on Long Island.. FIGURE 4.4 A Closed Aegiceras fringe at Price’s Landing, with Closed Rhizophora behind.. 20. Queensland Coastal Wetland Resources: Sand Bay to Keppel Bay.
(31) FIGURE 4.5 Closed Rhizophora/Avicennia along a waterway on Mangrove Island. CLOSED CERIOPS DIEBACK FIGURE 6.2 Occurs in only two locations in the Study Area, Clairview and Bar Plains, St Habitat Lawrence. Dense community of dead C. tagal where canopy cover would have been >50% Canopy when the community was living. Generally absent. Shrub layer Ranging from no vegetation to an open cover of samphires and mangrove Ground cover seedlings.. SAMPHIRE-DOMINATED SALTMARSH Occurs along the landward edge of the intertidal zone in a hypersaline Habitat environment that is only inundated by the highest spring tides. Generally absent. Canopy Absent. Shrub layer Dense coverage of samphires within which a sparse coverage of salt couch Ground cover (Sporobolus virginicus) and sedges may also occur.. SALTPAN Habitat Canopy Shrub layer Ground cover. FIGURE 4.8 Occurs along the landward edge of the intertidal zone in a hypersaline environment that is only inundated by the highest spring tides. Sparse stunted (<1 m) individuals of various mangrove species may occur (e.g. C. tagal, A. marina). Some samphire species may be present as very small shrubs. Ranging from no vegetation to closed samphires and algae, commonly an open coverage of samphires.. SALINE GRASSLAND FIGURE 4.9 Occurs along the landward edge of the intertidal zone in a hypersaline Habitat environment that is only inundated by the highest spring tides. Sometimes extends past the upper intertidal limit into open Casuarina communities. Generally absent. Canopy Absent. Shrub layer Ranging from sparse to dense coverage of salt couch (Sporobolus virginicus) Ground cover within which a sparse coverage of samphires and sedges may also occur. Queensland Coastal Wetland Resources: Sand Bay to Keppel Bay. 21.
(32) FIGURE 4.6 Closed Avicennia/Ceriops at Rocky Dam Creek.. FIGURE 4.7 Closed Mixed along a waterway on Mangrove Island.. 22. Queensland Coastal Wetland Resources: Sand Bay to Keppel Bay.
(33) FIGURE 4.8 A Saltpan community at Charon Point.. FIGURE 4.9 A Saline Grassland community at Rocky Dam Creek.. Queensland Coastal Wetland Resources: Sand Bay to Keppel Bay. 23.
Figure
Related documents
Draft press program for HRH The Crown Princess's visit with The Mary Foundation in Morocco, 2-4 September 2013 (22.08.2013).. Please notice that the press program will be
(My boss has a good relationship with us that is why we are careful in doing our jobs well. We feel good about.. Exploring sama and gaan ng loob : Finding connections in work
Since the most important sea turtle nesting beaches in Greece are known and protected, it became a priority to deal with turtle mortality at sea. Data collected by ARCHELON
Multispecies and Stochastic issues: Comparative Evaluation of the Fisheries Policies in Denmark, Iceland and Norway.. Asymmetric information and uncertainty: The usefulness
27 3-5 Sep.06 Primary Health Centre,Loharu 264 28 Pawan Aggarwal Loharu Gramin Vikash Mandal, Nihalgarh (Bhiwani).. Free Eyes
We tested many EvMs previously applied to GO annotations using three datasets: CAFA1 [ 2 ], MouseFunc [ 4 ] and 1000 randomly selected GO annotated sequences from the UniProt
The Sussex Mk4 Electrical Impedance Mammography (EIM) system has been developed for the investigation of early stage breast lesions. Investigations have shown that
Technology and Readmission Rates - How One Affects the Other August 21, 2015 3:25 pm | by Sean Fenske, Editor-in-Chief, @SeanFenske Healthcare Happenings: Plague, Libido Pill and
