Complete removal of arbitrarily strong and arbitrarily
located auto correlation artifacts in spectral domain
optical coherence tomography: Demonstration of an
efficient and cost effective technique
Hari Nandakumar, Satya Prasanna Mallick and Shailesh Srivastava
Department of Physics, Sri Sathya Sai Institute of Higher Learning, Prasanthi Nilayam, AP, 515134 India
Abstract
The proof-of-principle demonstration of a simple, yet effective method of
autocorrelation artifact removal for optical coherence tomography (OCT) is
presented using a custom-designed parallel spectral-domain OCT (SD-OCT)
instrument. Our real-time method is based on time-averaged sampling of
a sinusoidal phase modulation in the reference arm. Unlike other existing
methods, our technique can completely eliminate arbitrarily located,
arbi-trarily strong autocorrelation artifacts.
Keywords: Optical coherence tomography, Imaging systems, Tomographic
imaging
1. Introduction
1
Optical Coherence Tomography (OCT) is a non-destructive tomographic
2
imaging modality using non-ionizing photons. OCT can be regarded as an
op-3
tical analog to Ultrasound scanning commonly used in medicine, but delivers
4
micron-level depth resolution compared to centimeter-scale resolutions with
5
Ultrasound [1]. OCT first became popular in ophthlmology in the 1990s [2, 3]
6
and subsequently became an established eye care tool [4]. Advances in OCT
7
technology have seen several generations of products with improved
resolu-8
tions and shorter acquisition times. Initial time-domain systems (TD-OCT)
9
were followed by Fourier-domain systems (FD-OCT) which could be
imple-10
mented without a moving reference arm. FD-OCT devices can be further
11
of two types, spectral-domain systems (SD-OCT) or swept-source devices
12
(SS-OCT). OCT now sees applications in cardiology, dentistry, pathology
13
and dermatology in addition to non-destructive materials testing, historical
14
artifact analysis and many other fields [5].
15
Recently, our group demonstrated a fresh approach to background
sub-16
traction in TD-OCT, which we termed theJ0 null technique [6], briefly
men-17
tioning that the technique should also work for autocorrelation removal in
18
FD-OCT. In this paper, we apply that technique to SD-OCT and
convinc-19
ingly demonstrate its utility in the removal of arbitrarily strong
autocorre-20
lation artifacts. Autocorrelation artifact removal is particularly important
21
for OCT studies on samples which have multiple layers with strong
reflec-22
tivities. The traditional method of ignoring autocorrelation by increasing
23
the reference arm reflectivity [7] would not suffice in such cases. A variety
24
of autocorrelation removal techniques have been suggested over the years,
25
like averaging spectra over multiple points [8], using resonant acquisition
26
[9], using an off-axis reference beam [10], dispersion encoding [11], various
27
phase shifting methods [12, 13, 14] and various balanced detection methods
[15, 16]. Additionally, several computational autocorrelation removal
tech-29
niques [17, 18, 19] have also been proposed. Comparing these with ourJ0null
30
method, we find that the most important advantages of our method are: its
31
application to removal of arbitrarily strong and arbitrarily placed
autocorre-32
lation artifacts, ease of implementation, and suitability for use with low-cost
33
parallel OCT devices.
34
2. Theoretical background
35
OCT theory tells us that in the frequency domain, the intensity at a
par-36
ticular point on the image plane is represented by the spectral interferogram
37
[20]
38
I(x, y, k) =S(k)·rR2
+ 2S(k)rR
Z ∞
−∞
r0s(x, y, ls)cos(2k(nsls−lR))dls
+S(k)
Z ∞
−∞
r0s(x, y, ls)exp[i2k(nsls)]dls
2
(1)
where S(k) is the source power spectral density, rR is the reference arm
39
amplitude reflectivity, r0s(x, y, ls) is the sample arm amplitude reflectivity
40
density located at a path length ls inside the sample and ns is the refractive
41
index of the sample. The first term in the right-hand side of equation (1) is
42
the DC or reference intensity term. The second term in equation (1) is the
43
desirable one in FD-OCT, and is used to extractrs0(x, y, ls) using the inverse
44
Fourier transform. The third term is the self-interference or autocorrelation
45
term, which is undesirable and causes artifacts in OCT reconstruction. As
46
mentioned above, various methods have been used to minimize artifacts from
the autocorrelation term. We find that theJ0null technique presents a simple
48
and robust way of eliminating this term when phase noise due to vibration
49
or sample motion causes difficulties in implementing phase shifting methods.
50
If the reference arm undergoes a sinusoidal phase modulation, the spectral
51
interferogram in equation (1) becomes
52
IJ0(x, y, k) = S(k)·r
2 R
+ 2S(k)rR
Z ∞
−∞
rs0(x, y, ls)cos[2k(nsls−lR)−M sin(ωt+θ)]dls
+S(k)
Z ∞
−∞
rs0(x, y, ls)exp[i2k(nsls)]dls
2
(2)
Here, the Bessel function of the first kindJ0 makes its appearance by the
53
use of the series
54
cos[xsin(θ)] = J0(x) + 2
∞
X
n=1
J2n(x)cos(2nθ) (3)
and
55
sin[xsin(θ)] = 2
∞
X
n=1
J2n−1(x)sin[(2n−1)θ] (4)
The second term of equation (2) completely vanishes when the amplitude
56
M equals theJ0 null amplitude, provided the acquisition time of the spectral
57
interferogram is an integral multiple of the modulation time-period [21] or
58
is long enough to average over several cycles of the phase modulation of the
59
reference arm. Subtracting the spectral interferogram obtained with the J0
60
null from the interferogram in Eq.. 1, we obtain a spectral interferogram free
from autocorrelation artifacts. This forms the basis for our autocorrelation
62
artifact removal scheme, which we refer to as the J0 null technique.
63
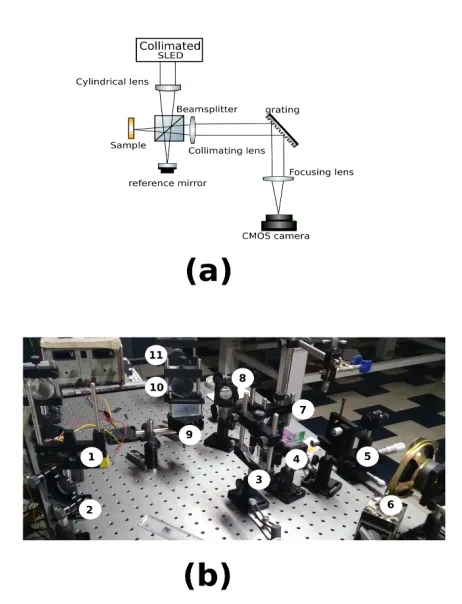
Figure 1: (a) Schematic and (b) photograph of the parallel FD-OCT instrument used in
our study. Labelled components: 1, SLED source; 2, steering mirror; 3, cylindrical lens;
4, cube beamsplitter; 5, sample; 6, reference mirror; 7, collimating lens; 8, steering mirror;
9, grating; 10, imaging lens; 11, camera.
3. Experimental results and conclusions
64
Experimental validation of our technique was done using a lab-made
par-65
allel SD-OCT [22] instrument, also known as line-field OCT [23, 24] as shown
in figure 1. A cylindrical lens with f = 15cm focused the collimated beam
67
from an SLED source (Exalos EXS210022-03) onto a 50 µm vertical line on
68
the sample. A reflection grating with 1200 lines/mm (Newport
33067FL01-69
360R) and a CMOS camera (QHY5L-II M) made up the spectrometer of our
70
SD-OCT. Light from each point on the illuminated vertical line on the
sam-71
ple was dispersed horizontally into a spectrum, thus filling the 2D camera
72
surface. Since the camera acquires the spectra of all the points on the
illumi-73
nated vertical line on the sample in a single exposure, this parallel SD-OCT
74
setup delivers single-shot B-scans. At low resolutions, 320x240 frame rate
75
captures resulted in 240x80 B-scans at 148 frames per second (fps) with our
76
system, which is 35,520 A-scans per second. At full 1280x960 resolution, 2x2
77
binning and FFT resampling to 2096 points resulted in 10 fps 480x320
B-78
scans, ie. 4,800 A-scans per second, limited by our real-time computational
79
speed. Lateral resolution was limited by our optics, and was experimentally
80
found to be 40µm by clearly resolving Group 3 Element 5 of a USAF
tar-81
get, using a translation stage for repeated B-scans across its surface. Axial
82
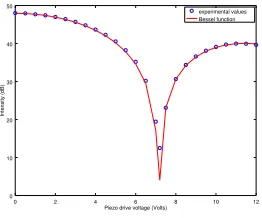
0 2 4 6 8 10 12
0 10 20 30 40 50
Piezo drive voltage (Volts)
Intensity (dB)
experimental values Bessel function
Figure 2: Calibration curve, showing intensity of OCT reflectance at a point as a function
of piezo drive voltage. The J0 function is traced out, with a null at 7.20 V for vibration
resolution was limited by our choice of spectrometer bandwidth. We chose
83
to be able to image a larger depth, 6.4mm, at the cost of 20µm per pixel
84
axial resolution. Data acquisition and real-time signal processing was done
85
on a desktop computer (Intel i5, 8 GB RAM) running our open source
soft-86
ware [25] which uses OpenCV[26]. The reference arm mirror modulation was
87
done by a piezo actuator (Steminc SMPAK155510D10) driven by a function
88
generator (Scientific SM5070). Representative calibration data relating the
89
reference arm vibration and piezo drive voltage is presented figure 2, wherein
90
the null of the J0 curve is clearly defined.
91
Our OCT system had a sub-50 dB dynamic range due to the 23ke−
equiv-92
alent full-well-capacity of our camera [27]. The ease in which the J0 null
93
subtraction can be implemented helps us to use it for repeated subtraction,
94
which yields higher Signal to Noise Ratio (SNR) than a single subtraction,
95
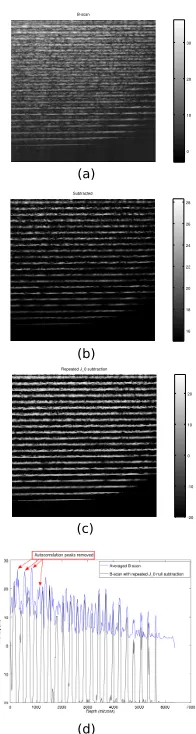
due to the effect of averaging. Figure 3 shows a stack of glass cover-slips
96
imaged with our OCT instrument. Since the cover-slips have reflectivities
97
similar to our reference arm, strong autocorrelation artifacts are seen in
fig-98
ure 3 (a). Figure 3 (b) shows autocorrelation removal by a single J0 null
99
subtraction. Figure 3 (c) and (d) show around 40 dB of autocorrelation
re-100
moval by repeated J0 null subtraction. The process we followed for repeated
101
null subtraction is explained below.
102
In order to bring out signal buried in our noisy acquired data, we
re-103
peated adding B-scans and subtracting J0 null frames 10 times for 10
av-104
eraged frames. This is similar to the standard lock-in detection techniques
105
commonly used with optical choppers, wherein the signal gets sequentially
106
added while the noise gets cancelled due to being alternately added (+1)
and subtracted (−1) on account of the square wave reference. For enhanced
108
autocorrelation removal efficiency, since the autocorrelation signal may be
109
riding on top of noise and hence may be higher in some B-scan frames than
110
B-scan
0 10 20 30
(a)
Subtracted
16 18 20 22 24 26 28
(b)
Repeated J_0 subtraction
-20 -10 0 10 20
(c)
0 1000 2000 3000 4000 5000 6000 7000 -20
-10 0 10 20 30
Depth (microns)
In
te
n
sit
y
(d
B
)
Averaged B-scan B-scan with repeated J _0 null subtraction Autocorrelation peaks removed
(d)
Figure 3: (a) 10x10 averaged B-scan of a stack of coverslips with strong autocorrelation
artifacts. Lateral extent (x axis) is 6.29 mm and axial extent (y axis) is 6.6 mm. (b)
Au-tocorrelation artifacts removed by singleJ0null subtraction. (c) Autocorrelation artifacts
removed more efficiently and dynamic range improved by repeated J0 null subtraction.
in theJ0 null frames, we multipled the B-scan frames by a fudge-factor of 0.8
111
before the subtraction. After each subtraction, any negative numbers were
112
thresholded to zero before repeating the process for the next set of frames.
113
This thresholding process allows even weak signals which are just able to
114
raise above the noise floor in any one signal frame to be added to the final
115
averaged result. The fudge factor is finally divided out.
116
We note that the J0 null technique is insensitive to phase noise due to
117
vibration, due to the fact that no particular phase relationship needs to be
118
maintained between the two spectral interferogram acquisitions. This is the
119
advantage of our technique over multi-shot phase shifting [13] techniques.
120
Single-shot phase shifting techniques [14] would also have vibration
insen-121
sitive behaviour similar to our technique, but when used with 2-D sensors,
122
single-shot phase shifting is generally cumbersome, either having to use
mul-123
tiple cameras [28] or results in lowering of available pixels in the sensor [29].
124
Our technique results in a subtraction similar to using an optical switch in
125
the reference arm [30], but with the advantage of low-cost implementation for
126
single-shot B-scan imaging. Other advantages of our J0 null technique over
127
the use of an optical switch are, enhanced DC removal along with subtraction
128
of reference mirror blemishes. Computational autocorrelation removal comes
129
with caveats on the location and strength of the autocorrelation artifact,
130
while the J0 null technique has no such limitations. Dispersion encoding and
131
subsequent reconstruction of a full-range signal is an attractive technique,
132
but requires more than double the computational effort [11] needed in our
133
method. The efficiency of autocorrelation removal with theJ0 null technique
134
does depend on the accuracy with which the null point was determined by
the initial calibration, but is thereafter only limited by the SNR of the
mea-136
surements. In conclusion, we have demonstrated a new technique for removal
137
of autocorrelation which can work with arbitrarily strong and arbitrarily
lo-138
cated autocorrelation artifacts. Our technique is specially suited for parallel
139
or line-field FD-OCT devices [22, 6, 23, 24] using spectrometers with 2-D
140
sensors (cameras) which result in single-shot B-scans.
141
Funding
142
This work was not funded by any grant. Our department had
infrastruc-143
ture funding from the Department of Science and Technology, Government
144
of India (DST)
-145 146
DST FIST 2012-2017 SR/FST/PSI-172/2012.
147 148
Acknowledgments
149
We convey our gratitude to Bhagawan Sri Sathya Sai Baba, the founder
150
Chancellor of our University, who guided and inspired us in our work.
151
References
152
[1] C. A. Puliafito, J. S. Schuman, M. R. Hee, J. G. Fujimoto, Optical
153
coherence tomography of ocular diseases, SLACK Inc., 1996.
154
[2] A. F. Fercher, K. Mengedoht, W. Werner, Eye-length measurement by
155
interferometry with partially coherent light, Optics Letters 13 (1988)
156
186–188.
[3] C. K. Hitzenberger, W. Drexler, A. F. Fercher, Measurement of corneal
158
thickness by laser Doppler interferometry., Investigative ophthalmology
159
& visual science 33 (1992) 98–103.
160
[4] J. Fujimoto, E. Swanson, The development, commercialization, and
161
impact of optical coherence tomography, Investigative ophthalmology
162
& visual science 57 (2016) OCT1–OCT13.
163
[5] W. Drexler, J. G. Fujimoto, Optical Coherence Tomography:
Technol-164
ogy and Applications, Second Edition, Springer International Publishing
165
Switzerland, 2015.
166
[6] H. Nandakumar, S. Parameshwaran, R. Gamini, S. Srivastava,
Artifact-167
free robust single-shot background subtraction for optical coherence
to-168
mography, OSA Continuum 2 (2019) 1556–1564.
169
[7] A. F. Fercher, C. K. Hitzenberger, G. Kamp, S. Y. El-Zaiat,
Measure-170
ment of intraocular distances by backscattering spectral interferometry,
171
Optics communications 117 (1995) 43–48.
172
[8] R. K. Wang, Z. Ma, A practical approach to eliminate autocorrelation
173
artefacts for volume-rate spectral domain optical coherence tomography,
174
Physics in Medicine & Biology 51 (2006) 3231.
175
[9] M. Shalaby, S. S. Al-Sowayan, Autocorrelation noise free optical
coher-176
ence tomography using the novel concept of resonant oct (roct), Journal
177
of the European Optical Society-Rapid Publications 12 (2016) 10.
178
[10] D. Hillmann, H. Spahr, H. Sudkamp, C. Hain, L. Hinkel, G. Franke,
G. H¨uttmann, Off-axis reference beam for full-field swept-source oct
180
and holoscopy, Optics Express 25 (2017) 27770–27784.
181
[11] F. K¨ottig, P. Cimalla, M. G¨artner, E. Koch, An advanced algorithm
182
for dispersion encoded full range frequency domain optical coherence
183
tomography, Opt. Express 20 (2012) 24925–24948.
184
[12] M. V. Sarunic, M. A. Choma, C. Yang, J. A. Izatt, Instantaneous
185
complex conjugate resolved spectral domain and swept-source oct using
186
3x3 fiber couplers, Opt. Express 13 (2005) 957–967.
187
[13] M. Wojtkowski, A. Kowalczyk, R. Leitgeb, A. F. Fercher, Full range
188
complex spectral optical coherence tomography technique in eye
imag-189
ing, Opt. Lett. 27 (2002) 1415–1417.
190
[14] E. Bo, S. Chen, D. Cui, S. Chen, X. Yu, Y. Luo, L. Liu, Single-camera
191
full-range high-resolution spectral domain optical coherence
tomogra-192
phy, Appl. Opt. 56 (2017) 470–475.
193
[15] W.-C. Kuo, C.-M. Lai, Y.-S. Huang, C.-Y. Chang, Y.-M. Kuo, Balanced
194
detection for spectral domain optical coherence tomography, Optics
195
Express 21 (2013) 19280–19291.
196
[16] E. Bo, X. Liu, S. Chen, X. Yu, X. Wang, L. Liu, Spectral-domain optical
197
coherence tomography with dual-balanced detection for auto-correlation
198
artifacts reduction, Optics Express 23 (2015) 28050–28058.
199
[17] A. Ozcan, M. J. F. Digonnet, G. S. Kino,
Minimum-phase-function-200
based processing in frequency-domain optical coherence tomography
sys-201
tems, J. Opt. Soc. Am. A 23 (2006) 1669–1677.
[18] B. J. Davis, T. S. Ralston, D. L. Marks, S. A. Boppart, P. S. Carney,
203
Autocorrelation artifacts in optical coherence tomography and
interfer-204
ometric synthetic aperture microscopy, Opt. Lett. 32 (2007) 1441–1443.
205
[19] Y. C. S. Hon Luen Seck, Ying Zhang, Autocorrelation noise removal
206
for optical coherence tomography by sparse filter design, Journal of
207
Biomedical Optics 17 (2012) 1 – 7 – 7.
208
[20] L. V. Wang, H.-i. Wu, Biomedical optics: principles and imaging, John
209
Wiley & Sons, 2012.
210
[21] V. Sudarshanam, K. Srinivasan, Universal dynamic phase-calibration
211
technique for fiber-optic interferometric sensors and phase modulators,
212
Optics Letters 14 (1989) 1287–1289.
213
[22] B. Grajciar, M. Pircher, A. F. Fercher, R. A. Leitgeb, Parallel fourier
214
domain optical coherence tomography for in vivo measurement of the
215
human eye, Optics Express 13 (2005) 1131–1137.
216
[23] S. Lawman, Y. Dong, B. M. Williams, V. Romano, S. Kaye, S. P.
Hard-217
ing, C. Willoughby, Y.-C. Shen, Y. Zheng, High resolution corneal and
218
single pulse imaging with line field spectral domain optical coherence
219
tomography, Opt. Express 24 (2016) 12395–12405.
220
[24] A. Kazaili, S. Lawman, B. Geraghty, A. Eliasy, Y. Zheng, Y. Shen,
221
R. Akhtar, Line-field optical coherence tomography as a tool for in vitro
222
characterization of corneal biomechanics under physiological pressures,
223
Scientific reports 9 (2019) 6321.
[25] H. Nandakumar, FDOCT, https://github.com/hn-88/FDOCT, 2019.
225
[26] G. Bradski, A. Kaehler, Opencv, Dr. Dobbs journal of software tools
226
(2000).
227
[27] H. Nandakumar, S. Srivastava, Data and code for analyzing performance
228
of qhy cmos cameras, Preprints 2018 (2018) 2018100179.
229
[28] Y. Zhu, W. Gao, Single-shot wavelength-independent phase-shifting
230
method for full-field optical coherence tomography, Appl. Opt. 58 (2019)
231
806–813.
232
[29] H. M. Subhash, Full-field and single-shot full-field optical coherence
233
tomography: A novel technique for biomedical imaging applications,
234
Advances in Optical Technologies vol. 2012 (2012) Article ID 435408.
235
[30] J. Ai, L. V. Wang, Spectral-domain optical coherence tomography:
236
Removal of autocorrelation using an optical switch, Applied Physics
237
Letters 88 (2006) 111115.