Article
Comparing Measures of Community Lineage
Diversity across North American Forests
Kyle G. Dexter1,2* , Ricardo A. Segovia1,3 and Andy Griffiths1
1 School of GeoSciences, University of Edinburgh, Edinburgh EH9 3FF, United Kingdom
2 Royal Botanic Garden Edinburgh, Edinburgh EH3 5LR, United Kingdom
3 Instituto de Ecología y Biodiversidad (IEB), Santiago, Chile
* Correspondence: kyle.dexter@ed.ac.uk ; Tel.: +44 (0) 131 650 7439
Version January 31, 2019 submitted to Forests
Abstract:Lineage diversity can refer to the number of genetic lineages within species or to the number 1
of deeper evolutionary lineages, such as genera or families, within a community. Community lineage 2
diversity (CLD) is of interest to ecologists, evolutionary biologists, biogeographers, and those setting 3
conservation priorities. Despite its relevance, it is not clear how to best quantify CLD. With North 4
American tree communities as an example, we test which taxonomic and phylogenetic metrics best 5
measure CLD. We find that phylogenetic metrics outperform taxonomic metrics. Faith’s phylogenetic 6
diversity performs well, but is skewed towards the number of lineages in recent time. The best metric 7
is newly derived here, and termed time integrated lineage diversity (TILD). Mapping the lineage 8
diversity of tree communities across the contiguous United States, we find a spatial pattern differing 9
from that of species richness in key areas. The Pacific Northwest, Great Lakes Region, state of Maine, 10
and south-eastern piedmont and coastal plain forests all emerge as areas high in lineage diversity, but 11
relatively lower in species richness. We urge the consideration of lineage diversity, as well as species 12
richness, when setting conservation priorities. 13
Keywords:Temperate forests; Species Richness; Lineage Diversity; Phylogenetic Diversity; United 14
States; Trees; TILD 15
1. Introduction 16
The evolutionary lineage is a fundamental concept in biology, denoting a group of organisms 17
connected by ancestor-descendent relationships [1]. Evolutionary lineages are hierarchically structured; 18
multiple younger evolutionary lineages can be nested within an overarching older lineage, or clade. 19
Thus, multiple genetically diverged lineages can exist within a single taxonomic species, and multiple 20
species can belong to older evolutionary lineages, such as genera, families or orders. Knowing the 21
number of lineages in different ecological communities and biogeographic regions gives insights into 22
evolutionary process, biogeographic history, and conservation priorities. For example, a community or 23
region that houses many lineages, and therefore more evolutionary history, may be a greater priority 24
for conservation than one that houses few. However, the conservation value of lineage diversity has 25
yet to be fully, and persuasively communicated [2–4]. Providing clear and accurate quantification of 26
lineage diversity may assist its integration into conservation practice. 27
In its most basic form, counting the number of lineages in communities could consist of counting 28
the number of species. However, the term lineage diversity is generally applied when the units are 29
not species, but a shallower or deeper evolutionary level, i.e. within or above the species taxonomic 30
rank. The majority of times the term lineage diversity has been used in the literature, it refers to the 31
number of diverged genetic lineages within species (e.g., [5–9]), but it has also been used for deeper 32
evolutionary levels (e.g., [10–14]). In this paper we focus on the latter, employing tree communities in 33
the contiguous United States to test various metrics by which community lineage diversity (hereafter, 34
CLD) might be quantified using taxonomic and phylogenetic data. 35
Taxonomy is a hierarchical system for organising biological diversity. As such, it provides an 36
apparently straightforward means of quantifying CLD at different evolutionary depths, for example by 37
tallying the number of genera, families or orders in communities. However, Linnean taxonomic ranks 38
are not ‘natural’ in the sense that they do not directly correlate to any precise evolutionary age. Some 39
clades of a given taxonomic rank may actually be younger than clades of a putatively lower taxonomic 40
rank. For example, the genusPinus(Pinaceae) may be as old as 100 million years [15], which is older 41
than most angiosperm families [16]. If one were to compare a community of fourPinusspecies with 42
a community of four angiosperm species belonging to different genera in the same family, and CLD 43
were estimated as the number of genera in each community, the angiosperm community would appear 44
to have 4x higher CLD. However, all four species in the community ofPinusmay have diverged from 45
each other prior to the origin of the most recent common ancestor of the four species in the angiosperm 46
community (similar to mock communities B and C in Fig. 1), which could mean that the community of 47
Pinushas greater conservation value in terms of encompassing greater total evolutionary history. 48
A B C
100 80 60 40 20 0
A) SR=3, PD=280, LD70=3, LD5=3
Time before Present (Myrs)
A B C
D
100 80 60 40 20 0
B) SR=4, PD=360, LD70=4, LD5=4
Time before Present (Myrs)
G F N P
100 80 60 40 20 0
C) SR=4, PD=180, LD70=1, LD5=4
Time before Present (Myrs)
E F G H I J
K
L
M N O P Q R S T
100 80 60 40 20 0
D) SR=16, PD=360, LD70=1, LD5=16
Time before Present (Myrs)
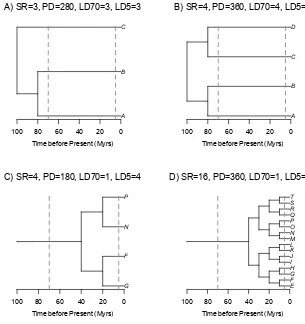
Figure 1.Example phylogenies for four communities (A,B,C,D) with contrasting species richness (SR), phylogenetic diversity (PD) and phylogenetic community structure (LD70 = number of lineages 70 Ma; LD5 = number of lineages 5 Ma). Time units are arbitrary.
The advent of molecular phylogenetics has allowed researchers to move past taxonomic 49
approaches to quantifying CLD. Using a temporally calibrated phylogeny, one can choose a certain 50
lineage age - X millions of years (Myrs) - and then readily estimate the number of lineages at X million 51
years ago (Ma) in a community. Further, one could examine how the number of lineages varies at 52
directly analogous to constructing a lineage through time plot for a given evolutionary clade [17], and 54
indeed, studies have proposed constructing lineage through time plots for individual communities 55
[18]. However, it is not clear at which evolutionary age, or phylogenetic depth, one should be counting 56
lineages. A community that has more lineages at one, deeper time slice might have fewer lineages at 57
another, more recent time slice (compare communities B vs. D in Fig. 1), which could be driven by 58
variation in diversification histories, community assembly, or numerous other processes. It would be 59
ideal to have a single, synthetic metric for CLD that integrates over the evolutionary history of the 60
clade being studied. 61
Faith (1992) developed a simple metric, phylogenetic diversity (PD), to quantify the evolutionary 62
history present in communities, which is calculated by summing the length of all branches in a 63
phylogeny that includes all taxa present in a community, and only those taxa. While this metric is 64
related to the number and age of evolutionary lineages present in a community, and thus may serve 65
as a proxy for CLD, Figure 1 demonstrates that inferences of CLD based on calculating PD may not 66
always be straightforward. In this contrived scenario, it seems clear that Community A has less CLD 67
than Community B and that Community C has less CLD than Community D. The calculations of PD, 68
and even species richness, would support this visual observation. Further, it seems plausible that 69
Community A has more lineage diversity than Community C, even though Community C has more 70
species. However, do Communities B and D really have identical CLD even though they have such 71
a discrepancy in species richness? Comparing Communities B and D is challenging because they 72
have such different phylogenetic structures. Community B has 4x as many lineages at 70 Ma, while 73
Community D has 4x as many lineages at 5 Ma. For this reason, researchers have suggested that the 74
amount of PD a community contains above or below that expected given its SR is a better measure of 75
CLD [12,13]. However, if we were to follow that approach, then Community C might be considered to 76
have more CLD than Community D (its ratio of PD:SR is twice that of Community D), even though 77
at all phylogenetic depths Community D has the same or more lineages than Community C. Clearly, 78
more work is needed to determine which metrics derived from phylogenies may provide the best 79
measures of CLD that integrate over evolutionary timescales. 80
The overarching goal of the present manuscript is to empirically compare different community 81
lineage diversity metrics, in order to determine the best synthetic measure of CLD over evolutionary 82
timescales. As our empirical example, we focus on tree communities in the contiguous United 83
States. These communities provide an ideal system for such an empirical study, as over 150,000 forest 84
inventory plots have been sampled in a standardised way by the U.S. National Forest Service and 85
existing time-calibrated phylogenies encompass nearly all species present in the plots. We use this 86
unparalleled community phylogenetic dataset to 1) test the ability of taxonomic and phylogenetic 87
metrics to measure CLD over multiple evolutionary ages, or phylogenetic depths and 2) map spatial 88
patterns of tree alpha CLD in the forests of the contiguous United States, which can serve as a means 89
to highlight areas of high lineage diversity for conservation attention. 90
2. Materials and Methods 91
2.1. Data Sources 92
We accessed compositional data from 177,549 plots sampled across the contiguous United States 93
by the Forest Inventory and Analysis (FIA) Program of the U.S. Forest Service [20], via the BIEN 94
package [21] for the R Statistical Environment (R Development Core Team 2018). The FIA protocol 95
records trees≥12.7 cm diameter at breast (dbh) in four 168.3m2subplots that are 36.6 m apart. The 96
main evident spatial data gaps in this dataset are the state of Louisiana and the eastern part of the state 97
of Kentucky. 98
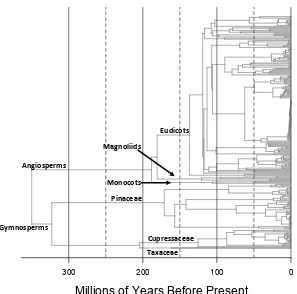
In order to obtain a phylogeny that covered all species in the FIA tree plot inventory dataset, 99
we combined the temporally calibrated ultrametric phylogenies for North American gymnosperm 100
gymnosperms at 350 Ma [22]. After resolving synonyms according to The Plant List Version 1.1 ( 102
http://www.theplantlist.org/), we manually added the tree species present in the FIA dataset, but 103
absent in the phylogeny. Their exact placement was based on consultations of the systematics literature 104
(see Table S1 for species added and associated literature reference), with the added taxon being placed 105
halfway along the branch leading to its sister species or clade in the phylogeny. The branch length 106
leading to the added taxon was set to a value such that the tree remained ultrametric. 107
300 200 100 0
Millions of Years Before Present
AngiospermsGymnosperms
Eudicots
Monocots Magnoliids
Pinaceae
Cupressaceae Taxaceae
Figure 2.Phylogeny of all tree species present in the contiguous United States in the US FIA dataset, based on the phylogenies for gymnosperms and angiosperms in Maet al.(2016).
2.2. Lineage Diversity Metrics 108
2.2.1. Taxonomic Measures 109
In the absence of phylogenetic data, the number of supraspecific lineages in communities can 110
be calculated as the number of taxa of a higher taxonomic rank. Classification systems are consistent 111
across angiosperms and gymnosperms up to the order level, and we therefore tabulated the following 112
taxonomic measures of lineage diversity for communities: number of genera, number of families 113
and number of orders. 114
2.2.2. Phylogenetic Measures 115
Since the advent of molecular phylogenetics, diverse metrics have been developed and 116
implemented to quantify the lineage, or evolutionary, diversity of communities from phylogenies 117
diversity’ [26], as our interest is in ‘how much’ lineage diversity is in communities, not how diverged 119
lineages are from each other in communities (e.g., as quantified by mean pairwise phylogenetic 120
distance) or how evenly lineages are represented (e.g, as quantified by phylogenetic species evenness; 121
[27]). In addition, conservation prioritisation is generally based on which species are present, not their 122
relative abundance (which could reflect disturbance histories or other idiosyncratic processes), and we 123
therefore focus on presence/absence metrics. This also increases the general utility of our results, as 124
abundance information is not available for many datasets. 125
We started by calculating the most basic metric of CLD,phylogenetic diversity, orPD[19], which 126
is the sum of all branch lengths in each community, including the branch that goes to the root of 127
all seed plants. We also include its estimate standardised for variation in species richness. This is 128
accomplished by calculating the first two moments of the null expectation for PD, given the number of 129
species in the community, and using them to calculate a standardised effect size. The moments of the 130
null distribution can be calculated by randomly shuffling the tips of the phylogeny many times, but 131
there is an analytical expectation for these moments, which is the approach we used [28]. We refer to 132
this metric as thestandardised phylogenetic diversity, orsPD. 133
We also calculated two additional proposed measures of the richness dimension of phylogenetic 134
diversity, thephylogenetic species richness, orPSR[27] and thesum of evolutionary distinctiveness, 135
orsumED[29]. PSR can essentially be considered a measure of species richness that takes into account 136
the phylogenetic relatedness of taxa in a community. If the community is comprised entirely of 137
closely related species, this will produce a lower value of PSR than if the community were derived 138
of distantly related taxa. In practice, this measure is obtained by multiplying the mean pairwise 139
phylogenetic distance between species in a community by its species richness (and dividing by two, so 140
that it represents distance to tips from the most recent common ancestor for each pair of species). For 141
sumED, we first calculated the evolutionary distinctiveness of each species in our dataset, based on 142
the entire phylogeny representing all species, following the fair proportions approach of Isaac et al. 143
(2007). This is essentially a measure of how phylogenetically isolated each species is, relative to the 144
given phylogeny. We then summed these evolutionary distinctiveness values for the species in each 145
community, following [29]. 146
As our overarching goal in this study was to quantify CLD over the full evolutionary time of the 147
clade of study (here, seed plants), we developed an additional metric that may better capture this, which 148
we termtime integrated lineage diversity, orTILD. If one constructs a lineage through time (LTT) 149
plot for each community (sensu [18]), one can simply integrate the area under this curve as a measure 150
of the total lineage diversity of the community over time. In fact, this integral is mathematically 151
identical to the phylogenetic diversity of the community, when including the root branch. However, 152
in considering an LTT plot built from extant species, as LTT plots for extant communities are, they 153
necessarily monotonically increase towards the present and, under a constant diversification rate, this 154
increase is exponential. The integral therefore is necessarily weighted towards the number of lineages 155
in recent evolutionary time compared to the number of lineages in deeper evolutionary time. Therefore, 156
in order to downweight the number of recent lineages when calculating TILD, we log-transformed the 157
y-axis (i.e. the number of lineages at each point in time) prior to taking the integral. 158
2.3. Statistical Analyses 159
There is wide variation in the number of individual trees sampled per plot (66±65 inds, mean 160
±s.d.; range 1-706 inds.), and all of the lineage diversity metrics that we calculated, except sPD, 161
were positively correlated with the number of individuals sampled (Pearson’s r = 0.58 – 0.67). In 162
order to obtain comparable estimates of CLD, we rarefied communities to the same number of 163
individuals. While rarefaction can be problematic because it excludes communities from analysis 164
below the abundance threshold used and introduces heteroscedasticity in the diversity estimate that 165
is related to the number of individuals sampled [31], we do not know of any estimates of CLD or 166
sampled). While Rao’s quadratic entropy has been proposed as an estimate of phylogenetic diversity 168
that is robust to variation in sample size, it measures the divergence dimension of phylogenetic 169
diversity, not the richness dimension [26], and is therefore not of interest to us here. 170
In order to determine the number of individuals to select in rarefactions, we first selected the 171
subset of communities that have at least 100 individuals (39,708 communities). We estimated the 172
species richness of these communities when rarefacted to 100 individuals (i.e. expected number of 173
species per 100 stems). We then rarefacted these communities to smaller numbers of individuals, and 174
observed how the richness estimate for a smaller number of stems correlated with the richness estimate 175
per 100 stems. Once communities were rarefacted to less than 25 stems, the correlation (pearson’s r) 176
between the two richness estimates dropped below 0.95. We therefore chose 25 individuals as the size 177
for rarefied communities. We repeated rarefactions 100 times, and calculated the average of each CLD 178
metric over these 100 rarefactions. 179
In order to assess the performance of each CLD metric over the evolutionary history of seed 180
plants, we calculated the spearman’s rank correlation (rho) between a given CLD metric and the 181
number of lineages at different phylogenetic depths (in intervals of 5 Myrs between the present and 182
the root of the seed plant phylogeny at 350 Ma). We used spearman’s rank correlation because these 183
relationships are not necessarily linear, and because our goal is to evaluate if communities would be 184
ranked similarly, e.g. for conservation prioritisation, if counting the number of lineages at a particular 185
time slice vs. using a given CLD metric. In order to obtain an overall measure of the performance of a 186
lineage diversity metric, we then obtained the mean of the spearman’s rho values at all phylogenetic 187
depths. All analyses were carried out in the R Statistical Environment (R Development Core Team) 188
using functions in the ape [33], picante [34], vegan [35] and PhyloMeasures [28] packages. The analysis 189
script is available in Appendix A. 190
3. Results 191
The majority of communities sampled at least 25 individuals (124,566 of 177,549 communities 192
or 70%), and were therefore included in analyses. We estimated CLD metrics for each community, 193
including constructing lineage through time (LTT) plots for each community to calculate the time 194
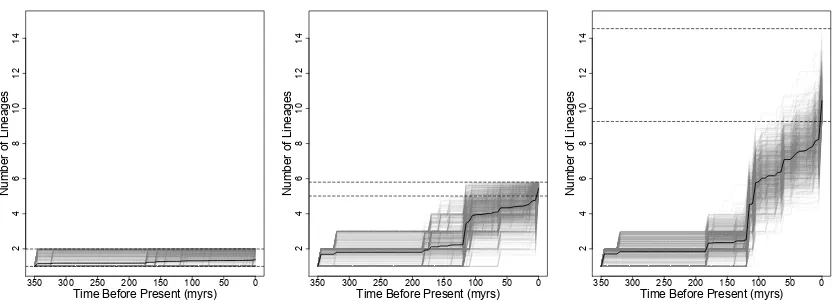
integrated lineage diversity (TILD). We show a sample of those LTT plots in Figure 3. The most 195
species-poor communities show little accumulation of lineages over time (Fig. 3a), as might be 196
expected given that they only have 1-2 species (12% of communities with at least 25 individuals have 197
only 1 or 2 species). The most species-rich communities have anywhere from 9 to 17 species per 25 198
stems (although only 8 of those communities have more than 15 and are not represented in the random 199
sample in Fig. 3c). Considering these species-rich communities, we see a wide range of variation 200
in when these communities accumulated lineage diversity. Although few included more than four 201
lineages before∼120 Ma. At 150 Ma, there were twice as many gymnosperm as angiosperm lineages 202
(six vs. three; Fig. 2). By 100 Ma, the picture had changed substantially, due almost entirely to the 203
radiation of the Eudicots (Fig. 2). This radiation is evident in the LTT plots for the most species-rich 204
communities (the big jump in number of lineages at∼120 Ma; Fig. 3c), and to a lesser degree in the 205
LTT plots for communities of average species richness (Fig. 3b). The second-largest step-change in 206
the number of lineages present in communities occurs between 5 Ma and the present, and again the 207
350 300 250 200 150 100 50 0
2
4
6
8
10
12
14
Time Before Present (myrs)
Number of Lineages
350 300 250 200 150 100 50 0
2
4
6
8
10
12
14
Time Before Present (myrs)
Number of Lineages
350 300 250 200 150 100 50 0
2
4
6
8
10
12
14
Time Before Present (myrs)
Number of Lineages
Figure 3. Lineage through time (LTT) plots for a sample of 1000 communities from a) the most species-poor communities (below 10% quantile in species richness per 25 stems), b) communities of average species richness (between the 45-55% quantiles) and c) the most species-rich communities (above the 90% quantile). The dark black lines give the mean LTT for these subsets, while the horizontal dashed grey lines show the minimum and maximum species richness per 25 stems for these subsets.
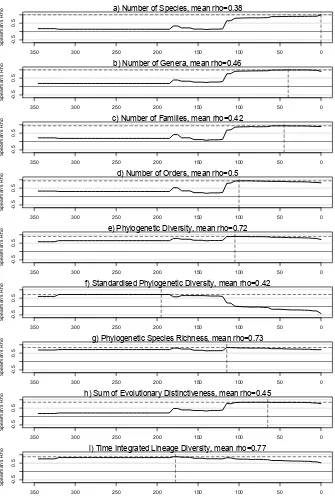
Except for standardised phylogenetic diversity (sPD), the different CLD metrics we calculated are 209
correlated with each other (Pearson’s r = 0.61-0.96) and with the number of species in communities 210
(Pearson’s r = 0.59-0.76; Fig. S1). The correlation of species richness with the number of lineages 211
declines with increasing phylogenetic depth, dropping to very low values prior to the radiation of 212
the Eudicots (Fig. 4). The taxonomic measures of CLD all show a similar pattern; i.e. none show a 213
strong correlation with number of lineages prior to∼120 Ma. Because of this, none of the taxonomic 214
measures of lineage diversity show a mean correlation over evolutionary time greater than 0.5. 215
The measures of lineage diversity derived from the molecular phylogeny are variable in their 216
ability to consistently measure CLD over the full breadth of the evolutionary history of seed plants 217
(Fig. 4). Neither sPD or sum of evolutionary distinctiveness (sumED) show high mean correlations, 218
and these two metrics show contrasting patterns over phylogenetic depth. sPD is correlated well 219
with the number of lineages deep in evolutionary time, while sumED shows a pattern more similar 220
to taxonomic measures of lineage diversity. The best performing metric of lineage diversity is the 221
newly-derived measure, time integrated lineage diversity (TILD), but phylogenetic diversity (PD) and 222
phylogenetic species richness (PSR) also performed well. PD and PSR show stronger correlations with 223
the number of lineages in recent evolutionary time, while TILD shows stronger correlations with the 224
350 300 250 200 150 100 50 0
-0.5
0.5
Age of Lineages
Spearman's Rho
a) Number of Species, mean rho=0.38
350 300 250 200 150 100 50 0
-0.5
0.5
Age of Lineages
Spearman's Rho
b) Number of Genera, mean rho=0.46
350 300 250 200 150 100 50 0
-0.5
0.5
Age of Lineages
Spearman's Rho
c) Number of Families, mean rho=0.42
350 300 250 200 150 100 50 0
-0.5
0.5
Age of Lineages
Spearman's Rho
d) Number of Orders, mean rho=0.5
350 300 250 200 150 100 50 0
-0.5
0.5
Age of Lineages
Spearman's Rho
e) Phylogenetic Diversity, mean rho=0.72
350 300 250 200 150 100 50 0
-0.5
0.5
Age of Lineages
Spearman's Rho
f) Standardised Phylogenetic Diversity, mean rho=0.42
350 300 250 200 150 100 50 0
-0.5
0.5
Age of Lineages
Spearman's Rho
g) Phylogenetic Species Richness, mean rho=0.73
350 300 250 200 150 100 50 0
-0.5
0.5
Age of Lineages
Spearman's Rho
h) Sum of Evolutionary Distinctiveness, mean rho=0.45
350 300 250 200 150 100 50 0
-0.5
0.5
Spearman's Rho
i) Time Integrated Lineage Diversity, mean rho=0.77
Figure 4. Spearman’s rank correlations between different global measures of community lineage diversity and the number of lineages at different phylogenetic depths. The mean value of spearman’s rho across all depths (excluding t = 0 and 350) is given above each plot. The phylogenetic depth at which the maximum correlation is found is marked with dashed lines going to the x and y-axes.
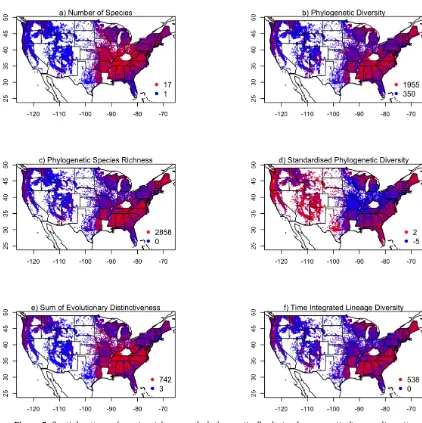
The number of species per 25 trees in plots shows clear spatial patterns across the contiguous 226
United States. Low values are generally observed west of the Mississippi River, while east of the 227
Mississippi River, low values are observed in Florida and around the Great Lakes. The highest values 228
are in the central part of the eastern United States, centred around Kentucky and Tennessee. The spatial 229
pattern of sPD contrasts strongly with that for species richness, which is not unexpected given that the 230
two measures are negatively correlated (Fig. S1). The remaining phylogenetically-derived CLD metrics 231
show spatial patterns generally similar to that for species richness, but with key areas of divergence. 232
There is more variation in CLD metrics in the western United States than there is in species richness. 233
south. The state of Maine in the far northeast of the United States also shows high lineage diversity. 235
Meanwhile, most phylogenetic metrics of CLD show the region around the southern Appalachians to 236
have higher CLD than regions to their north and west, whereas Fig. 5a shows them to have comparable 237
species richness. 238
Figure 5.Spatial pattern of species richness and phylogenetically-derived community lineage diversity metrics per 25 trees for individual plots across the contiguous United States (n = 124,566 plots), with plots coloured according to their value. The legends gives the maximum and minimum values.
4. Discussion 239
Community lineage diversity (CLD) metrics derived from a phylogeny did a better job of capturing 240
lineage diversity of tree communities over the full evolutionary depth of seed plants than did taxonomic 241
metrics, such as the number of genera or families. The best performing metric was a new one, 242
derived here, which we term time integrated lineage diversity (TILD). This metric, and all other 243
phylogenetically-derived CLD metrics, give a different spatial pattern across the contiguous United 244
States than that found for species richness. If prioritisation schemes were to be based solely on the 245
number of tree species per community, the entire western half of the US would receive less conservation 246
attention. This is because the most species-rich tree communities in the contiguous US are dominated 247
by angiosperms, particularly Eudicots, and these are more diverse in the eastern US. Yet western 248
represent substantial reservoirs of evolutionary history, as reflected in CLD values comparable to the 250
most lineage-diverse tree communities in the eastern US. 251
4.1. Taxonomic measures of lineage diversity 252
In many studies [12,36], species richness has been shown to be strongly correlated with 253
phylogenetic diversity (PD), and thus it has been argued that species richness may be a suitable 254
proxy for CLD [37]. Our study suggests that, at least for tree communities in the contiguous US, this is 255
not the case. Higher-level taxonomic measures that we explored, specifically the numbers of genera, 256
families and orders in communities, do not perform much better. As expected, as higher taxonomic 257
ranks are used, strong correlations with number of lineages persist deeper into evolutionary time 258
(compare the x-intercept of highest correlation for different taxonomic ranks in Fig. 3), but none of 259
the taxonomic measures provide a high correlation with number of lineages prior to∼120 Ma. This 260
is perhaps unsurprising as the majority of lineages deeper in evolutionary time are gymnosperms, 261
and all the gymnosperms in our dataset come from a single order, three families and 15 genera, while 262
angiosperms dominate the variation in these taxonomic measures of CLD with 18 orders, 35 families 263
and 68 genera. Thus, for clades with highly imbalanced phylogenies, as for seed plants, taxonomic 264
measures of lineage diversity are not likely to provide an adequate, synthetic measure of CLD [38]. 265
4.2. Phylogenetic measures of lineage diversity 266
The best performing metric in this study, in terms of maintaining a high correlation with number 267
of lineages at all phylogenetic depths, was time integrated lineage diversity (TILD), a metric newly 268
developed here. This metric represents the area beneath a lineage through time plot where the number 269
of lineages per time slice has been log-transformed. TILD is mathematically related to PD, which 270
is identical to the area beneath a raw (i.e., non-log-transformed) lineage through time plot. PD was 271
originally conceived as a metric to aid conservation prioritisation [19], and it has always been properly 272
interpreted as a measure of the total evolutionary diversity in communities, which is certainly worth 273
quantifying. But, it is strongly skewed towards the number of lineages present in recent evolutionary 274
time, downweighting older evolutionary divergences. We suggest that researchers may use PD to 275
quantify CLD more recently in evolutionary time, and complementarily, TILD may be more suitable to 276
obtain a measure of lineage diversity for older clades. The phylogenetic species richness (PSR; [27]) 277
is strongly correlated with both TILD and PD (Fig. S1) and shows a similar spatial pattern to these 278
two metrics (Fig. 5). However, as TILD and PD are both directly interpretable in terms of numbers of 279
lineages, we advocate for their use as measures of lineage diversity. 280
For this dataset, the standardised phylogenetic diversity (sPD) correlates well with the number of 281
lineages deep in evolutionary time, but not with numbers of lineages in recent evolutionary time. In 282
fact, sPD is negatively correlated with numbers of lineages less than 70 million years old. We suggest 283
that sPD may better serve as a metric of phylogenetic community structure, which is interesting in its 284
own right [39], but that it should not be used as a measure of lineage diversity in communities. Our 285
dataset appears to show a negative correlation between species richness and sPD, meaning that more 286
species-rich communities are more phylogenetically clustered. This would argue against a role for 287
competitive exclusion of closely related species in structuring tree communities in the contiguous US 288
(c.f. results of Dexteret al.2017 for the Amazon). However, caution is needed in interpreting this result, 289
as sPD may artefactually decline with increasing species richness [41]. Further, more focused studies 290
of younger clades in single ecological regions have given the opposite result (e.g., [42]). 291
Like sPD, the sum of evolutionary distinctiveness in communities, sumED showed a weaker 292
mean correlation with number of lineages over the full evolutionary history of seed plants than TILD, 293
PD or PSR. In contrast to sPD, it showed weaker correlations deeper in evolutionary time and stronger 294
relationships in shallower evolutionary time (Fig. 4). In fact, sumED showed a very similar pattern to 295
taxonomic metrics of lineage diversity (Fig. 4), and of the phylogenetically-derived metrics in this study, 296
metric, sumED has a clear intuitive value, since it represents the totality of phylogenetic diversity 298
in a given community that is rare in the entire dataset, but it will be sensitive to phylogenetic taxon 299
sampling in the overall dataset, even if all taxa in a given community are present in the phylogeny 300
(see Isaacet al.2007 for full explanation of how ED is derived for each species). Conversely, PD and 301
TILD will be insensitive to the sampling level of species not present in a given community and may 302
therefore have more general utility. 303
4.3. Tree diversity patterns across the contiguous United States 304
In this study, we have quantified various measures of CLD at the alpha level for tree communities 305
across the contiguous United States. Consistent with previous assessments [43,44], the most evident 306
spatial contrast in the species richness pattern is between the eastern and western United States. To 307
a very coarse approximation, this reflects the dominance of gymnosperms in the western United 308
States, the dominance of angiosperms in the eastern United States, and the fact that angiosperms are a 309
much more diverse clade than gymnosperms (even when focusing only on trees). It is notable that 310
the differences in species richness between communities of average species richness versus the most 311
species-rich communities arise almost entirely from diversification that happened after 120 Ma, i.e. 312
since the radiation of the Eudicots (Fig. 3). Eudicots represent the majority of species in our dataset 313
(Fig. 2) and the large majority of species in our most species-rich communities. 314
Previous studies have identified the high plateau south of the Appalachian Mountains [43], 315
and the Florida panhandle, Alabama/Georgia border region [44], as areas of maximal tree species 316
richness. In contrast we found the highest tree species richness in a region centred on Kentucky 317
and Tennessee, which corresponds to the mixed mesophytic forest region [45]. The first part of the 318
name reflects that there are no particularly dominant tree species in the region and most forest stands 319
have a mix of dominant species. Braun (1950) recognised the exceptional tree species richness of this 320
region and characterised it as “the association of the Deciduous Forest which occupies the area of 321
optimum moisture and temperature conditions of North America” (p. 42). Indeed, moisture stress 322
for plants is lower in this region of the US compared to regions southeast of the Appalachians or 323
the entire western US, while temperatures do not reach as extreme lows as the northern parts of the 324
contiguous US. Meanwhile, as the second part of the name, mesophytic, implies, the forests here are 325
also found on more fertile soils compared to other forests in the US. Thus, the high alpha diversity of 326
tree communities in this region may reflect an environment that is the most benign for the majority of 327
tree species occurring in the contiguous United States. This is similar to the pattern found in another 328
large biogeographic region, the Amazon, where the most species-rich tree communities are found 329
in the western Amazon, which has more fertile soils and is subject to less moisture stress than the 330
southern or eastern Amazon [12]. 331
The spatial pattern of variation in tree species richness does not show a standard latitudinal 332
gradient, which would anticipate highest species richness in the areas closest to the equator. In the 333
western US, this may be attributable to severe moisture stress, as much of the south-western US is 334
desert and lacks trees. Meanwhile, the south-eastern US is bordered by the Gulf of Mexico, and many 335
species that could likely now occur in this region went extinct during Pleistocene climatic cycles [46]. 336
Thus, biogeographic history is also playing a role in determining the composition of the species pool 337
that is available to colonise local communities. 338
The spatial pattern of alpha CLD in tree communities shows several evident contrasts with 339
the spatial pattern of species richness. With respect to tree species richness, the western US shows 340
almost uniformly low values, at least in comparison to the eastern US, but CLD metrics show much 341
greater variation. One evident hotspot of lineage diversity is in the temperate rain forests of the 342
Pacific northwest, with high CLD values then extending down the western flank of the Sierra Nevada 343
mountains. This temperate rain forest region includes the ‘Miracle Mile’ in the Klamath mountains of 344
northern California which holds 18 species of conifers [47], albeit not that many occur in any single FIA 345
Nevada mountain range. Presumably the arid conditions on the eastern side of these mountains limit 347
tree CLD. Though species richness minima to the east of the Sierra Nevada (as well as the Rockies) have 348
previously been noted [43], this contrast across mountain ranges is most evident when considering 349
CLD. Other regions of notable CLD in the western US include the Chiracahua mountains of southern 350
Arizona and northern Idaho. 351
In the eastern United States as well, the spatial pattern of CLD contrasts with that of species 352
richness, although there are regions that are high for both diversity measures (e.g. the southern 353
Appalachians). The most north-eastern state in the contiguous US (Maine) as well as the area around 354
the Great Lakes emerge as regions of high CLD, which is presumably due to the increasing prevalence 355
of conifers in the far north and their deep evolutionary heritage. Meanwhile, the mixed mesophytic 356
forest region that has the highest tree species richness values does not show the highest CLD values. 357
Higher CLD is found to the south and east of the mixed mesophytic forest region, and in the southern 358
Appalachians and parts of the south-eastern Piedmont and coastal plain regions. The south-eastern 359
United States was highlighted as a region of high angiosperm tree PD in a previous study based 360
on range maps [48], and our results show this is consistent when using inventory data, and when 361
incorporating gymnosperms into the quantification of overall seed plant CLD. The average age of 362
angiosperm families in the southeastern US tree community is higher than anywhere else in the 363
contiguous US [49] as this region, particularly the coastal plain, house many tree species (e.g., Sabal 364
species [Arecaeae], textitPersea borbonia [Lauraceae], textitAnnona glabra [Annonaceae]) that belong 365
to old, largely tropical families. This incursion of tropical lineages into the south-eastern US elevates 366
CLD values in the south-eastern coastal plain. 367
5. Conclusions 368
Our study has shown that phylogenetically-derived metrics of community lineage diversity 369
outperform taxonomically-derived metrics. Therefore, molecular phylogenies should play a key role 370
in informing conservation prioritisation schemes. Thus, the continued effort to sequence all species in 371
the tree of life receives clear support from our study. As for recommended metrics, the phylogenetic 372
diversity of communities is a valid measure of CLD, and we do not suggest that the many previous 373
studies to use the metric are invalid. Rather, we stress that it is biased towards the diversity of recently 374
derived lineages, and we urge consideration of the newly developed metric TILD (time integrated 375
lineage diversity), which may be more representative of CLD over the full evolutionary history of the 376
clade of study. 377
We used an empirical dataset on tree communities of the contiguous United States to explore 378
these different metrics of CLD. We found that the spatial patterns of CLD differ in important ways 379
from the spatial patterns of species richness, for example by highlighting the high conservation 380
value of temperate rainforests in the Pacific northwest. However, it would be naïve to suggest that 381
conservationists in the United States were unaware of the high conservation value of those forests. 382
Indeed, the tree flora of the United States is likely well enough known, such that there is already good 383
awareness of which areas have particularly high or low conservation value with respect to tree species 384
composition and lineage diversity. Where these metrics may be particularly useful is in less well 385
known floras, such as in many tropical biogeographic regions. There has been one study of variation in 386
lineage diversity across∼300 sites in the rain forests of the Amazon basin [12], but we know of no such 387
similar study across the Congo Basin or southeast Asian rain forests, much less the more extensive 388
tropical dry biomes. 389
Author Contributions: K.G.D. and R.A.S. conceived the manuscript and led analyses. A.G. contributed to 390
Funding:Please add: “This research received no external funding” or “This research was funded by NAME OF 392
FUNDER grant number XXX.” and and “The APC was funded by XXX”. Check carefully that the details given 393
are accurate and use the standard spelling of funding agency names athttps://search.crossref.org/funding, any 394
errors may affect your future funding. 395
Acknowledgments: R.A.S. is supported by Newton International Fellowship from The Royal Society and 396
by Conicyt PFCHA/Postdoctorado Becas Chile/2017 N◦ 3140189. K.G.D. was supported by a Leverhulme 397
International Academic Fellowship. 398
Conflicts of Interest:The authors declare no conflict of interest. The funders had no role in the design of the 399
study; in the collection, analyses, or interpretation of data; in the writing of the manuscript, or in the decision to 400
publish the results. 401
Appendix A. 402
R Codes to execute analyses. 403
References 404
1. de Queiroz, K. The general lineage concept of species, species criteria, and the process of speciation. In 405
Endless Forms: Species and Speciation; D.J. Howard, S.B.E., Ed.; Oxford University Press: New York, 1998; pp. 406
57–75. 407
2. Winter, M.; Devictor, V.; Schweiger, O. Phylogenetic diversity and nature conservation: where are we? 408
Trends in Ecology & Evolution2013,28, 199–204. 409
3. Geeta, R.; Lohmann, L.G.; Magallón, S.; Faith, D.P.; Hendry, A.; Crandall, K.; De Meester, L.; Webb, C.; 410
Prieur-Richard, A.H.; Mimura, M.; others. Biodiversity only makes sense in the light of evolution. Journal
411
of biosciences2014,39, 333–337. 412
4. Forest, F.; Crandall, K.A.; Chase, M.W.; Faith, D.P. Phylogeny, extinction and conservation: embracing 413
uncertainties in a time of urgency. Philosophical transactions Royal Society B 2015, 370, 20140002. 414
doi:http://dx.doi.org/10.1098/rstb.2014.0002. 415
5. Kozak, K.H.; Blaine, R.A.; Larson, A. Gene lineages and eastern North American palaeodrainage basins: 416
phylogeography and speciation in salamanders of the Eurycea bislineata species complex. Molecular
417
Ecology2006,15, 191–207. 418
6. Oliver, P.; Keogh, J.S.; Moritz, C. New approaches to cataloguing and understanding evolutionary diversity: 419
a perspective from Australian herpetology. Australian Journal of Zoology2015,62, 417–430. 420
7. Milián-García, Y.; Jensen, E.L.; Madsen, J.; Álvarez Alonso, S.; Serrano Rodríguez, A.; Espinosa López, 421
G.; Russello, M.A. Founded: Genetic Reconstruction of Lineage Diversity and Kinship Informs Ex situ 422
Conservation of Cuban Amazon Parrots (Amazona leucocephala).Journal of Heredity2015,106, 573–579. 423
8. Becking, L.E.; de Leeuw, C.A.; Knegt, B.; Maas, D.L.; De Voogd, N.J.; Suyatna, I.; Peijnenburg, K.T.; others. 424
Highly divergent mussel lineages in isolated Indonesian marine lakes.PeerJ2016,4, e2496. 425
9. Moritz, C.C.; Pratt, R.C.; Bank, S.; Bourke, G.; Bragg, J.G.; Doughty, P.; Keogh, J.S.; Laver, R.J.; Potter, S.; 426
Teasdale, L.C.; others. Cryptic lineage diversity, body size divergence, and sympatry in a species complex 427
of Australian lizards (Gehyra).Evolution2018,72, 54–66. 428
10. Linder, H.P.; Eldenas, P.; Briggs, B.G. Contrasting patterns of radiation in African and Australian 429
Restionaceae. Evolution2003,57, 2688–2702. 430
11. Jønsson, K.A.; Fabre, P.H.; Ricklefs, R.E.; Fjeldså, J. Major global radiation of corvoid birds originated in 431
the proto-Papuan archipelago.Proceedings of the National Academy of Sciences2011, p. 201018956. 432
12. Honorio Coronado, E.N.; Dexter, K.G.; Pennington, R.T.; Chave, J.; Lewis, S.L.; Alexiades, M.N.; Alvarez, 433
E.; Alves de Oliveira, A.; Amaral, I.L.; Araujo-Murakami, A.; others. Phylogenetic diversity of Amazonian 434
tree communities. Diversity and Distributions2015,21, 1295–1307. 435
13. Rezende, V.L.; Dexter, K.G.; Pennington, R.T.; Oliveira-Filho, A.T. Geographical variation in the 436
evolutionary diversity of tree communities across southern South America.Journal of biogeography2017, 437
44, 2365–2375. 438
14. Law, C.J.; Slater, G.J.; Mehta, R.S. Lineage diversity and size disparity in Musteloidea: testing patterns of 439
15. Leslie, A.B.; Beaulieu, J.; Holman, G.; Campbell, C.S.; Mei, W.; Raubeson, L.R.; Mathews, S. An overview 441
of extant conifer evolution from the perspective of the fossil record. American journal of botany2018, 442
105, 1531–1544. 443
16. Magallón, S.; Gómez-Acevedo, S.; Sánchez-Reyes, L.L.; Hernández-Hernández, T. A metacalibrated 444
time-tree documents the early rise of flowering plant phylogenetic diversity. New Phytologist2015, 445
207, 437–453. 446
17. Raup, D.M.; Gould, S.J.; Schopf, T.J.; Simberloff, D.S. Stochastic models of phylogeny and the evolution of 447
diversity. The Journal of Geology1973,81, 525–542. 448
18. Yguel, B.; Jactel, H.; Pearse, I.S.; Moen, D.; Winter, M.; Hortal, J.; Helmus, M.R.; Kühn, I.; Pavoine, S.; 449
Purschke, O.; others. The evolutionary legacy of diversification predicts ecosystem function. The American
450
Naturalist2016,188, 398–410. 451
19. Faith, D.P. Conservation evaluation and phylogenetic diversity.Biological conservation1992,61, 1–10. 452
20. Burrill, Elizabeth A.; Wilson, A.M.T.J.A.P.S.A.M.J.C.G.C.B.L.D.W.The Forest Inventory and Analysis Database:
453
database description and user guide version 8.0 for Phase 2. U.S.Department of Agriculture, Forest Service, 454
Available at web address:http://www.fia.fs.fed.us/library/database-documentation/, 2018. 455
21. Maitner, B.S.; Boyle, B.; Casler, N.; Condit, R.; Donoghue, J.; Durán, S.M.; Guaderrama, D.; Hinchliff, C.E.; 456
Jørgensen, P.M.; Kraft, N.J.; others. The bien r package: A tool to access the Botanical Information and 457
Ecology Network (BIEN) database. Methods in Ecology and Evolution2018,9, 373–379. 458
22. Harris, L.W.; Davies, T.J. A Complete Fossil-Calibrated Phylogeny of Seed Plant Families as a Tool for 459
Comparative Analyses: Testing the ‘Time for Speciation’Hypothesis. PloS one2016,11, e0162907. 460
23. Nunn, C.L.; Altizer, S.; Sechrest, W.; Jones, K.E.; Barton, R.A.; Gittleman, J.L. Parasites and the evolutionary 461
diversification of primate clades. the american naturalist2004,164, S90–S103. 462
24. Mazel, F.; Guilhaumon, F.; Mouquet, N.; Devictor, V.; Gravel, D.; Renaud, J.; Cianciaruso, M.V.; Loyola, R.; 463
Diniz-Filho, J.A.F.; Mouillot, D.; others. Multifaceted diversity–area relationships reveal global hotspots of 464
mammalian species, trait and lineage diversity. Global ecology and biogeography2014,23, 836–847. 465
25. Blaimer, B.B.; Brady, S.G.; Schultz, T.R.; Fisher, B.L. Functional and phylogenetic approaches reveal the 466
evolution of diversity in a hyper diverse biota.Ecography2015,38, 901–912. 467
26. Tucker, C.M.; Cadotte, M.W.; Carvalho, S.B.; Davies, T.J.; Ferrier, S.; Fritz, S.A.; Grenyer, R.; Helmus, M.R.; 468
Jin, L.S.; Mooers, A.O.; others. A guide to phylogenetic metrics for conservation, community ecology and 469
macroecology. Biological Reviews2017,92, 698–715. 470
27. Helmus, M.R.; Bland, T.J.; Williams, C.K.; Ives, A.R. Phylogenetic measures of biodiversity.The American
471
Naturalist2007,169, E68–E83. 472
28. Tsirogiannis, C.; Sandel, B. PhyloMeasures: A package for computing phylogenetic biodiversity measures 473
and their statistical moments. Ecography2016,39, 709–714. 474
29. Safi, K.; Armour-Marshall, K.; Baillie, J.E.; Isaac, N.J. Global patterns of evolutionary distinct and globally 475
endangered amphibians and mammals.PloS one2013,8, e63582. 476
30. Isaac, N.J.; Turvey, S.T.; Collen, B.; Waterman, C.; Baillie, J.E. Mammals on the EDGE: conservation 477
priorities based on threat and phylogeny.PloS one2007,2, e296. 478
31. McMurdie, P.J.; Holmes, S. Waste Not, Want Not: Why Rarefying Microbiome Data Is Inadmissible. PLOS
479
Computational Biology2014,10, 1–12. doi:10.1371/journal.pcbi.1003531. 480
32. R Core Team. R: A Language and Environment for Statistical Computing. R Foundation for Statistical 481
Computing, Vienna, Austria, 2018. 482
33. Paradis, E.; Claude, J.; Strimmer, K. APE: analyses of phylogenetics and evolution in R language. 483
Bioinformatics2004,20, 289–290. 484
34. Kembel, S.W.; Cowan, P.D.; Helmus, M.R.; Cornwell, W.K.; Morlon, H.; Ackerly, D.D.; Blomberg, S.P.; 485
Webb, C.O. Picante: R tools for integrating phylogenies and ecology. Bioinformatics2010,26, 1463–1464. 486
35. Oksanen, J.; Blanchet, F.G.; Kindt, R.; Legendre, P.; Minchin, P.R.; O’hara, R.; Simpson, G.L.; Solymos, P.; 487
Stevens, M.H.H.; Wagner, H.; others. Package ‘vegan’. Community ecology package, version2013,2. 488
36. Forest, F.; Grenyer, R.; Rouget, M.; Davies, T.; Cowling, R.; Faith, D.; Balmford, A.; Manning, J.; Proches, S.; 489
van der Bank, M. Preserving the evolutionary potential of floras in biodiversity hotspots. Nature2007, 490
37. Rapacciuolo, G.; Graham, C.H.; Marin, J.; Behm, J.E.; Costa, G.C.; Hedges, S.B.; Helmus, M.R.; Radeloff, 492
V.C.; Young, B.E.; Brooks, T.M. Species diversity as a surrogate for conservation of phylogenetic and 493
functional diversity in terrestrial vertebrates across the Americas. Nature ecology & evolution2018, p. 1. 494
38. Miller, J.T.; Jolley-Rogers, G.; Mishler, B.D.; Thornhill, A.H. Phylogenetic diversity is a better measure of 495
biodiversity than taxon counting. Journal of Systematics and Evolution2018,56, 663–667. 496
39. Webb, C. Phylogenies and community ecology. Annu Rev Ecol Evol S2002,33, 475–505. 497
40. Dexter, K.G.; Lavin, M.; Torke, B.M.; Twyford, A.D.; Kursar, T.A.; Coley, P.D.; Drake, C.; 498
Hollands, R.; Pennington, R.T. Dispersal assembly of rain forest tree communities across 499
the Amazon basin. Proceedings of the National Academy of Sciences 2017, 114, 2645–2650, 500
[https://www.pnas.org/content/114/10/2645.full.pdf]. doi:10.1073/pnas.1613655114. 501
41. Sandel, B. Richness-dependence of phylogenetic diversity indices.Ecography2018,41, 837–844. 502
42. Cavender-Bares, J.; Ackerly, D.D.; Baum, D.A.; Bazzaz, F.A. Phylogenetic Overdispersion in Floridian 503
Oak Communities. The American Naturalist2004,163, 823–843,[https://doi.org/10.1086/386375]. PMID: 504
15266381, doi:10.1086/386375. 505
43. Currie, D.J.; Paquin, V. Large-scale biogeographical patterns of species richness of trees. Nature1987, 506
329, 326–327. 507
44. Jenkins, C.N.; Van Houtan, K.S.; Pimm, S.L.; Sexton, J.O. US protected lands mismatch biodiversity 508
priorities.Proceedings of the National Academy of Sciences of the United States of America2015,112, 5081–5086. 509
45. Braun, E.L.; others. Deciduous forests of eastern North America. Deciduous forests of Eastern North America.
510
1950. 511
46. Latham, R.E.; Ricklefs, R.E. Continental comparisons of temperate-zone tree species diversity. Species
512
diversity in ecological communities: historical and geographical perspectives1993, pp. 294–314. 513
47. DeSiervo, M.H.; Jules, E.S.; Kauffmann, M.E.; Bost, D.S.; Butz, R.J. REVISTING JOHN SAWYER AND 514
DALE THORNBURGH’S 1969 VEGETATION PLOTS IN THE RUSSIAN WILDERNESS: A LEGACY 515
CONTINUED.Fremontia2016, p. 20. 516
48. Ma, Z.; Sandel, B.; Svenning, J.C. Phylogenetic assemblage structure of North American trees is more 517
strongly shaped by glacial–interglacial climate variability in gymnosperms than in angiosperms.Ecology
518
and Evolution2016,6, 3092–3106. 519
49. Hawkins, B.A.; Rueda, M.; Rangel, T.F.; Field, R.; Diniz-Filho, J.A.F. Community phylogenetics at the 520
biogeographical scale: cold tolerance, niche conservatism and the structure of North American forests. 521
Journal of Biogeography2014, 41, 23–38, [https://onlinelibrary.wiley.com/doi/pdf/10.1111/jbi.12171]. 522